Trump’s Approval: Still Positive, but Overperformance with Democratic-Leaning Groups May Be Hard to Maintain
A Commentary By Kyle Kondik
KEY POINTS FROM THIS ARTICLE
— As his second term enters its second month, Donald Trump retains a positive approval rating in polling averages.
— However, his numbers in polling averages are weaker now than a few weeks ago, driven more by an increase in disapproval than a decline in approval.
— Compared to his 2024 performance with certain demographic groups based on the national exit poll, Trump is overperforming the most with some typically Democratic constituencies.
Trump’s approval versus his 2024 performance
Donald Trump starts his second month in office today (it is his 32nd day of his second term), so it’s a good time to check in on the early impressions of his presidency.
As of Wednesday afternoon, Trump’s approval and disapproval ratings in national polls were very similar in averages provided by the two major polling aggregators, FiveThirtyEight and RealClearPolitics.
Trump was at 48.7% approve/46.2% disapprove (+2.5 points net approval) in 538 and 49.2% approve/46.9% disapprove (+2.3 points) in RCP. The averages are computed in different ways and don’t include all of the same polls, but they both tell the same basic story.
The current averages show some decline for Trump since the first approval polls of his second term. The first 538 finding showed Trump’s approval at 49.7% approve/41.5% disapprove (+8.2 points), so his net approval is nearly 6 points weaker now.
Meanwhile, RCP does not show its initial average, but if one just looks at the approval polls in its database with field dates only in January, it shows an average of 48.6% approve/44.3% disapprove (+4.3 points). So the RCP net approval is also lower now too.
Notice that Trump’s current job approval rating in both averages is fairly similar to the initial average. Trump’s approval of around 49% on average is also very similar to the share of the vote he received in November (49.7%).
Meanwhile, his disapproval (roughly 46%-47%) is a little bit lower than the 48.2% of the vote that Kamala Harris received in the fall, and Trump’s disapproval rising over the past month contributes more to his smaller net approval edge than his approval falling.
This is actually similar to what happened to Joe Biden in the first month of his presidency. If we just use the 538 average for Biden, he started off with a 53.1% approval rating and a 30.2% disapproval rating in the first average, or about +23 points on net (Jan. 23, 2021, so just a few days after he took office). A month later, Biden’s approval rating was actually a little bit higher, 54.8%, but his net approval (+18 points) was lower because his disapproval (36.9%) increased more than his approval. This makes sense: People who didn’t vote for a president, particularly in this politically polarized era, might give a new president the benefit of the doubt by either actively approving of him or not disapproving of him, but this probably will not go on indefinitely. This is also probably happening with Trump now as his disapproval slowly rises.
Biden’s approval would top out at about 55% in mid-March and then slowly decline as his disapproval increased and his approval declined, with his disapproval surpassing his approval at the start of September 2021, coinciding with the collapse of the Afghan government and the haphazard American withdrawal from the country (there’s little doubt Biden’s approval would have eventually turned net negative absent that event, though). Biden’s approval never turned net positive again, and he finished with a poor 37%/57% approval/disapproval spread.
During his first term, Trump himself saw his approval rating turn net negative roughly two weeks into his presidency, per 538, and it never turned net positive after that point.
Still, Trump is doing noticeably better than he was 8 years ago: A month into his first presidency, Trump was at 43.7% approval/50.2% disapproval, per 538. That said, Trump is also off to a weaker start than any other newly-elected president in the postwar, modern polling era, other than himself in his first term, again per 538’s historical averages. And his numbers, while still positive, are slipping a bit in the aggregate, even as his net approval is still a little bit better than his national popular vote margin from last year.
Getting the benefit of the doubt from some typically Democratic constituencies may at least partially explain why this is happening.
Adam Carlson, a former Democratic pollster and friend of the Crystal Ball, has been tracking Trump’s approval in national polls and averaging demographic crosstabs where available. Table 1 incorporates some of his findings and compares Trump’s net approval with certain groups with the 2024 national exit poll conducted for a variety of news outlets by Edison Research.
The exit poll is by no means perfect, and there are or will be other analyses of 2024 demographic voting patterns. One of them is a different 2024 voter analysis co-sponsored by the Associated Press and Fox News and conducted by NORC at the University of Chicago. Their findings are similar to the exit poll, although of the demographic traits we included on Table 1, two notable differences are that AP/Fox News found Trump doing better with 18-29 voters (losing them by just 4 points, instead of the Edison poll’s 11) but worse with Hispanics (losing them by 12 points instead of the exit poll’s 5).
In any event, comparing the Edison exit poll to the approval crosstabs averaged by Carlson does give us some sense of how Trump’s current approval compares to the 2024 voting patterns.
Note that while Carlson includes 16 total polls in his average, there are fewer polls in the individual demographic crosstabs. Sometimes national polls only include certain crosstabs, if they include any at all, and subgroup crosstabs can be noisy. Also, the universe of people that the exit poll is designed to reflect (the 2024 presidential electorate) is not the same as the universe of people that these polls are designed to reflect (adults, registered voters, or likely voters in January and February 2025) So take all of this with more than just a grain of salt.
Table 1: Trump approval by group vs. 2024 exit poll
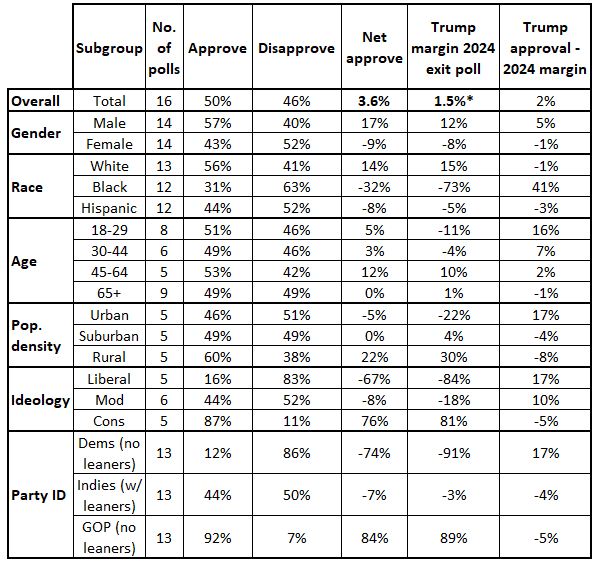
Note: *indicates actual national popular vote margin for Trump. All figures except overall net approval and Trump 2024 margin are rounded.
Source: Adam Carlson’s flat average of 16 national presidential approval polls conducted from Jan. 20 to Feb. 18. The polls are YouGov (CBS News), Pew Research, YouGov (The Economist), Quantus Insights (Trending Politics), Quinnipiac University, McLaughlin & Associates, Gallup, Research Co., Echelon Insights, AtlasIntel, SoCal Strategies (On Point Politics), Ipsos (Reuters), Marquette University Law School, Cygnal, Trafalgar Group/InsiderAdvantage, and SurveyUSA. For pollsters that released multiple polls already, only the most recent one is included. See Carlson’s spreadsheet for more information. Exit poll margins are from Edison Research’s 2024 exit poll conducted for several media organizations.
Carlson’s average finds Trump’s approval at +3.6 net, so a little better than the 538/RCP averages cited above. This average is also a couple of points better than Trump’s 1.5-point margin of victory in the popular vote.
Generally speaking, Trump is outperforming his 2024 exit poll showing the most with more Democratic-leaning constituencies. You can see this in Table 1 by looking at the Trump approval – 2024 margin column on the far right. A positive number means that Trump’s net approval in the subgroup is higher than his showing with the subgroup in the exit poll; a negative number means that his approval is lower than the exit poll finding among the subgroup.
Trump’s net approval ratings with whites and Hispanics are very similar to his exit poll margins with those groups. Trump’s approval with men is a little higher than his performance in the exit poll, while his approval with women is basically the same as his performance with them. Much was made of Trump’s male-focused campaign and men, collectively, are already consistently more Republican-leaning than women.
One group that really stands out on this table is Black voters: Trump lost them by 73 points in the exit poll, which was still an improvement on his past performance, but his approval with that group is a comparatively much better -32 points in this average. We doubt the real-life difference between current Trump approval and 2024 Trump performance among Black voters is as stark as this finding makes it seem (and some pre-election polling overstated how well Trump would do among Black voters, which may be a factor here, too). All that said, this is a major difference between the exit poll and the aggregated approval polls.
Trump’s net approval is better than his exit poll performance with both 18-29 year-olds and those who live in urban areas. One can see the same thing when looking at political ideology and party identification. Trump’s approval margins with conservatives, Republicans, and those who live in rural areas are not quite as robust as they were in the 2024 exit poll, but he more than makes up for that by having a net approval with liberals and Democrats that, while still low, is close to 20 points better than his exit poll performance with these groups. Keep in mind, too, that there is naturally a lot of overlap among these demographics: Many liberals will also be Democrats, many Black voters will also be Democrats, many conservatives will also be Republicans, etc. We are not talking about mutually exclusive groups here.
The overall point, though, is just that some Democratic-leaning constituencies may be giving Trump a level of approval that may be hard for him to sustain, even taking into account Trump’s better performance with certain Democratic-leaning groups, like young voters and Black voters, in 2024. This merits watching. If Trump is able to keep his approval in positive territory, it may indicate he is holding or even building on some of the newfound support he found in 2024. However, if and when Trump’s approval goes into net-negative territory, it may simply be because some of this benefit of the doubt from these groups evaporates. Trump certainly would not be the first president to see an approval honeymoon period eventually fade away.
One other thing: We have noted in the past that Trump’s favorability is often lower than his approval. That remains the case: Trump’s net favorability is 47.9% favorable/48.7% unfavorable (-0.8 points) in RCP and 46.5%/48.2% (-1.7 points) in 538. Not all approval polls ask about favorability, but this is also not a new finding, so we’re confident that this dynamic is not just a quirk of recent polling. In the exit poll, 8% of voters said they had an unfavorable view of both Trump and Harris, and Trump won that group 52%-32%. It stands to reason that a small but important group of Americans continue to have an unfavorable view of Trump but also both voted for him in November and approve of his job performance, at least for now.
Kyle Kondik is a Political Analyst at the Center for Politics at the University of Virginia and the Managing Editor of Sabato's Crystal Ball.
See Other Political Commentary by Kyle Kondik.
See Other Political Commentary.
Views expressed in this column are those of the author, not those of Rasmussen Reports. Comments about this content should be directed to the author or syndicate.
Related Articles

Rasmussen Reports is a media company specializing in the collection, publication and distribution of public opinion information.
We conduct public opinion polls on a variety of topics to inform our audience on events in the news and other topics of interest. To ensure editorial control and independence, we pay for the polls ourselves and generate revenue through the sale of subscriptions, sponsorships, and advertising. Nightly polling on politics, business and lifestyle topics provides the content to update the Rasmussen Reports web site many times each day. If it's in the news, it's in our polls. Additionally, the data drives a daily update newsletter and various media outlets across the country.
Some information, including the Rasmussen Reports daily Presidential Tracking Poll and commentaries are available for free to the general public. Subscriptions are available for $4.95 a month or 34.95 a year that provide subscribers with exclusive access to more than 20 stories per week on upcoming elections, consumer confidence, and issues that affect us all. For those who are really into the numbers, Platinum Members can review demographic crosstabs and a full history of our data.
To learn more about our methodology, click here.