Three Things That Usually Happen in Midterms
A Commentary By Kyle Kondik
KEY POINTS FROM THIS ARTICLE
— There are at least three fairly consistent things that we see in midterms compared to presidential elections.
— The turnout of eligible voters in midterms is consistently lower than the turnout in the most recent presidential election.
— Midterm electorates are typically older, whiter, and more educated than presidential electorates.
— The non-presidential party usually wins a higher share of the two-party House vote in the midterm than that party did in the preceding presidential election.
Midterms: Smaller, whiter electorates; larger non-presidential party vote share
The 2026 midterm is still more than a year and a half away. Yet there are a few things we can already predict about it with at least a reasonable amount of confidence:
The share of eligible voters who participate in the midterm will be smaller than the turnout in the 2024 presidential election.
The electorate should be whiter, older, and have a higher share of four-year college graduates than the 2024 electorate.
And the Democrats, as the non-presidential party, should do better in the overall House popular vote than they did in 2024.
Let’s go through these three categories one by one.
1. The electorate will be smaller
Midterm electorates are not as big as presidential electorates, and there is no modern precedent for a midterm electorate having a higher turnout rate among eligible voters than the turnout rate in the most-recently held presidential election.
According to data from turnout expert Michael McDonald of the University of Florida, the average turnout rate for eligible voters in the 43 presidential elections held since 1856 is about 64%, while the average turnout in the 42 midterms held since that year is 49%. So the turnout is on average about 15 percentage points higher in the presidential than in the midterms, and the midterm turnout was never higher than the immediately previous presidential election. We went back to 1856 because that is the start of our modern two-party system, with the Republicans first fielding a presidential candidate that year to join the Democrats, a party that had existed in various forms prior to that year.
Of course, those who would have been an “eligible voter” was much different back then than it is now, with the franchise later expanding to previously disenfranchised groups like women, Black voters, and, in advance of the 1972 election, 18-20 year olds. Figure 1 shows the presidential and midterm turnout rates for this more modern time period.
Figure 1: Turnout of eligible voters, 1972-2024
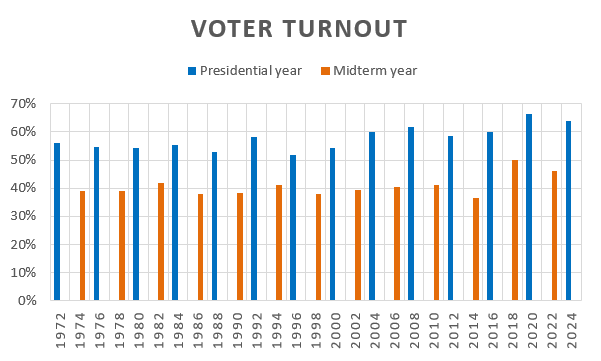
Source: Michael McDonald/UF Election Lab; figure by J. Miles Coleman.
Average turnout for presidential elections from 1972-2024 was 58%, and average midterm turnout in that timeframe was 41%, or a 17-point gap that’s very similar to, but slightly larger than, the presidential to midterm gap in the longer time period since 1856.
Note that turnout in both the last two presidentials and last two midterms have been high by recent standards—but even comparing the 2016 presidential election to the historically-high turnout 2018 midterm still showed a 10 percentage point smaller turnout in the midterm.
The bottom line is that the electorate in 2026 will be substantially smaller than 2024, it’s just a question of how much smaller.
2. The electorate should be whiter, older, and more educated
Because midterm electorates are smaller than presidential electorates, it stands to reason that demographic groups that have historically had better turnout rates would make up a greater share of midterm electorates than presidential electorates. We see this with white voters in general, voters with a four-year college degree, and voters aged 65 and over.
Table 1 shows the makeup of the eight electorates by certain age, racial, and education groups from 2008-2022 (four midterms and four presidentials) from the Democratic data firm Catalist. Catalist’s reports on the makeup of the electorate are widely-cited and include analysis of state voter files that are not available to exit polls released on Election Night (2024 is not included here because that Catalist report is not yet out—neither is a similar analysis that we look forward to seeing later this year, Pew’s validated voter study).
Table 1: Makeup of electorate, midterms vs. presidentials, 2008-2022
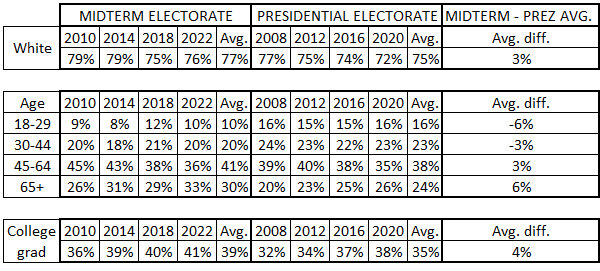
Source: Catalist
While non-college voters have always made up a clear majority of the electorate, the midterm electorates have been a few points more college-educated than the presidential electorates. Pre-Trump, college and non-college voters (this includes people of all races), voted fairly similarly in both the 2012 presidential election and 2014 midterm election (the non-college group was slightly more Republican in each election). But starting in 2016, the education gap expanded greatly, so that by 2020, Joe Biden won college graduates 59%-41% in the two-party vote but lost non-college graduates 52%-48%, a 22-point gap in margin. The gap was similar in the 2022 congressional vote. Again, Catalist has not released its report for 2024 yet, but the Edison Research national exit poll for several media entities found a gap of a little more than 25 points between college graduates and non-graduates in 2024.
The 65 and over cohort has been growing over time, but their share of the midterm electorate was always at least 4 percentage points bigger than the previous presidential election during the 2008-2020 timeline. Likewise, the 18-29 group has always made up at least 3 percentage points less of the midterm electorate than the previous presidential—it likely is no coincidence that the drop off was smallest from 2016 to 2018, the only midterm in this timeframe conducted under a Republican president that also represented the best Democratic performance among these four midterms. Even though Donald Trump made some gains among the 18-29 group in 2024 compared to his previous performance with them, this is still a Democratic-leaning cohort, just like voters 65 and over remain Republican-leaning to some extent.
Finally, the electorate is usually a little bit whiter in the midterm compared to the presidential. Again, Trump made gains with nonwhite voters in 2024, but as a bloc, nonwhite voters are still markedly more Democratic leaning than white voters.
In this era of politics, the midterm having a higher share of college graduates than the presidential would seem to help Democrats, and the midterm having a smaller share of younger and nonwhite voters would seem to help Republicans. But an electorate’s demographic makeup does not necessarily tell us what the results will be: The 2018 midterm’s electorate was whiter and older than either the 2016 or 2020 electorates, but that was also the Democrats’ best election of the trio. Likewise, the college-educated share in 2022 was very similar to 2018 and perhaps even slightly larger, but that didn’t stop Republicans from winning the House majority that year.
3. The non-presidential party’s share of the House popular vote should go up
Last week, in a piece on how House incumbents from the non-presidential party rarely lose in midterms, we noted that the presidential out-party almost always nets seats in the midterm. Democrats are hoping this trend continues, as they need to net just 3 seats to win the House next year.
In addition to typically netting seats, the non-presidential party also almost always sees its share of the total congressional vote go up in the midterm compared to what happened in the presidential.
Figure 2 and Table 2 show this dynamic, again going back to 1972. This shows the two-party House vote, and it corrects for unopposed seats in a given year by estimating the two-party vote in those seats. The data from 1972-2020 is from a past Crystal Ball contributor, the late Theodore S. Arrington of UNC-Charlotte, and the 2022 and 2024 data is from Split Ticket (they each use different methods to account for unopposed districts, but Arrington’s calculations and Split Ticket’s calculations for 2008-2020 are similar).
Figure 2: Two-party national House vote, 1972-2024
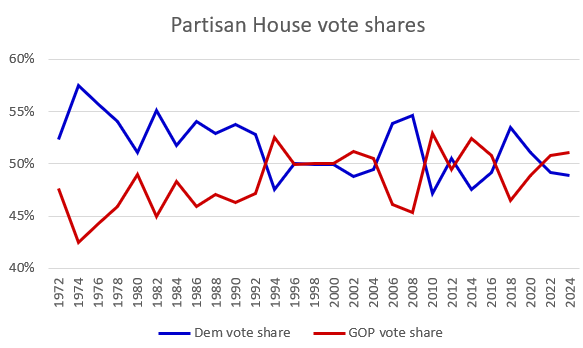
Table 2: Presidential party share of adjusted two-party House vote, 1974-2022
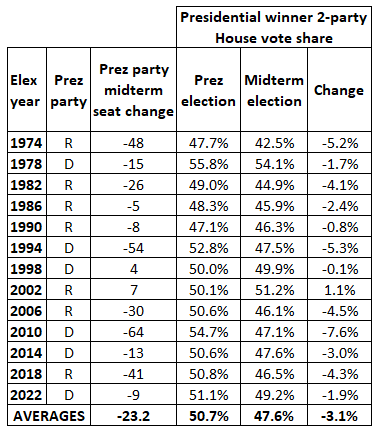
Sources: Theodore Arrington for adjusted two-party House vote totals for 1972-2020. Split Ticket for 2022 and 2024. The Long Red Thread for net House seat change in midterm elections. Figure by J. Miles Coleman.
Figure 2 shows the Democratic and Republican two-party House shares over time, while Table 2 shows what happened to the presidential party’s House vote in the midterm compared to how that party did in the presidential year’s House vote. Note that the presidential party share of the House vote declined in every election except for the 2000-2002 House vote, when Republicans increased their share of the vote and netted seats. The Democrats in 1996 and 1998 also got nearly identical shares of the House vote in those elections, in which Democrats netted seats in 1998 (but not enough to win the House majority).
On average since 1972, the non-presidential party has improved its share of the House vote by about 3 points in the midterm compared to how they did in the presidential year. That’s about 6 points in terms of margin (remember that every 1-point increase in two-party vote share means a 2-point change in margin, as in going from 50%-50% to 51%-49% is a 1-point gain in share but a 2-point gain in margin).
Republicans won the overall adjusted House vote by roughly 2 points in both 2022 and 2024, which translated into small majorities (222 seats in 2022 and 220 seats in 2024). As we get closer to the midterm, the House generic ballot polling will be worth monitoring. The winner of the House popular vote does not necessarily have to also win the majority—for instance, Democrats won the adjusted House popular vote in 2012 but did not come particularly close to winning the House majority—although the House popular vote winner probably will also win the majority.
It’s also worth remembering that House generic ballot polling sometimes overstates Democrats, so Democrats probably will want to be leading by more just a point or two to feel good about winning the House next fall. There’s been very little House generic ballot polling so far this cycle: Emerson College did recently show the Democrats leading by a small 3-point margin.
Overall, it would be a surprise if Democrats didn’t at least do better in the national House vote in 2026 than they did in 2024.
Kyle Kondik is a Political Analyst at the Center for Politics at the University of Virginia and the Managing Editor of Sabato's Crystal Ball.
See Other Political Commentary by Kyle Kondik.
See Other Political Commentary.
Views expressed in this column are those of the author, not those of Rasmussen Reports. Comments about this content should be directed to the author or syndicate.
Related Articles

Rasmussen Reports is a media company specializing in the collection, publication and distribution of public opinion information.
We conduct public opinion polls on a variety of topics to inform our audience on events in the news and other topics of interest. To ensure editorial control and independence, we pay for the polls ourselves and generate revenue through the sale of subscriptions, sponsorships, and advertising. Nightly polling on politics, business and lifestyle topics provides the content to update the Rasmussen Reports web site many times each day. If it's in the news, it's in our polls. Additionally, the data drives a daily update newsletter and various media outlets across the country.
Some information, including the Rasmussen Reports daily Presidential Tracking Poll and commentaries are available for free to the general public. Subscriptions are available for $4.95 a month or 34.95 a year that provide subscribers with exclusive access to more than 20 stories per week on upcoming elections, consumer confidence, and issues that affect us all. For those who are really into the numbers, Platinum Members can review demographic crosstabs and a full history of our data.
To learn more about our methodology, click here.