The Electoral College in the 21st Century
A Commentary By Kyle Kondik
A brief history of a competitive era.
KEY POINTS FROM THIS ARTICLE
— The United States is in an extremely competitive era of presidential elections.
— In the 6 elections this century, the popular vote margin has been less than 5 points in all but 1 of them.
— Many of the states have been consistent in their presidential voting since 2000, although there have been key shifts that have altered the roster of most competitive swing states.
— Relative to the nation, much of the West has become more Democratic over the past 2 decades, along with some other pockets of the country, while many states in the Northeast, Midwest, and Greater South have become more Republican.
— The most competitive states in 2020 may be the most competitive in 2024: Michigan, Pennsylvania, and Wisconsin in the Great Lakes region and Arizona, Georgia, Nevada, and North Carolina in the Sun Belt.
A brief recent history of the Electoral College
At some point, either the Democrats or Republicans are going to win a true blowout in the Electoral College (and popular vote). But in an era defined by competitive elections, good luck guessing when that next will occur.
The United States has now had 9 presidential elections in a row (beginning in 1988) where neither side has won by a double-digit margin in the popular vote. That is the longest streak in the history of the current 2-party system (Democrats vs. Republicans, which dates back to just before the Civil War). While some elections in that timeframe — 1988, 1996, and 2008 — were still decisive victories for one side or the other, there have been some true nail-biters, with 2000 as the closest in terms of the Electoral College vote and the winning margin in the decisive state (just 537 votes out of nearly 6 million cast in Florida). Republicans won a pair of presidential elections (2000 and 2016) despite not winning the popular vote — 2 other such “misfires” happened in the late 1800s (1876 and 1888), the last time period where there have been many relatively close presidential elections in a row. Since 2000, the popular vote margin has been less than 5 points in 5 of the 6 elections, with only 2008 as an exception. This does not quite match the 6 elections between 1876-1896, when every election had a margin of under 5 points, but it’s close.
These 2 eras really stand out for competitiveness, because they account for so many of the close presidential elections since 1856. There have been 42 presidential elections since then, and 16 of them have been decided by less than 5 points in the popular vote. Of those, 11 of them came in either the 1876-1896 or 2000-2020 time period (the 5 others: 1916, 1948, 1960, 1968, and 1976).
The current alignment of the Electoral College has arguably been in effect since 2000, in that there were several changes going from the 1996 to 2000 elections that have endured even as the respective party coalitions have evolved in subsequent elections. Let’s take a quick visual tour through the Electoral College from 1996 to 2020 to see how things have changed. (Our source for all results is Dave Leip’s Atlas of U.S. Presidential Elections.)
Map 1: 1996 Electoral College results
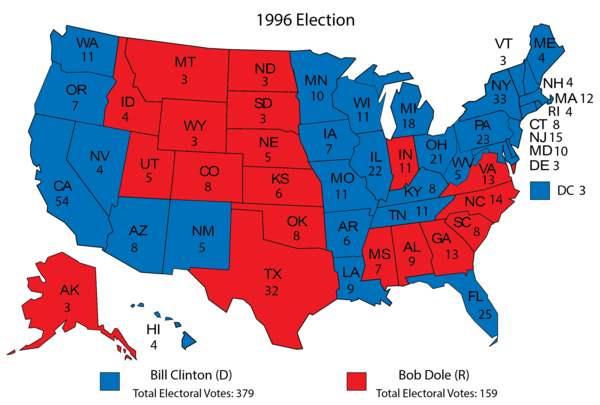
Bill Clinton’s second victory produced both a popular vote (8.5 points) and Electoral College (220) margin bigger than any we have seen in either category since. Clinton won a half-dozen states that have not voted Democratic in any of the presidential elections since, all in what one could consider as either Southern or as Border states: Arkansas, Kentucky, Louisiana, Missouri, Tennessee, and West Virginia. Despite his loss, Republican Bob Dole carried Colorado and Virginia, 2 states that have now become solid parts of the Democratic federal coalition.
In the 1990s, some of the trends we have become accustomed to were taking hold. In 1992, Clinton only got a majority of the vote in his native Arkansas (excluding the District of Columbia) — by 1996, he got a higher share in 6 other states. Several of those other states were in the Northeast, which, along with the West Coast, has been solidly blue in the 21st century. Much of the Great Plains and northern Interior West states were and are red. Indiana was Dole’s only victory in the states that touch the Great Lakes; the Hoosier State remains the most Republican of those states today.
Map 2: 2000 Electoral College results

George W. Bush swept the South in 2000 and won a narrow Electoral College victory. Gore’s showing in Florida, despite his agonizingly narrow loss there, was stronger than any Democrat since: Florida voted very close to the national popular vote in 2000 but has since voted at least a couple of points to the right of the national vote. Despite Bush’s win, the Democrats retained much of the Great Lakes turf as well as the whole West Coast and nearly all of the Northeast. New Hampshire voted for Bush, the last time a Republican would win a state northeast of New Jersey. After a brief dalliance with Democrats in 1996, Arizona reverted back to being Republican — at the time, 1996 was the only time the Grand Canyon State had voted Democratic for president since 1948.
Map 3: 2004 Electoral College results
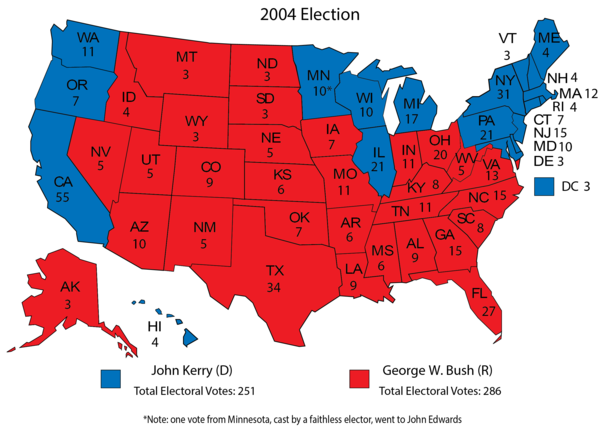
Bush’s second victory was substantially similar to his first victory, although there were a few changes. Bush, a Texan, flipped New Mexico, while Democratic nominee John Kerry, from Massachusetts, also flipped a neighboring state, New Hampshire. Iowa, one of the closest states of 2000, became the third state to change hands in 2004, narrowly flipping to Bush. This was the last time the now-lapsed bellwether state of Ohio was truly decisive in the election. Kerry actually did very slightly better there than he did in the national popular vote, one of the relatively few times Democrats have run better in Ohio than they did nationally. Had Kerry won Ohio, he would have won the election even if nothing else had changed. But Bush won Ohio by 2.1 points as part of a 2.5-point national popular vote victory — the most recent time a Republican won the popular vote.
Map 4: 2008 Electoral College results
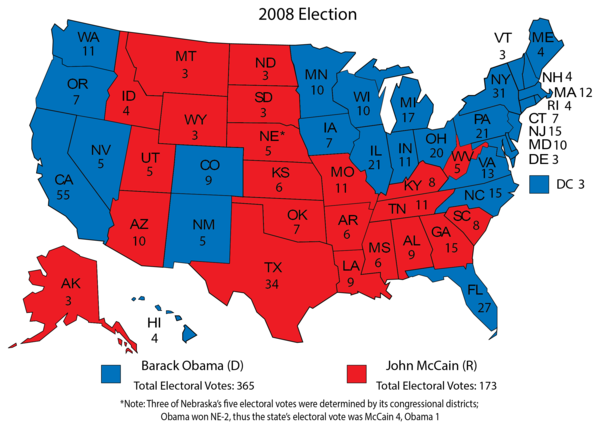
Barack Obama won a victory similar in size to Clinton’s 1996 win — the then-Illinois senator won the popular vote by 7.3 points and the Electoral College by 192. He failed to win back any of those half-dozen southern-ish states mentioned in the 1996 section as having voted for Clinton — in fact, he performed worse in several of them than Kerry had 4 years earlier. Obama barely lost Missouri, which formally shed its old bellwether status in this election and has sped to the right since. But Obama won a handful of states that didn’t vote for Clinton in 1996: Colorado and Virginia, which have since solidified as Democratic-leaning states, and Indiana and North Carolina, which Democrats have failed to carry since.
Map 5: 2012 Electoral College results
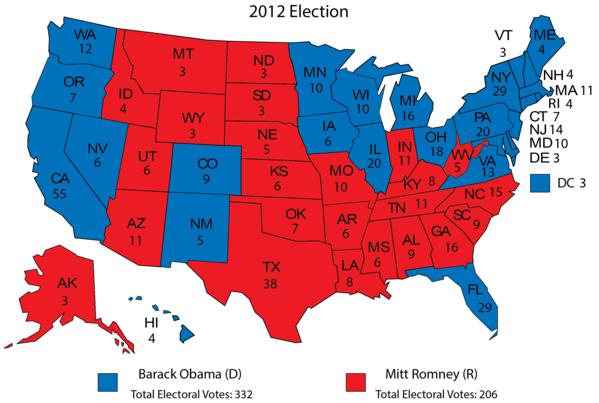
Obama fell off some in 2012, winning by just 4 points in the popular vote and shedding Indiana, North Carolina, and the single Electoral College vote he had won in Nebraska’s 2nd District (there is more on the 2 states that award some of their votes by congressional district, Maine and Nebraska, below). Otherwise, the results were identical to 2008.
Map 6: 2016 Electoral College results
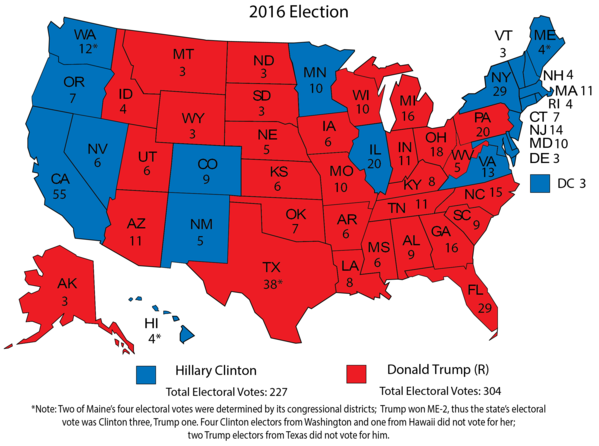
In his victory, Donald Trump became the only Republican in the 21st century to carry 3 key Great Lakes states: Michigan, Pennsylvania, and Wisconsin. He also pushed a couple of heartland states, Iowa and Ohio, from swing state to leaning Republican status. That said, a handful of non-Midwestern states that had voted once or twice for Bush but also twice for Obama remained blue: Colorado, Nevada, New Hampshire, New Mexico, and Virginia.
Map 7: 2020 Electoral College results
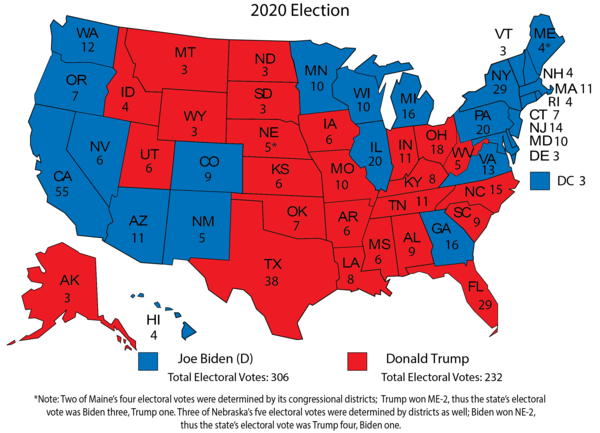
Joe Biden defeated Trump by winning back the Great Lakes battlegrounds of Michigan, Pennsylvania, and Wisconsin. He also flipped a couple of typically Republican Sun Belt states, Arizona and Georgia, that had not voted for Obama in either election and had each only voted for Clinton once apiece.
As we look ahead to 2024, remember that we have gone through another reapportionment cycle following the 2020 census. So the electoral vote allotments have changed slightly. California, Illinois, Michigan, New York, Pennsylvania, Ohio, and West Virginia all lost a single electoral vote; Texas gained 2, and Colorado, Florida, Montana, North Carolina, and Oregon added a single vote apiece. Had this allocation been in place in 2020, the Electoral College would have been 303-235, for a slightly smaller Biden edge. That new allocation is shown in Map 8; Maps 9 and 10 also include the new Electoral College vote tallies.
Map 8: 2020 Electoral College results under new apportionment
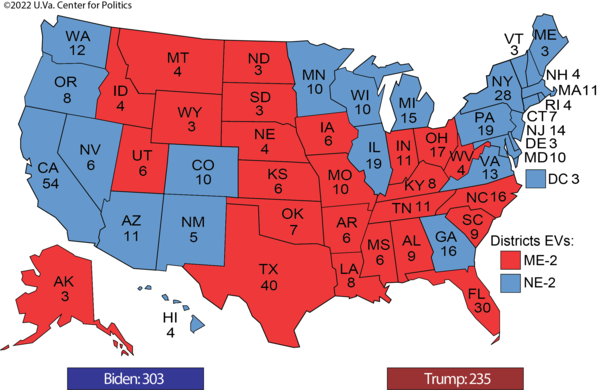
How the states have changed
In aggregate, here’s how all of the states have voted in the 6 elections since 2020, a period in which both parties have won the presidency 3 times (Republicans in 2000, 2004, and 2016, and Democrats in 2008, 2012, and 2020).
Map 9: Electoral College voting record since 2000
Interestingly, and despite the 3-3 split over the past 6 elections, only a single state has split 3-3 in that same time period: Iowa. But the state’s rightward turn suggests that it likely will not be a true battleground in 2024. The same is true of the only 4/6 Republican states on this map: Florida and Ohio, both of which have also taken a turn right in the Trump era. At the same time, many of the 5/6 states (both Democratic and Republican) appear likely to be the top battlegrounds in 2024. Seven states were decided by less than 3 points in 2020: Michigan, Pennsylvania, and Wisconsin, all of which have voted Democratic in all but 1 of the presidential elections since 2000; Nevada, which has voted Democratic in 4 of those 6 elections; and Arizona, Georgia, and North Carolina, all of which have voted Republican in 5 of these 6 elections. Indiana is decidedly the least competitive of either party’s 5/6 states — aside from 2008, when Obama’s Midwestern appeal and a huge campaign resource advantage likely helped him carry it, it has not been a top target. Similarly, while New Mexico was hotly contested in the early 2000s, recent Democrats have won there relatively comfortably.
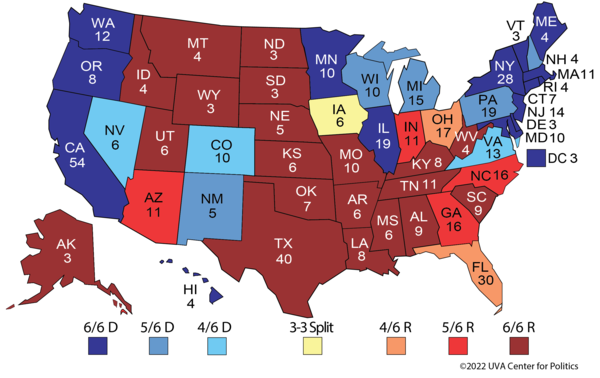
One other way of looking at this is to see how the states have trended over the past 6 elections relative to the nation. Map 10 compares the change in what we call the “presidential deviation” from the 2000 election to the 2020 election. There is a longer explanation in this past Crystal Ball story if you want a fuller description, but here’s how it works in a nutshell:
What we did was take the 2-party Democratic vote in a given state and compared it to the national 2-party Democratic vote in both 2000 and 2020. To illustrate how this works, let’s use Virginia as an example. In 2000, Gore won 50.3% of the national 2-party vote, while he received 45.9% of the 2-party vote in Virginia. We subtract 45.9% from 50.3% to get -4.4%, and we round to -4 to simplify things. So Virginia was R +4 in 2000: Bush’s share of the 2-party vote was about 4 points better in Virginia than it was nationally (and Gore’s was about 4 points worse).
In 2020, Biden won 52.3% of the national 2-party vote, and he got 55.2% of the vote in Virginia. 55.2%-52.3% is 2.9, which rounds to 3, or D +3, meaning that Biden did 3 points better in Virginia than he did nationally.
So from 2000 to 2020, Virginia went from R +4 to D +3 — a net Democratic shift of 7 points relative to the nation. That puts it among the most blue-trending states from 2000 to 2020. The shifts in all 50 states are shown in Map 10.
Map 10: Shift in presidential deviation, 2000 compared to 2020
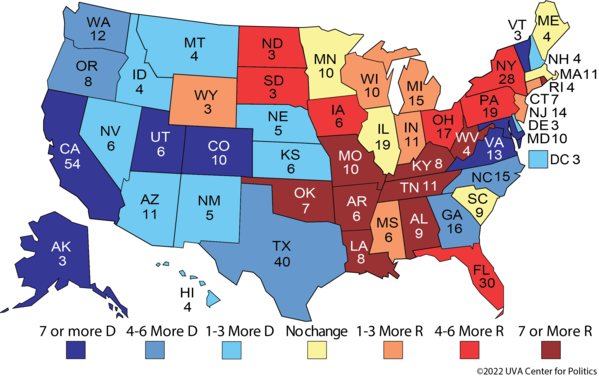
Notice that the western half of the country has largely moved left relative to the nation over the course of the last 2 decades, while much of the Northeast, Midwest, and Border state areas have shifted right. That doesn’t mean, obviously, that New York is gettable for Republicans or Utah is gettable for Democrats, for instance, despite the relative trends in each state. But it does help show the direction of some of the key states, like Arizona and Georgia, shifting from clearly Republican to swing states, as well as Republicans becoming relatively stronger in the key states of the Midwest.
Maine’s lean has been unchanged in Map 10, but its internal movements have had Electoral College implications — along with Nebraska, it splits its electoral votes, awarding some by congressional district. For the first 4 elections in this timeframe, both Maine districts voted Democratic for president. But its rural 2nd District has voted Republican since 2016, giving the GOP an extra electoral vote. In Nebraska, Democrats have benefitted from the split allocation in a couple of recent elections, as the Omaha-based NE-2 voted for Obama in 2008 and Biden in 2020.
The trend in each state over the past 2 decades shown in Map 10 adds a little bit of context to the overall voting records displayed in Map 9. Of the closest states in 2020, Michigan, Pennsylvania, and Wisconsin of the Great Lakes region have all gotten redder relative to the nation over the past 20 years despite voting Democratic in 5 of the past 6 elections. Meanwhile, the most electorally competitive states in the South and West — Arizona, Georgia, Nevada, and North Carolina — have all gotten bluer, even as Nevada is the only state among them to vote more often for Democratic presidential candidates in the past 2 decades.
How these states vote — and trend — in 2024 will help determine both the next election and the ones that follow.
Kyle Kondik is a Political Analyst at the Center for Politics at the University of Virginia and the Managing Editor of Sabato's Crystal Ball.
See Other Political Commentary by Kyle Kondik.
See Other Political Commentary.
Views expressed in this column are those of the author, not those of Rasmussen Reports. Comments about this content should be directed to the author or syndicate.
Related Articles

Rasmussen Reports is a media company specializing in the collection, publication and distribution of public opinion information.
We conduct public opinion polls on a variety of topics to inform our audience on events in the news and other topics of interest. To ensure editorial control and independence, we pay for the polls ourselves and generate revenue through the sale of subscriptions, sponsorships, and advertising. Nightly polling on politics, business and lifestyle topics provides the content to update the Rasmussen Reports web site many times each day. If it's in the news, it's in our polls. Additionally, the data drives a daily update newsletter and various media outlets across the country.
Some information, including the Rasmussen Reports daily Presidential Tracking Poll and commentaries are available for free to the general public. Subscriptions are available for $4.95 a month or 34.95 a year that provide subscribers with exclusive access to more than 20 stories per week on upcoming elections, consumer confidence, and issues that affect us all. For those who are really into the numbers, Platinum Members can review demographic crosstabs and a full history of our data.
To learn more about our methodology, click here.