The Democrats’ House Polling Lead: Remarkably Steady
A Commentary By Kyle Kondik
Generic ballot, money edge point to retained blue majority; seven rating changes.
KEY POINTS FROM THIS ARTICLE
— The Democratic lead in House generic ballot polling has been very consistent over the course of Donald Trump’s presidency.
— Democrats also have a significant money edge in the lion’s share of their most vulnerable districts. Money is not everything, but it can help.
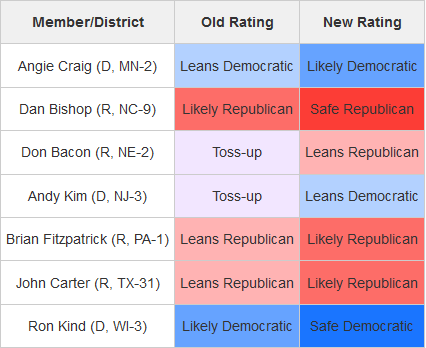
— We have seven House rating changes, four in favor of Republicans and three in favor of Democrats.
— Put it all together, and Democrats remain favored to hold their House majority.
Table 1: House rating changes
The very stable generic ballot
President Trump’s approval rating is not the only big-picture national indicator that has not changed much over the course of his presidency.
The national House generic ballot has also been very consistent for the three-plus years he’s been in the White House.
Democrats have led almost every single one of the nearly 400 House generic ballot national polls released since Trump took office, as compiled in the 2018 and 2020 RealClearPolitics averages.
The lion’s share of these polls, about 310, were released during the 2018 cycle, while close to 90 have come out in this cycle. Because the House is less of a focus in this year’s presidential election cycle, it’s natural that the generic ballot question is being asked less.
The wording from different pollsters varies, but the generic ballot question usually asks whether a respondent plans to vote for a Democrat or a Republican in their local House of Representatives election.
Out of 309 polls included in the 2018 database, 305 showed Democratic leads; three were tied and another showed a Republican lead of one point. Out of 88 polls this cycle, 87 have shown a Democratic lead, and one has shown a tie. The current RealClearPolitics average shows a Democratic lead of 7.4 points, almost exactly the same as its final average in 2018.
According to FiveThirtyEight’s averages in both 2018 and 2020, the Democratic lead has been in the mid-to-high single digits for almost all of the last three years (the site’s 2018 average dates back to April 2017). You can see the immense stability at the links. FiveThirtyEight models the results somewhat, which can smooth out changes; RealClearPolitics just uses a straight average and is thus more sensitive to change. The RealClearPolitics average generally showed Democratic leads similar to FiveThirtyEight in the 2018 cycle, albeit with more volatility; it hasn’t computed a running average over time this cycle.
One bit of caution about the numbers is that the vast majority of the generic ballot polls taken this cycle have been by just two pollsters: Economist/YouGov and Politico/Morning Consult, both of which conduct their polls online as opposed to making live calls to telephones (old-school polling professionals sometimes prefer the latter method, although we don’t see much reason to quibble with these two pollsters’ findings).
Of the 26 generic ballot surveys with field dates in 2020 included in the RealClearPolitics database, 22 of them were conducted by one of these two pollsters.
That said, pollsters other than those two so far this year found basically the same results as Politico/Morning Consult and Economist/YouGov have found recently.
The most recent surveys from those two pollsters showed Democratic leads of five and eight points, respectively; the four surveys released by the others so far this year have shown Democratic leads of six, eight, nine, and nine points.
FiveThirtyEight includes some additional polls that RealClearPolitics does not, but those surveys tell much the same story as the others.
What does this mean?
It’s reasonable to continue to believe that Democrats have a lead on the House generic ballot at this time, and that this lead is more than just a few points. This suggests a political environment that leans at least a bit toward the Democrats. That Joe Biden also leads Donald Trump nationally by about half a dozen points on average — in a greater number of polls conducted by a more diverse collection of pollsters — is also an indicator of this kind of political environment.
In an era where presidential and down-ballot voting is more in alignment than it was a few decades ago, one might expect the generic ballot and the presidential polling to look relatively similar.
It is worth noting that many of the districts that will decide the House majority vote to the right of the nation as a whole. The median House district based on 2016 presidential performance is FL-25, held by Rep. Mario Diaz-Balart (R). Donald Trump won FL-25 by about two points while losing the national popular vote by two points, so the median district is about four points to the right of the nation.
In other words, the House map is similar to the Electoral College in the sense that it favors Republicans to some degree: Wisconsin, which effectively provided Trump with his decisive electoral votes in 2016, voted about three points to the right of the nation.
So just as most analysts will not see a Biden lead of just a few points in national polling as sufficiently large enough to translate into an actual victory this fall, so too might a Democratic House generic ballot advantage of just a few points not be big enough to translate into a retained majority.
But this is not really an exact science: There are plenty of candidates in both parties who will run both ahead of and behind what one might expect in a district based on just the district characteristics and the generic ballot.
It may be better to view the generic ballot as more of just a generalized signal of voter intent: Does the public, writ large, want to see a change in party control of the House or not?
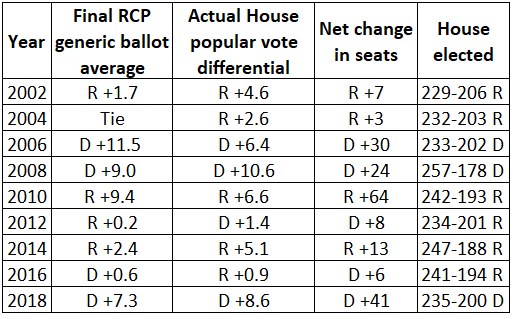
When the House has changed hands the last three times (2006, 2010, and 2018), the generic ballot polling showed a pronounced edge for the party that would go on to flip the House. This was a signal: The incumbent majority party was in trouble.
Table 2 shows the final pre-election RealClearPolitics generic ballot polling average and the House results since 2002. Note that big leads for one side or the other correspond with larger seat changes, whereas years that were closer to even suggested little seat change.
Table 2: Final RealClearPolitics generic ballot average versus House results, 2002-2018
Notes: Net change calculated by comparing the results of a regular, general election with what happened in the preceding general election. Independents are counted as being a member of the party with whom they caucused.
Source: RealClearPolitics; Vital Statistics on Congress; research by author.
As the table shows, the generic ballot does a decent job of suggesting the direction of House elections. Generic ballot polling used to have more of a Democratic skew: Charles Franklin, who directs the respected Marquette Law School poll in Wisconsin, noted back in 2006 that the generic ballot showed Democrats leading even in 1994, when the Republicans netted 54 seats and won the House majority for the first time in four decades. This Democratic skew is evident in the 2002-2006 RealClearPolitics averages. The generic polling seems like a better indicator now, though, and it hasn’t had an obvious skew at the end of the past several cycles: It underestimated Republicans in 2014 and 2016, and Democrats in 2012 and 2018.
It seems fair to say that the current Democratic edge in the House generic ballot — about 7.5 points in both the RealClearPolitics and FiveThirtyEight averages — does not suggest the public at large is agitating strongly for a party change in the House.
If it turns out that the Republicans are really putting the House majority in play, we probably will see the generic ballot tighten. So keep an eye on it as we move further along in the cycle.
Beyond the generic ballot, House Democrats in the most vulnerable districts generally will have significantly more money to spend on their campaigns than their eventual Republican opponents. Politico’s Ally Mutnick and National Journal’s Kirk Bado both had excellent overviews of the most recent campaign finance reports that examine the Democratic money edge.
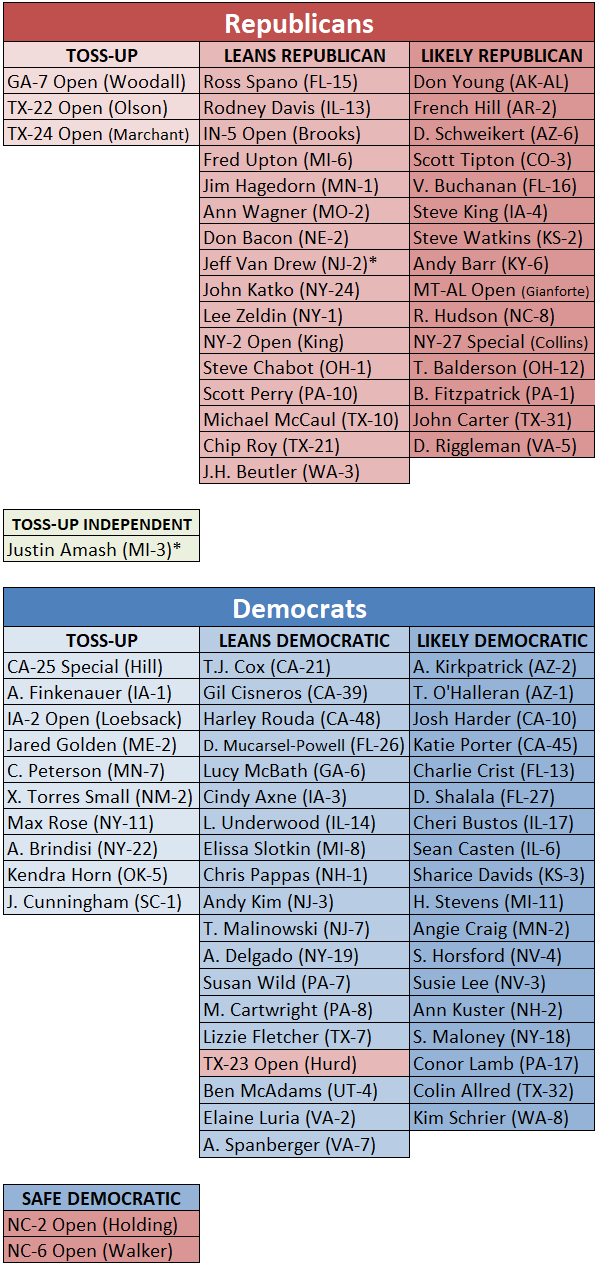
The eight House Democratic incumbents we see as the most vulnerable — those incumbent Democrats we have rated in the Toss-up category in our ratings (listed in Table 3 at the end of this article) — have on average about a four-to-one cash-on-hand advantage over their closest Republican rival (some of whom still have to win primaries). If in fact the public health crisis and consequent economic fallout depresses political fundraising going forward, it may be hard for challengers to significantly catch up.
Additionally, the House Democrats’ campaign arm holds a significant cash-on-hand edge over its Republican counterpart.
The fact that we still call these eight races Toss-ups is a testament to our belief that money is not everything — Trump won all these districts, and most by double digits — but even the flukiest Democratic winners from 2018, such as Reps. Kendra Horn (D, OK-5) and Joe Cunningham (D, SC-1), are very well-funded and will not necessarily be easy for Republicans to dislodge.
Rating changes
One extremely well-funded House Democratic freshman, Rep. Andy Kim (D, NJ-3), moves out of the Toss-up category this week.
Kim defeated well-heeled former Rep. Tom MacArthur (R, NJ-3) in a south/central New Jersey district that abuts NJ-2, home of party-switching Rep. Jeff Van Drew (R). Kim is sitting on a $2.7 million warchest as businessman David Richter and former local official Kate Gibbs battle for the GOP nomination. Richter initially was set to challenge Van Drew in NJ-2 but switched races following Van Drew’s party change; neither he nor Gibbs cracked even $100,000 raised from donors in 2020’s first quarter, although Richter has some ability to self-fund: He has loaned his campaign $600,000 so far and has suggested he’ll put in a total of $1 million. However, the New Jersey Globe noted last month that much of Richter’s wealth comes from shares of stock in his former company, which has been hit hard so far by the economic crisis; Richter said at the time that this would not impact his ability to put his own money into the race, but this is something to monitor. Trump won this district 51%-45% after Barack Obama carried it twice, so Kim likely will need to attract crossover support — the money edge will help him try to generate that support. His race now Leans Democratic.
Weak GOP recruiting and fundraising also pushes us to move first-term Rep. Angie Craig (D, MN-2) from Leans Democratic to Likely Democratic and veteran Rep. Ron Kind (D, WI-3) from Likely Democratic to Safe Democratic. Both hold marginal Trump-won seats, although MN-2 was so close that presumptive Democratic nominee Joe Biden could end up carrying it this fall, and Democrats have also performed well in Kind’s district in big races the past few years (and Kind himself appears to have a strong personal brand).
The Democrats are not immune to this problem in some of the districts they are trying to flip from Republicans. Rep. Brian Fitzpatrick (R, PA-1) occupies a very competitive, Hillary Clinton-won district in Bucks County, a battleground area in Greater Philadelphia. But he lacks a credible opponent and has an enormous fundraising edge, so he moves from Leans Republican to Likely Republican.
Rep. John Carter (R, TX-31) survived a close call in 2018 against veteran MJ Hegar (D), who may be the Democratic challenger to Sen. John Cornyn (R-TX) this cycle if she wins a primary runoff. Carter does not appear to face as spirited of opposition this time, and he also moves from Leans Republican to Likely Republican. Rep. Dan Bishop (R, NC-9), who won a closely-watched do-over special election last September, also doesn’t seem to face much of a challenge this time around. He moves from Likely Republican to Safe Republican.
We also are upgrading Rep. Don Bacon (R, NE-2) from Toss-up to Leans Republican. Bacon only narrowly survived a challenge in 2018 from Kara Eastman (D), a progressive who national Democrats essentially gave up on two years ago. Eastman may very well be the Democratic challenger again as she has significantly outpaced the fundraising of a couple of intraparty rivals, most notably Ann Ashford, the wife of former Rep. Brad Ashford (D, NE-2). Brad Ashford lost to Eastman in last cycle’s primary after losing to Bacon in a close 2016 race. This race could end up being very competitive as the presidential candidates battle for the district’s single electoral vote (Trump won it by two points in 2016). But Bacon probably deserves an edge for the time being.
Conclusion
After today’s rating changes, we have 227 House seats at least leaning to the Democrats, 194 at least leaning to the Republicans, and 14 Toss-ups (10 won by Democrats in 2018, four by Republicans). Splitting the Toss-ups down the middle would mean a 234-201 House — a net gain of one seat for Republicans from 2018.
Overall, the ratings reflect the Democrats’ generic ballot and money edge — we continue to have the Democrats well-positioned to retain their House majority, with the battles for the presidency and the Senate more up in the air.
Table 3: Crystal Ball House race ratings
Note: *Represents members who have changed parties. Rep. Jeff Van Drew (R, NJ-2) switched from Democratic to Republican, and Rep. Justin Amash (I, MI-3) switched from Republican to independent. Red districts listed in the Democratic column indicate the Democrats are favored to win those districts; blue districts listed in the Republican column indicate the Republicans are favored to win those districts.
Kyle Kondik is a Political Analyst at the Center for Politics at the University of Virginia and the Managing Editor of Sabato's Crystal Ball.
See Other Political Commentary by Kyle Kondik.
See Other Political Commentary.
This article is reprinted from Sabato's Crystal Ball.
Views expressed in this column are those of the author, not those of Rasmussen Reports. Comments about this content should be directed to the author or syndicate.
Rasmussen Reports is a media company specializing in the collection, publication and distribution of public opinion information.
We conduct public opinion polls on a variety of topics to inform our audience on events in the news and other topics of interest. To ensure editorial control and independence, we pay for the polls ourselves and generate revenue through the sale of subscriptions, sponsorships, and advertising. Nightly polling on politics, business and lifestyle topics provides the content to update the Rasmussen Reports web site many times each day. If it's in the news, it's in our polls. Additionally, the data drives a daily update newsletter and various media outlets across the country.
Some information, including the Rasmussen Reports daily Presidential Tracking Poll and commentaries are available for free to the general public. Subscriptions are available for $4.95 a month or 34.95 a year that provide subscribers with exclusive access to more than 20 stories per week on upcoming elections, consumer confidence, and issues that affect us all. For those who are really into the numbers, Platinum Members can review demographic crosstabs and a full history of our data.
To learn more about our methodology, click here.


