The California Recall: Looking Under the Hood as Vote Count Finalized
A Commentary By Kyle Kondik and J. Miles Coleman
Are there any lessons for elections to come?
KEY POINTS FROM THIS ARTICLE
— The vote count in California is finally done, and there were some noticeable trends in the results.
— While the recall election largely lined up with the 2018 gubernatorial result, some notable changes are evident when comparing last month’s vote to other recent statewide races.
— That the Democrats performed very well in that race even in the midst of Joe Biden’s still ongoing slide in popularity is an interesting data point, but it’s just a single one that may not be confirmed by looming statewide races in more competitive states, such as Virginia.
Contextualizing the finalized California vote
The political environment for Democrats has weakened in recent months, and President Joe Biden’s national approval rating has sunk to its lowest point in the FiveThirtyEight polling average, which showed him at just a 44% approve/50% disapprove split as of Wednesday.
There is some considerable variation in the polling, ranging from Biden at a net-neutral approval rating all the way to being at a double-digits-sized approval deficit. But the key point is that after Biden’s approval rating turned negative in late August following the collapse of the U.S.-backed regime in Afghanistan, his numbers really haven’t gotten better even as that story has faded from the headlines. Meanwhile, Democratic infighting over a social spending package continues, and most of the chatter around it is about how many trillions it will cost — hardly the sort of helpful political signal Washington Democrats should want to send out to the rest of the country.
Democrats also are getting jitters over the upcoming Virginia gubernatorial race, where polling between Terry McAuliffe (D) and Glenn Youngkin (R) is very close. Monmouth University showed the race a tie on Wednesday, while other surveys have shown a modest McAuliffe lead. We analyzed the Virginia race in-depth last week — that analysis still stands, although we very well may have more to say about it between now and Nov. 2.
And yet despite all the gloominess for Democrats, the most recent big statewide election — in California — went quite well for them. With the vote count there now essentially finalized — Gov. Gavin Newsom (D-CA) easily defeated an attempt to recall him — we wanted to take a closer look at what happened, and ponder whether the result has any broader meaning beyond the Golden State’s borders.
The California results
Even though the California election was more than a month ago, Sept. 14, we’ve waited until now to analyze it in-depth because the vote count is only now virtually final. The deadline for counties to submit their final vote totals to the state was last Friday, and the state is set to certify the results this Friday.
The final tallies reveal a race that was closer than what was reported on Election Night, but only marginally so. At that time, voters were breaking against the recall proposition by a 64%-36% spread. After all the votes have been counted, that margin dipped somewhat to 62%-38%. This 24-point spread was still a strong showing in favor of Newsom and was considerably better than what polling aggregates suggested.
Conveniently, for the sake of comparison, the recall topline matched the result of the 2018 gubernatorial race almost exactly. Specifically, in 2018, Newsom was first elected with 61.948%, while the “No” option in the recall race took 61.877% — rounded to the tenths place, both are 61.9%.
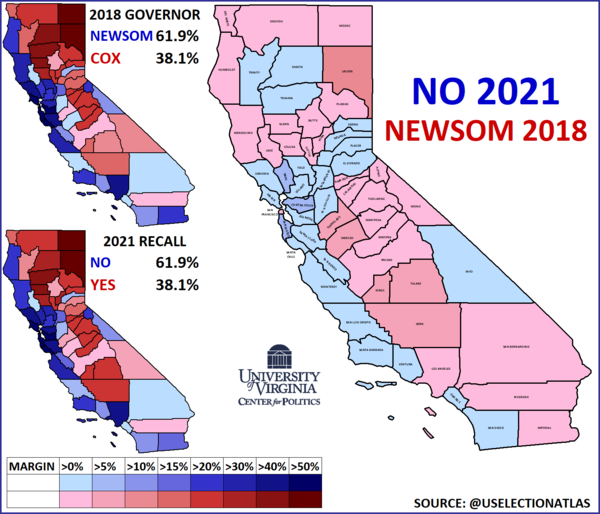
The left two images on Map 1 show the county-level results for the 2018 gubernatorial and the 2021 recall vote. There are few differences between those two maps, with only Merced County, in the Central Valley, flipping from backing Newsom in 2018 to supporting his removal. The right image on Map 1 compares Newsom’s share in 2018 (red) to No’s share in 2021 (blue).
Map 1: 2018 gubernatorial vs 2021 recall elections in California
Compared to 2018, Newsom saw some of his biggest improvements in the Bay Area: Contra Costa, San Mateo, and Napa counties all shifted in No’s direction by over 5 percentage points. A curious exception in the Bay Area is San Francisco, Newsom’s home county (before he ran statewide, he was its mayor). Though San Francisco shifted somewhat in favor of recalling Newsom, the change was very slight, and the governor’s support was still overwhelming: it gave him 86.4% in 2018, and No took 86.1% there.
The recall results suggest a continuation of the educational realignment that was prominent in the Trump era. The blue-shifting Bay Area counties have a high concentration of college graduates. Just across the Golden Gate Bridge from San Francisco, Marin County moved a few points in favor of No — almost 60% of those over 25 have a college degree there, the largest share in the state. Newsom also did a little better in diverse, highly-educated Orange County, a one-time Republican bastion that has become much more competitive in recent years. In fact, Orange County voted more “Democratic” in the 2021 recall election than either neighboring Riverside and San Bernardino counties did — with the potential exception of 1946 (when then-Republican Gov. Earl Warren was reelected with minor opposition), this has not happened before in a postwar gubernatorial contest.
Meanwhile, Lassen County, up in the north, was the only county that shifted greater than 10% against Newsom — it is also the county where college attainment is lowest, at just 13%. Lassen County is in a region known as the “State of Jefferson,” where anti-Sacramento sentiment runs high, and residents there were eager to sign the petitions that initiated the recall. Not coincidentally, Merced County, as the sole Newsom-to-Yes county, is the next least-college educated county.
One of the surprises in 2020 in California was that Biden carried Inyo County, on the border with Nevada. Though he only won it by 14 votes, it was the first time a Democrat carried the county since 1964, and it represented a 14-point improvement from Hillary Clinton’s loss there in 2016. Though Inyo still supported the recall, Newsom’s standing there improved.
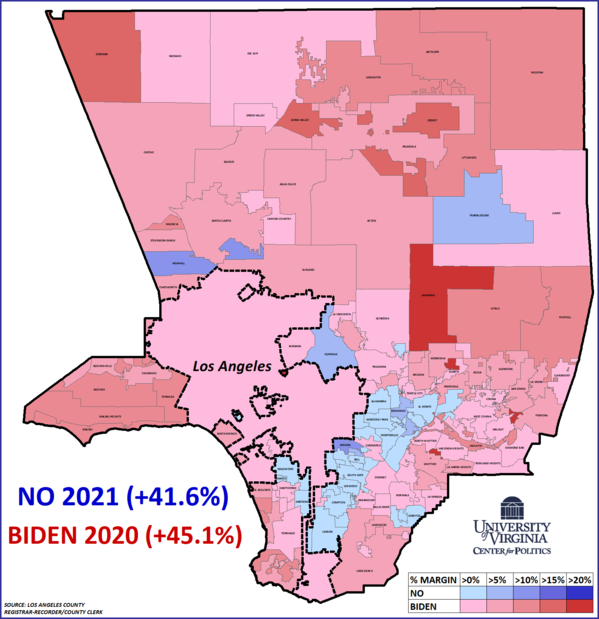
In using Biden’s performance as a baseline, some interesting trends emerge in Los Angeles County, the mega-county that typically casts close to a quarter of the statewide vote. In last year’s 2-party vote, Biden carried LA County by just over 45 percentage points. Last month, the recall failed there by almost 42 points. Map 2 compares Biden’s margin (red) to No’s margin (blue) last month.
Map 2: Biden 2020 vs No 2021 in Los Angeles County
No ran almost 4 points behind Biden countywide, and that underperformance was broadly distributed — meaning most of the map is red. In Los Angeles proper (which is outlined on the map and casts about 40% of the countywide vote), No beat out Yes by a 54% margin, slightly less than Biden’s 56% 2-party advantage over Trump. However, a streak of blue just east of the city stands out. This part of the county includes cities like Compton, South Gate and Maywood, which are majority-Hispanic by composition. Moving northeast, there is a blue cluster that includes Monterey Park and Rosemead — those communities are roughly two-thirds Asian. Cerritos, a blue outpost on the county’s southeastern border, is also majority Asian.
So, the recall result may suggest Biden’s relative weakness in some heavily-minority communities may be more of a uniquely 2020 phenomenon. However, it is fair to note that, as the large image in Map 1 also shows, No ran behind Newsom’s 2018 (and Biden’s 2020) showing throughout the heavily Hispanic Central Valley — perhaps this implies that, like other racial groups, an urban/rural divide is taking hold within the Hispanic electorate.
This is also not to say that Newsom’s strength over Biden was isolated only to urban minority communities. Glendale, the county’s fourth-largest municipality, is over 60% white and No fared almost 9 percentage points better than Biden.
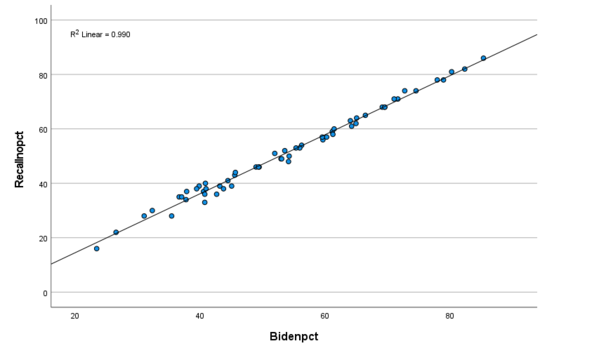
Crystal Ball Senior Columnist Alan Abramowitz passed along a scatterplot (Figure 1, below) that shows just how consistent the recall results were with the 2020 presidential results statewide. The scatterplot compares Joe Biden’s share of the 2-party vote from last year with the “no” on recall vote from last month in each of California’s 58 counties. The Biden vote from 2020 explains 99% of the variance in the 2021 recall vote — meaning that the pattern in the recall vote by county was almost identical to the presidential vote. Biden did better, winning 65% of the 2-party statewide vote in 2020 while Newsom/no won 62% in the recall. That drop from 65%-35% to 62%-38% was a net decline of 6 points from last year. However — and as noted above — Newsom performed overall almost identically as well as he did in 2018, when he won the highest share of the vote for any Democratic gubernatorial candidate in California ever, per Ballotpedia. It’s yet another sign, Abramowitz argues, of our tremendously nationalized politics.
Figure 1: Scatterplot of Biden 2020 vote vs. 2021 “no” on recall vote
So what are the takeaways?
As we try to place California in context, Democrats surely hope that some of the trends there show up in elections to come. Namely, the upcoming race in Virginia, a state that Biden won by 10 points (and Democrat Ralph Northam won by 9 points in the most recent gubernatorial race).
To be clear, California is way more Democratic than Virginia, but if the Virginia race results are as consistent with the 2020 presidential results as California was, McAuliffe would still win by 4 points or so — and he’d win by close to double-digits if he matched the last gubernatorial race in Virginia, just as Newsom matched his 2018 showing.
On the other hand, the races are not the same. For one thing, Newsom’s main opponent — radio talk show host Larry Elder (R), who would have replaced Newsom had the recall been successful — had all sorts of baggage and was easy for Democrats to tie to Donald Trump. Youngkin, the Virginia Republican flag-bearer, is not a moderate, but he’s also been harder to tie to the former president. He may be a better fit for the highly-educated and diverse enclaves of Northern Virginia than Elder was for their counterparts in California — and Youngkin needs to make up ground from recent GOP performances in those areas. His campaign’s recent and much-discussed focus on education is likely targeted at those kinds of places.
Beyond that, California mailed a ballot to every voter, which likely contributed to the high overall turnout (the total votes cast were a little higher than the high-turnout 2018 midterm, when Newsom was first elected). Virginia does not do that, nor do the bulk of other states (there are only a handful of all-mail voting states overall).
And while Biden was slipping in approval in the weeks leading up to the California recall, his position now is likely worse.
There are many other differences. The bottom line, for us, is this: If McAuliffe ends up winning relatively handily (mid single-digits or higher) and outruns the polls, that result combined with California will set up an interesting and counterintuitive trend given the broader political problems for Democrats.
But we don’t feel comfortable assuming in advance that will happen in Virginia just because it happened in California. And given the much-publicized level of concern by Democrats in advance of the Virginia race, we don’t think they’re assuming that either.
Kyle Kondik is a Political Analyst at the Center for Politics at the University of Virginia and the Managing Editor of Sabato's Crystal Ball.
J. Miles Coleman is an elections analyst for Decision Desk HQ and a political cartographer. Follow him on Twitter @jmilescoleman.
See Other Political Commentary by Kyle Kondik.
See Other Political Commentary by J. Miles Coleman.
See Other Political Commentary.
Views expressed in this column are those of the author, not those of Rasmussen Reports. Comments about this content should be directed to the author or syndicate.
Rasmussen Reports is a media company specializing in the collection, publication and distribution of public opinion information.
We conduct public opinion polls on a variety of topics to inform our audience on events in the news and other topics of interest. To ensure editorial control and independence, we pay for the polls ourselves and generate revenue through the sale of subscriptions, sponsorships, and advertising. Nightly polling on politics, business and lifestyle topics provides the content to update the Rasmussen Reports web site many times each day. If it's in the news, it's in our polls. Additionally, the data drives a daily update newsletter and various media outlets across the country.
Some information, including the Rasmussen Reports daily Presidential Tracking Poll and commentaries are available for free to the general public. Subscriptions are available for $4.95 a month or 34.95 a year that provide subscribers with exclusive access to more than 20 stories per week on upcoming elections, consumer confidence, and issues that affect us all. For those who are really into the numbers, Platinum Members can review demographic crosstabs and a full history of our data.
To learn more about our methodology, click here.


