The 2024 Senate Undervote: Not High By Historical Standards
A Commentary By Kyle Kondik
KEY POINTS FROM THIS ARTICLE
— After the election, many took note of some seemingly unusual patterns in the presidential and Senate voting. Some winning Democrats in states that voted for Donald Trump, for instance, received fewer total votes than Kamala Harris, but still won while Harris lost.
— Some voters likely cast votes just in the presidential race, meaning that there were fewer votes cast in a state’s Senate contest compared to its presidential contest.
— However, there is nothing unusual about this compared to recent history. Senate races almost always have fewer votes cast than presidential races in presidential years.
— In fact, the average size of the Senate “undervote” this year was smaller than many other recent cycles.
— The third party vote was generally larger in key Senate races than in the presidential race, which likely also contributed to the outcomes in certain states. But a higher third-party vote for Senate is also not unusual—it was a feature of some of 2020’s closest Senate races, too.
The Senate undervote
Last week, my colleague J. Miles Coleman looked at the difference between the presidential and Senate results. Democratic Senate candidates were able to win in four different states—Arizona, Michigan, Nevada, and Wisconsin—that Donald Trump carried for president.
Actual ticket-splitting was likely part of the story—voters voting for one party for president but another for Senate—but voters casting a vote for president but skipping the Senate race (and other races on the ballot, too) likely was as well.
This article continues the story from last week, looking at the differences between the Senate and presidential elections and also the dropoff in votes cast from the presidential to Senate races (we are going to call this the Senate “undervote”). We’ll first get into the percentage differences between the key Senate races and the presidential races in their states, and then we’ll look at the differences in the raw vote tallies. Finally, we’ll compare total Senate votes to total presidential votes by state in the 7 presidential elections since 2000 to see whether the average size of the “undervote” in Senate races was unusually large this year. It was not—in fact, the average undervote by state was the second-smallest of these recent presidential election years.
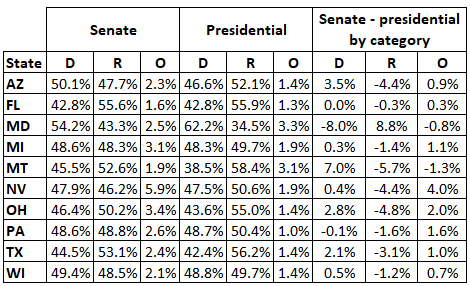
Table 1 shows the results for the Senate races we rated as something other than Safe in our final 2024 ratings. We excluded the Nebraska regular election because it did not feature a Democrat versus a Republican—Dan Osborn ran as an independent—so it didn’t fit well with the format of the table, but we’ll discuss the race in the text later. As a reminder, results are still unofficial in many states, so many of the percentages/vote totals noted throughout this piece will change slightly when results are all certified. We used Dave Leip’s Atlas of U.S. Presidential Elections as of Wednesday morning for the results, with occasional supplementing from media vote reports.
Table 1: Senate vs. presidential vote shares in competitive races
Notes: Includes all races rated Leans or Likely in final Crystal Ball Senate ratings; Nebraska excluded because it featured an independent in place of a Democratic candidate. “O” is all other votes beyond those cast for major party candidates.
Source: Dave Leip’s Atlas of U.S. Presidential Elections as of Wednesday morning, Nov. 20
Other than the Maryland race, where popular former Gov. Larry Hogan (R) ran well ahead of Donald Trump but did not come close to winning, Republican Senate candidates received a smaller share of the vote than Trump did in these states. Meanwhile, Democrats generally received a larger share than Kamala Harris won, although there are some exceptions (other than Maryland). One such example was Pennsylvania, where Sen. Bob Casey (D) received a very slightly smaller share of the vote than Harris. A legal battle over the results in that state continues. Local Democratic officials in a few counties voted to accept ballots that the Pennsylvania Supreme Court had previously advised should not be counted, which (understandably) enraged Republicans. The state court reiterated earlier this week that such ballots should not be counted. The Dispatch’s David Drucker on Wednesday summarized the ballot fight and wrote that even some Democrats see no path for Casey. Although a recount is now underway, Sen.-elect Dave McCormick’s (R) current lead (more than 16,000 votes) is far outside the range in which one might expect a recount to alter the winner. The Associated Press and Decision Desk HQ have called the race for McCormick.
Meanwhile, narrow Democratic winners in Arizona, Michigan, Nevada, and Wisconsin all got at least slightly higher shares of the vote than Harris did, although the differences were half a percentage point or less except in the case of Sen.-elect Ruben Gallego (D-AZ), whose share of the vote was a more robust 3.5 points higher than Harris’s; Gallego needed this kind of overperformance to win given that Harris lost Arizona by 5.5 points, the most lopsided of her losses in the 7 key swing states. Democratic candidates in states that were less competitive for president (Montana, Ohio, and Texas) also ran further ahead of Harris, but just like with Hogan, that was not enough to actually win.
Notice also in Table 1 that the share of votes cast for non-major party candidates was generally higher in the Senate races than in the presidential race, with just a couple of exceptions (Montana and Maryland, two places where the Senate race was clearly more competitive than the presidential race). The presence of third-party candidates may have had an impact on the results, too, given the closeness of some of these races. Going back to Pennsylvania, Libertarian and Constitution party candidates combined for a little more than 1.5% of the vote, likely hurting McCormick more than Casey (their top counties were all heavily Republican). Meanwhile, a Green Party candidate, Leila Hazou, got about 1% of the vote, likely hurting Casey more than McCormick (her best county was deep blue Philadelphia).
Nevada stands out as having a high non-major party vote for Senate, but that total is likely inflated by the state’s unique “None of these Candidates” option, which received 3% of the total Senate votes in 2024. As it was, Sen. Jacky Rosen (D-NV) only got a slightly higher share of the vote than Kamala Harris did, but Sam Brown (R) received roughly 4.5 points less than Donald Trump, helping Rosen win. Something similar happened in the state’s 2012 Senate race, when then-Sen. Dean Heller (R) narrowly won despite Barack Obama winning the state by nearly 7 points for president: Heller only did a few tenths of a percentage point better than Mitt Romney (while winning slightly fewer raw votes than Romney, just like how Rosen got fewer votes than Harris this year), but Shelley Berkley (D) ran way behind Obama. In 2016, now-Sen. Catherine Cortez Masto (D) won a close Senate race against Joe Heck (R) as both received fewer votes than their party’s presidential candidate. In other words, what happened in Nevada has recent historical precedent (as an aside, Berkley just reemerged in politics, winning the Las Vegas mayoral election).
There is also recent precedent for a third party vote being higher in a close Senate race compared to a close presidential race.
Four states featured Senate and presidential races each decided by 3 points or less in 2020: Arizona, Michigan, North Carolina, and the regular Georgia Senate election (we’re considering the first round of voting, not the subsequent runoff). The total number of third-party Senate votes was higher than the number of presidential third party votes in 3 of the 4; Arizona was the exception, but there also was no third party candidate on the ballot that year (although there were a smattering of write-in votes).
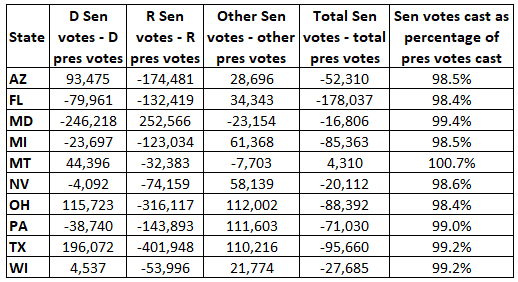
The total number of votes cast in the 2024 Senate contests was lower in almost all of these races than the number of votes cast in the presidential contest.
Table 2 shows the raw vote differences and, in the column on the far right, the total Senate votes cast divided by the number of presidential votes cast in each state. In terms of raw votes, all of the Republicans listed in Table 2 (besides Hogan) received fewer than Trump, while the Democratic story was more mixed (this is just a different way of looking at the story told in Table 1).
Table 2: 2024 Senate raw votes vs. presidential raw votes
Source: Dave Leip’s Atlas of U.S. Presidential Elections as of Wednesday morning, Nov. 20
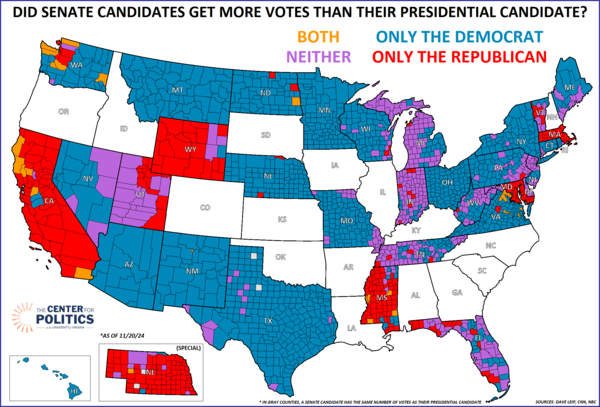
Map 1, from my colleague Miles Coleman, shows the places where Senate candidates exceeded their party presidential candidate in terms of votes won.
Map 1: Senate versus presidential vote totals
Notes: Independent candidates in Maine, Nebraska, and Vermont considered as Democrats for purposes of the map.
Source: Dave Leip’s Atlas of U.S. Presidential Elections as of Wednesday morning, Nov. 20
On average, the total number of Senate votes in the contests listed in Table 2 was about 1% lower than the number of presidential votes cast—this is the Senate “undervote.” The Nebraska regular election also saw a relatively low undervote: The Senate race has 98.8% of votes cast compared to the presidential race, and Sen. Deb Fischer (R-NE) beat Osborn by 6.7 points while Trump carried Nebraska by 20.5 points.
Overall, the average percentage of total presidential votes cast in the Senate races was 98.1%, so there was a little bit less of an undervote in the Senate races rated as something other than Safe compared to the Safe-rated races.
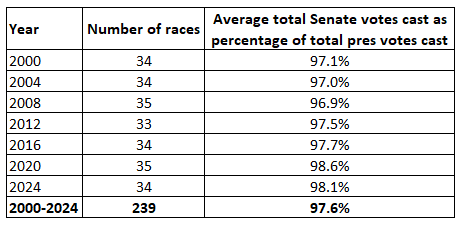
The average size of the Senate undervote was actually smaller this year than in many recent election years. Table 3 shows the average by year over the last 7 presidential cycles. As shown in the table, the 2024 races actually had the second-smallest average undervote, only exceeded by 2020.
Table 3: Average Senate votes cast as percentage of presidential votes cast, 2000-2024
Notes: For elections that went to runoffs, we compared the total votes cast in the initial election held concurrently with the November presidential vote as opposed to the subsequent runoff—this applies to the Louisiana 2016 Senate election and both Georgia 2020 regular and special elections.
Source: Calculated by author from Dave Leip’s Atlas of U.S. Presidential Elections.
Of 239 Senate elections held over the last 7 presidential cycles, almost all of them—232—had a smaller number of votes cast for Senate than for president.
Interestingly, 4 of the 7 exceptions, where there were more votes cast for Senate than for president, came in the same state: Montana. The 2000, 2012, 2020, and 2024 Senate races all had slightly higher vote totals than the presidential race. All 4 of those elections were hotly contested, although the latter pair (2020 and 2024) were not actually that close, as they were decided by 10 and 7 points, respectively. Montana was never competitive for president in these years, so perhaps it makes some intuitive sense that voters treated the Senate race as more of the “main event” in those elections.
The other 3 examples where more votes were cast for Senate than for president were Missouri in 2000, when Gov. Mel Carnahan (D) died in a plane crash a few weeks before the election but still unseated then-Sen. John Ashcroft (R) posthumously; South Dakota in 2004, when the now-incoming Senate majority leader, John Thune (R), defeated the then-sitting Senate minority leader, Tom Daschle (D); and South Carolina in 2020, when Sen. Lindsey Graham (R) faced an expensive, high-profile challenge from Jaime Harrison (D), who is now apparently wrapping up his tenure as chairman of the Democratic National Committee. Just like in the Montana races, perhaps the Senate races just drove slightly higher voter engagement than the presidential race (Missouri was still competitive at the presidential level in 2000, but South Dakota in 2004 and South Carolina in 2020 were not).
This historical perspective is useful because it adds some context to what we saw in 2024. It is not odd for there to be fewer votes cast in a Senate race than in the presidential race—in fact, it would be historically odd if there was not at least some undervote in nearly every race. This dynamic was probably just a little more noticeable this year because of several very close races that, in some instances, produced a different party winner than the state’s presidential winner.
Kyle Kondik is a Political Analyst at the Center for Politics at the University of Virginia and the Managing Editor of Sabato's Crystal Ball.
See Other Political Commentary by Kyle Kondik.
See Other Political Commentary.
Views expressed in this column are those of the author, not those of Rasmussen Reports. Comments about this content should be directed to the author or syndicate.
Rasmussen Reports is a media company specializing in the collection, publication and distribution of public opinion information.
We conduct public opinion polls on a variety of topics to inform our audience on events in the news and other topics of interest. To ensure editorial control and independence, we pay for the polls ourselves and generate revenue through the sale of subscriptions, sponsorships, and advertising. Nightly polling on politics, business and lifestyle topics provides the content to update the Rasmussen Reports web site many times each day. If it's in the news, it's in our polls. Additionally, the data drives a daily update newsletter and various media outlets across the country.
Some information, including the Rasmussen Reports daily Presidential Tracking Poll and commentaries are available for free to the general public. Subscriptions are available for $4.95 a month or 34.95 a year that provide subscribers with exclusive access to more than 20 stories per week on upcoming elections, consumer confidence, and issues that affect us all. For those who are really into the numbers, Platinum Members can review demographic crosstabs and a full history of our data.
To learn more about our methodology, click here.


