Six Decades of Regional Change in House Elections
A Commentary By Kyle Kondik
The GOP edge in the South, already large, could grow in 2022.
KEY POINTS FROM THIS ARTICLE
— The Greater South used to be the key cog in Democratic House majorities; now it is the region that allows Republicans to win majorities.
— Democrats’ dominance on the West Coast and Northeast have allowed them to win majorities even as they have fallen further behind in the Greater South.
— The Republican edge in the Greater South should only grow in 2022.
A brief history of regional strength in the House
One of the likely outcomes of the ongoing redistricting process would be the already-huge Republican edge in a region we’ll call the Greater South growing even larger. If the Republicans capitalize on this opportunity, it will continue what has been perhaps the most important story in House elections since the middle of the 20th century: The South’s transition from a heavily Democratic to a heavily Republican House delegation.
Republicans in North Carolina and Texas drew maps designed to increase their advantage in the House delegations of both of those growing states (we analyzed those maps last week). Republicans in the region’s 2 other most-populous states, Florida and Georgia, likely will as well. Redistricting combined with what for Republicans may be a sunny political environment next year could push the GOP edge in the region to even greater heights.
In my new book, The Long Red Thread: How Democratic Dominance Gave Way to Republican Advantage in U.S. House Elections, I tell the story of House elections from 1964 through 2020. The narrative starts in 1964 because it was the first election after the U.S. Supreme Court’s landmark reapportionment decisions, which applied the principle of “one person, one vote” to U.S. House redistricting, thus mandating population equality among districts in states and setting up our modern redistricting system.

The year 1964 is also significant for other reasons. It came in the midst of a stretch of more than 6 decades of nearly uninterrupted Democratic control of the House from 1931 to the 1994 election. Americans in 1964 elected 295 Democrats to the 435-member House — which remains the largest post-World War II House majority held by either party. But even in the midst of that Democratic success, 1964 was also a year of Republican growth, at least in the South: They netted 4 seats in the region even as Democrats were netting 3 dozen seats overall nationally. The presidential candidacy of conservative Barry Goldwater (R), who opposed federal civil rights legislation, helped Republicans in the conservative South. Still, Democrats retained their historical advantage in the region’s House delegation for another 3 decades, even as Republicans chipped away at it before finally winning the region in their 1994 breakthrough.
Before we go any further, let’s define what the “Greater South” means, as well as the nation’s other regions. Map 1 splits the nation into 5 regions.
Map 1: Regional definitions
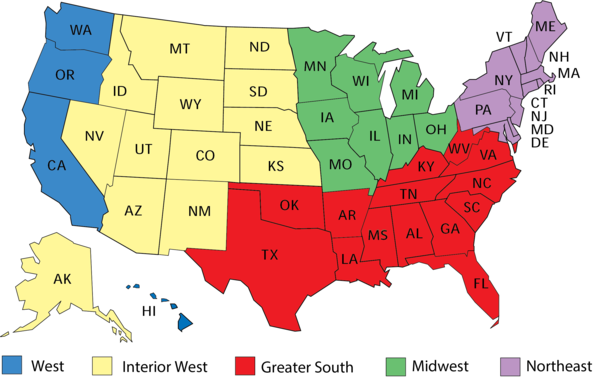
Source: David A. Hopkins
The South is traditionally defined in political science as the 11 states of the Civil War-era Confederate States of America. We add Kentucky, Oklahoma, and West Virginia to the group, states that have some cultural and political similarities to the classically-defined South. The other 4 regions are the Northeast, Midwest, Interior West, and West Coast. We borrowed these 5 regional definitions from David A. Hopkins’ excellent book Red Fighting Blue, which explores the nation’s political divides by geography.
The Greater South had the largest House delegation back in the 1960s, and growth there — led by Florida and Texas — has given it an even larger share of the nation’s House seats now. Table 1 shows each region’s share of House seats from the 1960 census through the 2020 census, upon which this decade’s congressional district maps will be based.
Figure 1: Regional share of House seats by decade, 1960s-2020s
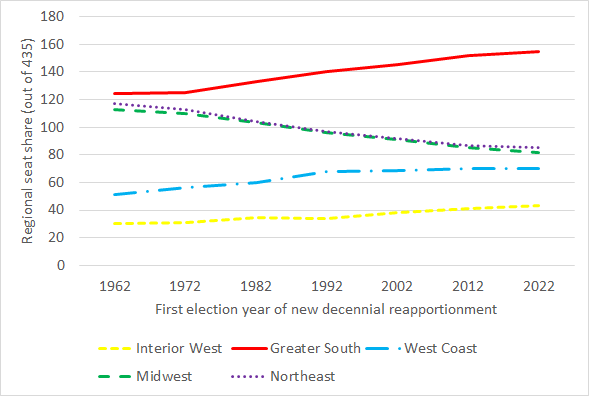
From the 1960 to 2020 census, the Greater South’s share of the seats went from 29% to 36%. The Interior West went from 7% to 10%, while the West Coast went from 12% to 16%. Meanwhile, both the Northeast and Midwest contracted — together they had 53% of all the seats in the 1960s, whereas now they will have just 39% (the regions have had almost the same number of House seats as each other for decades, as illustrated by the nearly-overlapping green and purple lines on the map).
Figure 2 shows the Democratic share of the seats in each region from 1964 through 2020 — if you want the Republican share, it’s just the opposite of whatever the Democratic share is.
Figure 2: Percentage of House seats won by Democrats by region, 1964-2020
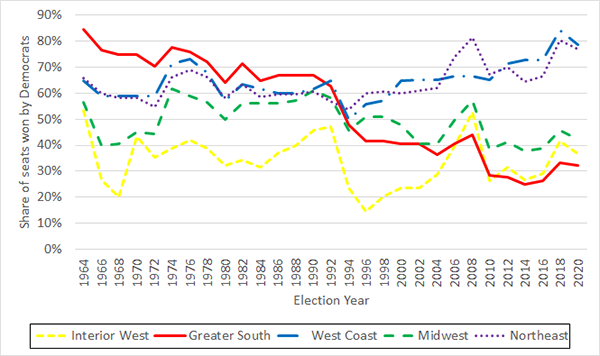
Note the solid red line representing the Greater South: Democrats held 85% of the seats in the region in 1964 but only 32% now — and they were under 30% prior to a rebound in their strong election of 2018. Meanwhile, Democrats have long had edges in the Northeast and West Coast, but those advantages have generally gotten larger in recent years, albeit with a bit of backsliding in 2020. The Republicans almost always hold majorities, and often big majorities, in the growing Interior West, which nonetheless has the fewest seats of any of the regions. The GOP also has often held an edge in the Midwest in recent decades: This century, Democrats have only won a majority of the region’s seats once (2008), although they have come close a few other times.
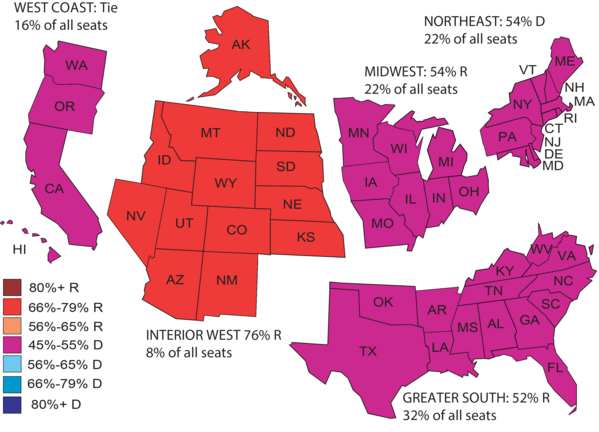
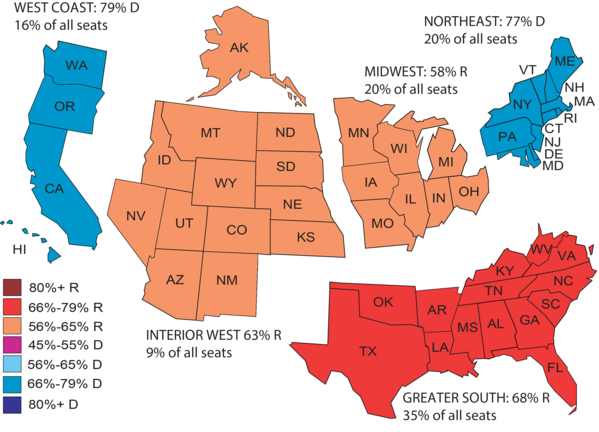
Let’s take a look at the regional trends in another way. Maps 1, 2, and 3 show the regional House strength of the parties in 3 elections: 1968, 1994, and 2020. Democrats won 243 seats in 1968; a quarter century later, Republicans won 230 seats in their 1994 wave; and, a quarter century after that, Democrats won a slim 222-213 edge in 2020.
Map 1: 1968 House results by region
The Democrats’ 1968 majority was reminiscent of modern Democratic majorities in the sense that they had healthy edges on the West Coast and Northeast, although those advantages were not nearly as sharp as they are now. But Democrats owed their overall majority to their still-imposing strength in the Greater South: Even after some erosion in the 1960s, Democrats still held three-quarters of the seats in the region. Republicans dominated the Interior West and had an edge in the Midwest. Overall, Republicans held a 161-150 edge outside the Greater South — but the Democrats’ 93-31 advantage in that region meant they easily held the majority.
Map 2: 1994 House results by region
The GOP finally broke through and won the House in 1994. This was not only the first time since the 1952 election that they had won a majority; it was also the first time since the 1956 election that they had surpassed 200 House seats.
One striking thing about this map is how evenly divided the parties were by region, other than the usual Republican edge in the sparsely-populated Interior West. The West Coast was an exact tie — fueled by Republicans turning an 8-1 Democratic edge in Washington into a 7-2 GOP majority and by Republicans clawing to near-parity in California. Meanwhile, the Democratic advantage in the Northeast was the smallest of the time period covered.
Two years later, as part of President Bill Clinton’s reelection, Democrats netted enough seats across the other 3 regions that if they had just held serve from 1994 in the Greater South and Interior West, they would have narrowly won the House back. But the GOP made further advances in the Greater South — in part by conservative Democrats switching parties and joining the GOP — and, to a lesser extent, in the Interior West. So the Democrats’ 15-seat combined net gain in the Northeast, Midwest, and West Coast was almost totally negated by the Republicans netting an additional 12 seats in the Greater South and Interior West. This foreshadowed further growth for Republicans in the Greater South.
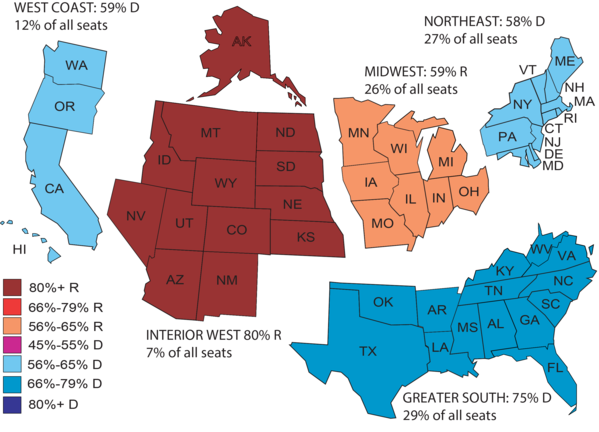
Map 3: 2020 House results by region
In the quarter century since the Republican breakthrough, the Democrats have built a huge edge in their strongest regions, holding more than three-quarters of all the seats in the Northeast and West Coast combined. But the Republicans have kept pace by squeezing markedly more seats out of the Greater South than they held during the 1990s and maintaining advantages in the Midwest and Interior West. That this Republican growth in the Greater South has coincided with the region adding more seats overall has made the GOP gains there even more important and meaningful.
One can also see how the House results in these regions reflect presidential partisanship. In 2020, Joe Biden won every state in the West Coast and Northeast regions. Donald Trump won all but 2 of the Greater South states (Georgia and Virginia were the exceptions). The Midwest states split 4-4, and while Trump carried a majority of the Interior West states (9 of 13), Biden won the 2 most populous states in the region: Arizona and Colorado, where Democrats have also made inroads in the House in recent years.
The road ahead
As noted above, redistricting, along with the current political environment, should allow Republicans to increase their margins in the growing Greater South. There also will be Republican offensive opportunities in the other 4 regions.
In 2020, Democrats won a 173-110 advantage in the 4 non-Southern regions. But the Republicans’ 103-49 advantage in the Greater South kept them close. The region also will represent by far the most important pillar of the next Republican majority, no matter whether it comes next year or in years to come.
Kyle Kondik is a Political Analyst at the Center for Politics at the University of Virginia and the Managing Editor of Sabato's Crystal Ball.
See Other Political Commentary by Kyle Kondik.
See Other Political Commentary.
Views expressed in this column are those of the author, not those of Rasmussen Reports. Comments about this content should be directed to the author or syndicate.
Related Articles

Rasmussen Reports is a media company specializing in the collection, publication and distribution of public opinion information.
We conduct public opinion polls on a variety of topics to inform our audience on events in the news and other topics of interest. To ensure editorial control and independence, we pay for the polls ourselves and generate revenue through the sale of subscriptions, sponsorships, and advertising. Nightly polling on politics, business and lifestyle topics provides the content to update the Rasmussen Reports web site many times each day. If it's in the news, it's in our polls. Additionally, the data drives a daily update newsletter and various media outlets across the country.
Some information, including the Rasmussen Reports daily Presidential Tracking Poll and commentaries are available for free to the general public. Subscriptions are available for $4.95 a month or 34.95 a year that provide subscribers with exclusive access to more than 20 stories per week on upcoming elections, consumer confidence, and issues that affect us all. For those who are really into the numbers, Platinum Members can review demographic crosstabs and a full history of our data.
To learn more about our methodology, click here.