Redistricting in America, Part Two: The Dark Red Greater South
A Commentary By Kyle Kondik and J. Miles Coleman
The Outlook in AL, AR, KY, LA, MS, OK, SC, TN, & WV
KEY POINTS FROM THIS ARTICLE
— Republicans dominate redistricting in a number of small-to-medium-sized states in the Deep South and Greater Appalachia.
— The GOP also already holds the lion’s share of seats in these states, but they may be able to squeeze a bit more out of them.
— Democrats are hoping the courts could help them salvage an extra seat or two out of these states, while Republicans may aggressively target, most notably, Rep. Jim Cooper (D, TN-5) in Nashville.
Redistricting in America, Part Two
In 1989, newly-minted Republican National Committee Chairman Lee Atwater, fresh off a career-defining victory as President George H. W. Bush’s 1988 campaign manager, addressed the Republican Governors Association. For a political operative who was best known for launching emotionally-charged attacks on opponents, he spent much of his address emphasizing something that, as he put it, was not a “gut issue” to most voters: redistricting.
Atwater argued that if Republicans could win more seats in state legislatures, they’d be in a position to get fairer congressional maps — given a “level playing field,” Republicans would have some chance of picking Democrats’ then-34-year lock on the House of Representatives. “If Democrats want votes, Atwater said, “then let them earn votes, not draw them.”
To Atwater’s disappointment, Democrats held serve in the 1990 elections. As a result, with redistricting taking place the next year, Republicans only controlled all the levers of redistricting in states covering a paltry five districts. Democrats controlled the drawing of 172, with the remainder in states with divided government, an alternative form of redistricting, or just a single, at-large seat. The Republicans’ problems were most pronounced in the South, where Democrats retained total control in most places. Though Democrats lost control of the House later that decade, they still came up with some durable gerrymanders.
Nowadays, it is Democrats who wish that the redistricting playing field was more level, especially in Atwater’s native South.
This is the second part of our multi-part Crystal Ball series on congressional redistricting. This week, we’ll be looking at a number of states in the Greater South that voted for Donald Trump by at least double-digit margins. Those are Alabama, Arkansas, Kentucky, Louisiana, Mississippi, Oklahoma, South Carolina, Tennessee, and West Virginia.
These states help illustrate how much has changed in the region since Atwater gave that speech roughly three decades ago: Back then, Democrats controlled every state legislative chamber in these nine states; today, Republicans control all of them. However, Republicans did end up catching some breaks in redistricting even back then, thanks to changes made to the federal Voting Rights Act in 1982, which the Bush-era Justice Department used to force the creation of several majority-minority districts across the South. The creation of these districts sometimes had the effect of consolidating heavily Democratic Black voters, which then made surrounding districts whiter and more Republican. As we’ll note in the state-by-state previews, Democrats are at such a low ebb in these states that they would love to squeeze a few more substantially diverse districts out of them, but that very well may not happen. (As we noted last week, this is also the first redistricting cycle since the Supreme Court’s 2013 Shelby County v. Holder decision, so many Southern states and other jurisdictions with a history of racial discrimination won’t need to obtain federal preclearance for redistricting.)
These nine states will have 50 combined House seats in the next Congress, or 11% of the 435 total. Even taking into account the loss of one of their three current seats in West Virginia, Republicans control 43 of these states’ districts, and they are better positioned than the Democrats to gain in the region through redistricting this cycle.
What follows is a state-by-state analysis of each state. As part of each state’s description, we include the number of seats each state is slated to have in the 2020s, the current party breakdown in each state, and the breakdown of each state’s delegation elected in 2012 after the last decade’s redistricting process (as a point of comparison to show how the delegation has changed, or not changed, over the course of the decade). We also list the districts that are most overpopulated and most underpopulated, based on the American Community Survey estimates from the U.S. Census Bureau through 2019 as compiled by the website Redistricting and You from the Center for Urban Research at the Graduate Center of the City University of New York. Remember, though, these are only estimates. The actual census data that will be used to draw districts won’t be out until Aug. 16, and it will be in a format that will in all likelihood take at least several days for political professionals and analysts to put into a usable form. Finally, we list which party controls redistricting, and which party controlled redistricting in the last redistricting round.
ALABAMA
Number of seats: 7 (no change from 2010s)
Party breakdown in 2012: 6-1 R
Current party breakdown: 6-1 R
Most overpopulated district: AL-5 (Huntsville, Northern Alabama)
Most underpopulated district: AL-7 (Black Belt, Birmingham-Montgomery-Tuscaloosa)
Who controls redistricting: Republicans
2012 control: Republicans
The 2012 Alabama map was perhaps one of the nation’s most understatedly durable gerrymanders. Going into the redistricting process, the Republicans — who had just won control of the state legislature for the first time since Reconstruction — aimed to lock in their gains from 2010. Though the Democrats were down to holding just one of the state’s seven seats, they had held — or made serious attempts at — three other districts during the last decade. Two Republican freshmen were strengthened: then-Rep. Martha Roby (R, AL-2), who had narrowly ousted a Democrat in 2010, saw several Black precincts in Montgomery removed from her Wiregrass-area district, while Rep. Mo Brooks (R, AL-5), up in northern Alabama, lost a few historically Yellow Dog counties (Lawrence and Colbert), and took in more reliably GOP Morgan County. Finally, Rep. Mike Rogers (R, AL-3), who was held to just a 7% win in 2008, relinquished most of his holdings in Montgomery County in favor of picking up heavily GOP St. Clair County.
As a result of the Republican map, and the state’s overall trends, 139 of the 140 congressional races that Alabama saw over the course of the decade ended up as double-digit blowouts, with the one exception being an odd case: in 2016, a Republican write-in candidate took 9% of the vote in AL-2, holding Roby to a 49%-41% win. In the one instance where the state did see a competitive statewide race, the districts behaved just as the GOP mappers would have liked: in the 2017 Senate special election, when now-former Sen. Doug Jones (D-AL) beat Republican Roy Moore, a horribly damaged candidate, Jones took nearly 80% in the Black-majority AL-7, but came up short in every other district — had the previous decade’s map been in place, Jones would have claimed two additional seats.
One dynamic that helped Republicans in 2012, which will probably aid them again, is that the state’s most underpopulated district is the heavily Democratic AL-7. While about three-quarters of the district’s population comes from a trio of urban counties (Jefferson, which contains the city of Birmingham, as well as Montgomery and Tuscaloosa), it includes much of the state’s portion of the Black Belt — and the rural counties there are losing population. So, to pick up population, it seems likely AL-7 will have to expand further into the Birmingham and Montgomery areas, which should help insulate Republicans in adjacent districts.
The state’s quickest-growing district is the northern AL-5, which is now open, as Brooks is running for Senate. Huntsville, the anchor of the district, may actually now be the largest city in the state — its government facilities, specifically the Redstone Arsenal, have drawn high-tech jobs to the area. A quick fix that Republicans may like would be transferring some Democratic precincts in Florence to the neighboring AL-4 — the 4th is now the reddest district in the country based on the 2020 presidential results, and can easily afford to take in bluer turf. Democrats would love for a court to force the drawing of a second majority-Black or Black-voter-influence district, but that does not strike us as particularly likely. Some projections prior to the release of the 2020 census reapportionment numbers suggested that Alabama was likelier than not going to lose a seat, but that did not come to pass; had that happened, Republicans would likely have lost a seat because the Voting Rights Act would have protected Democrats in AL-7.
So this is all to say that, given the population and partisan trends in Alabama, Republicans should have little trouble drawing a similar 6-1 map for the next decade.
ARKANSAS
Number of seats: 4 (no change from 2010s)
Party breakdown in 2012: 4-0 R
Current party breakdown: 4-0 R
Most overpopulated district: AR-3 (Northwest Arkansas)
Most underpopulated district: AR-4 (Southern Arkansas)
Who controls redistricting: Republicans
2012 control: Democrats
Of all the current congressional maps in place, Arkansas’ is probably the closest thing we have to a dummymander. For the first decade of the 2000s, Democrats held three of Arkansas’ four House seats, with the sole Republican, now-Sen. John Boozman (R-AR), representing the ancestrally GOP northwestern corner of the state. Then, ahead of the 2010 election cycle, two entrenched Democrats announced their retirement — in what turned out to be banner GOP year, those seats went on to flip. The good news for Democrats that year was that their third member, then-Rep. Mike Ross (D, AR-4) was not a top GOP target, and, helped by then-Gov. Mike Beebe’s (D-AR) popularity, they kept the legislative trifecta.
As legislative Democrats unveiled drafts of congressional plans in 2011, it was clear that they intended to preserve the basic contours of the existing map, with the goal of winning back a 3-1 advantage in the delegation. The problem, though, was that by then, a pro-Republican trend was obvious, so such a split would likely be unsustainable: in 2008, John McCain improved 10% over George W. Bush’s 2004 showing in Arkansas, with many rural counties shifting 20% or more to McCain. Democrats could have linked Little Rock to some heavily Black counties on the Mississippi Delta, which would have given them one reasonably firm district — with Black residents making up just 16% of the state population, a majority-minority seat is not required in Arkansas. When redrawing AR-4, Democrats deferred to the wishes of Ross, but, in something of an about-face, Ross ended up announcing his retirement.
Democrats ended up passing a plan where all four districts would have still given McCain easy majorities. If the political fault lines of the early 2000s still shaped voting habits, Arkansas would likely still have three Blue Dogs and one Republican in Congress. Instead, the state continued its rightward trek in 2012: The three incumbent Republicans were reelected, and, without Ross’ incumbency, AR-4 flipped red. Republicans also gained control of the state legislature that year, and have since increased their majorities. So now, holding the pen themselves, Arkansas Republicans are in a curious position: given their monopoly on the delegation, preserving something like the current Democratic-drawn map would probably suit them just fine.
The state’s fastest-growing district is AR-3 (where Wal-Mart is headquartered), while Little Rock’s AR-2 also saw growth over the past decade. The two primarily rural districts, AR-1 and AR-4, will have to expand. The shifting border between districts 3 and 4 sums up the state’s population trends well: in 1970, AR-3 stopped just short of the Louisiana border to the south — as the slow-growing 4th has expanded over the past decades, it now comes north, close to the Missouri line.
National Democrats were not the only group frustrated by Arkansas redistricting in 2011 — to the chagrin of political analysts, the legislature departed from tradition in that they split several counties between districts (election breakdowns for whole-county districts are easier to tabulate). Iowa and West Virginia are now the only two states with more than one district to feature whole county districts.
KENTUCKY
Number of seats: 6 (no change from 2010s)
Party breakdown in 2012: 5-1 R
Current party breakdown: 5-1 R
Most overpopulated district: KY-6 (Greater Lexington)
Most underpopulated district: KY-5 (Eastern Kentucky)
Who controls redistricting: Republicans
2012 control: Split
The emcee at the 2013 Kentucky Democratic Party’s Wendell Ford Dinner asked speakers to be brief. So Rep. John Yarmuth (D, KY-3) started his remarks thusly: “I can be really brief tonight and just say Mitch McConnell sucks.”
McConnell, the Senate minority leader who at one time served in a county-level office in Louisville’s Jefferson County, and Yarmuth, who represents Louisville in the House, are longtime antagonists. But McConnell, often the target of Yarmuth’s ire, may end up helping to prolong Yarmuth’s time in the House.
Yarmuth’s KY-3 is the only Democratic district in Kentucky. It’s not hard to imagine a hypothetical 6-0 Republican map in Kentucky that chops up Louisville. While Joe Biden carried KY-3 by 22 points, Donald Trump easily won the rest of the state. His smallest congressional district victory was by nine points in the Lexington-based KY-6, held by Rep. Andy Barr (R), who won by a bigger margin than Trump and held off a well-funded challenge from Amy McGrath (D) in 2018 (McGrath would go on to lose to McConnell in a 2020 rout). Trump won the remaining four districts by at least 30 points apiece, and his victory in eastern Kentucky’s KY-5, held by long-time Rep. Hal Rogers (R), was his second-best congressional district in the entire country, behind only the aforementioned AL-4 (based on numbers from Daily Kos Elections).
But “McConnell has made it known to mapmakers that he feels Yarmuth’s seat should remain intact, according to people familiar with those conversations,” Politico reported earlier this month. He is joined in this by other members of Kentucky’s congressional delegation, who probably don’t want to see their districts radically changed in order to crack Jefferson County and eliminate Yarmuth’s seat and/or are concerned about a court battle. McConnell may also not want to see his hometown sliced up in redistricting, even if failing to do so allows his rival, Yarmuth, to continue in office (Yarmuth does have a progressive primary challenger as well).
Ultimately, Republicans in the state legislature will decide, although the opinion of the congressional delegation likely will have some bearing on what they do. Even though Kentucky has a Democratic governor, Andy Beshear, the Republican-controlled legislature can override his vetoes with a simple majority vote, so this is a Republican-run state when it comes to redistricting.
It may be that not much changes on the Kentucky congressional map, which would be in keeping with what happened after 2000 and 2010 redistricting. Republicans could solidify their 5-1 hold on the map by strengthening GOP numbers in Barr’s district, although he may not necessarily need too much help given that he survived in 2018.
LOUISIANA
Number of seats: 6 (no change from 2010s)
Party breakdown in 2012: 5-1 R
Current party breakdown: 5-1 R
Most overpopulated district: LA-1 (Suburban New Orleans)
Most underpopulated district: LA-5 (Northern Louisiana)
Who controls redistricting: Split
2012 control: Republicans
For Louisiana Republicans, the 2011 redistricting process was what the Washington Post described as a “cruel mistress.” In the early years of the 2000s, Louisiana was seeing stagnant population growth — then, in 2005, Hurricane Katrina flooded New Orleans, displacing thousands of residents. Though Louisiana may still have lost representation in the 2010 census anyway (the state has not seen truly robust population growth since the 1970s), the storm’s impact made downsizing an inevitability. In the state’s congressional delegation, Republicans, who could claim a state governmental trifecta in the state for the first time since Reconstruction, held all but one seat: the state’s Black-majority 2nd District, which was protected by the Voting Rights Act. As a result, a Republican-leaning seat would need to be cut.
Ultimately, then-freshman Rep. Jeff Landry (R, LA-3), a Tea Party conservative who is now the state’s attorney general, was thrown into a district that favored four-term Rep. Charles Boustany (R, LA-7), an ally of then-Speaker John Boehner (R, OH-8). Boustany ultimately won an intraparty runoff in the new seat by a 61%-39% margin.
One lesson of the Boustany/Landry showdown that will probably be relevant this cycle is that, though party loyalties matter, the first goal of most politicians is self-preservation. During redistricting negotiations, the Lafayette-based Boustany would not relinquish Calcasieu Parish (Lake Charles). This was, geographically, the parish farthest away from Landry’s LA-3, so as long as Boustany retained Calcasieu, any new version of his district would likely include much familiar turf. When it looked like some legislative Republicans had other ideas, Boustany threatened to help Democrats pass a plan, though his fellow partisans eventually appeased him.
This cycle, with the state retaining six districts, congressional downsizing won’t generate any redistricting-related drama. Instead, the main source of conflict may come from the governor’s chair: Louisiana is the only state in this group where a Democratic governor might be able to sustain a veto of a GOP-passed map. Though he could well end up signing off on what the legislature comes up with, many Democrats have urged Gov. John Bel Edwards (D-LA) to insist that a second Black-majority seat be drawn. As the state is roughly one-third Black, Democrats argue that two minority-influence seats would better reflect the state’s population. Republicans are just short of a supermajority in the legislature — if Edwards vetoes one of their maps, GOP legislators would need help from a few non-Republicans in the state House to override him. If Edwards and the Republicans can’t agree on a plan, the process will get kicked to the courts, where Edwards (and Democrats) could make the case for more favorable maps.
Map 1 shows a minimal change plan, and then a potential plan with two Black-majority districts.
Map 1: Hypothetical Louisiana redistricting maps
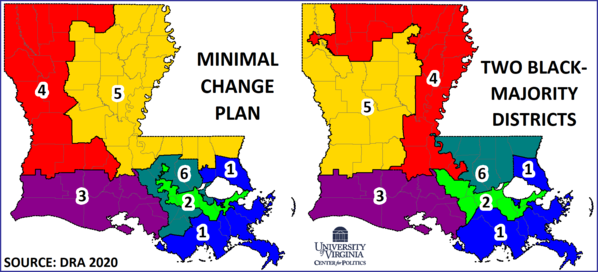
The image on the left is basically indistinguishable from the current plan. The delegation’s newest member, Republican Rep. Julia Letlow, has the slowest-growing district, so her LA-5 expands its holding in what is known as the state’s Florida Parishes, at the expense of LA-6, which retains its Baton Rouge-area orientation.
After the 2010 census, LA-2, which had long been a New Orleans-area seat, was the least populous district in the country — as many of its low-income neighborhoods bore the brunt of Hurricane Katrina’s flooding, its population was down to fewer than 500,000 residents by the end of the decade. To retain its Black-majority status, LA-2 followed the Mississippi River up to Baton Rouge, where it takes most of the state capital’s minority-heavy precincts. As New Orleans has repopulated since 2010, LA-2 sheds a few western precincts, but sees little change. House Minority Whip Steve Scalise’s LA-1 likewise loses a few peripheral precincts, but its focus is still the wealthy New Orleans suburbs, and it holds some swaths of coastal wetlands.
On the right image, a second Black-majority seat is added, running from Baton Rouge up to Shreveport. Though Louisiana had a district with a similar purpose in the early 1990s, the proposed new map is considerably more compact — in fact, this draft only splits seven parishes, down from the current plan’s 15. LA-2, which is knocked down to 53% Black (the existing district is just over 60% Black), would have still given President Biden 68% in 2020, as white New Orleans liberals often vote with minorities for Democrats. But the new LA-4, which has more of a rural component, would be a racially polarized seat: though it should usually lean Democratic, Biden received 55% in this 54% Black seat. In this scenario, Reps. Letlow and Mike Johnson (R, LA-4) would likely run in the new LA-5, or one may retire.
Though a minimum change map seems the more likely outcome, Republicans would, at worst, retain a 4-2 edge in the Louisiana delegation.
MISSISSIPPI
Number of seats: 4 (no change from 2010s)
Party breakdown in 2012: 3-1 R
Current party breakdown: 3-1 R
Most overpopulated district: MS-4 (Gulf coast)
Most underpopulated district: MS-2 (Jackson/Delta)
Who controls redistricting: Republicans
2012 control: Split
Mississippi, with its four districts, may be one of the more uneventful redistrictings of this cycle. In 2011, with a Republican state Senate and a Democratic state House, legislators couldn’t agree on a plan. When a panel of three federal judges stepped in, they produced a plan largely similar to the existing map. Though Republicans control the process this cycle, there may likewise be little appetite for major changes.
To start, Democratic Rep. Bennie Thompson’s 2nd District is protected by the Voting Rights Act. Two-thirds Black by composition, it includes much of the Delta region, and almost all of Jackson’s Hinds County. Due to population losses in the rural areas, MS-2 will need to pick up about 50,000 residents; reaching further down the Louisiana border to take in the trio of Adams, Franklin, and Wilkinson counties would basically accomplish this, along with some minor tweaks in the Jackson area.
Assuming the changes to MS-2 are minimal, the other three districts should be fairly straightforward. The most overpopulated district is MS-4, which has seen an influx of residents to its Gulf Coast communities. MS-4 routinely gives Republican presidential nominees close to 70% of the vote.
Moving north, MS-3 is a wide swath of central Mississippi. Rankin County, a solidly red county that includes parts of suburban Jackson, is MS-3’s most populous county, though it only accounts for 20% of the district population — the balance comes from about 20 counties that are generally more rural.
Lastly, MS-1 is essentially coterminous with the northeastern corner of the state. Though MS-1 is the state’s second most Republican district (after MS-4), some of its counties are exhibiting divergent trends. Though DeSoto County, which borders Memphis, TN and is growing more suburban, still gave Trump 61% last year, it saw a 10% swing to Biden — the largest shift, in either direction, in the state. A few miles to the east, Benton County, which is 35% Black, was a rare county that flipped from McCain in 2008 to Obama in 2012. That Trump then carried it by double-digits in both 2016 and 2020 shows the struggles that Democrats have faced in parts of the post-Obama South.
While it’s possible to draw two majority-minority districts in Mississippi, any reasonably clean iterations of such districts would only be slightly above 50% Black. Given the highly polarized racial patterns in Mississippi, in a bad year for Democrats, the minority-backed candidate may not be guaranteed victory. It is also questionable whether Thompson would be on board with taking on a significantly more competitive seat, and the Republicans who control the process wouldn’t want to do that anyway.
OKLAHOMA
Number of seats: 5 (no change from 2010s)
Party breakdown in 2012: 5-0 R
Current party breakdown: 5-0 R
Most overpopulated district: OK-5 (Oklahoma City)
Most underpopulated district: OK-2 (Eastern Oklahoma)
Who controls redistricting: Republicans
2012 control: Republicans
Only two of Oklahoma’s five seats changed hands over the last decade, but they are emblematic of national trends: namely, Democratic problems in rural districts they used to win, and Republican problems in urban/suburban districts that used to be more Republican than they are now.
In post-2010 redistricting, the Republicans who controlled the process made only small changes to the state’s five districts. That included then-Rep. Dan Boren’s (D) OK-2, which covers eastern Oklahoma, including the state’s southeast corner along the Texas and Arkansas borders, a region called “Little Dixie.” Boren’s family connections — his father, David, served as governor and U.S. senator — as well as a lingering ancestral Democratic tradition in his district allowed him to win easily even in 2010, despite the district voting for John McCain in 2008 by a two-to-one margin. But Boren, at just age 37, retired in 2011, just a few months after the new map came out, and Republicans easily won OK-2 in all five elections held under the post-2010 map.
Meanwhile, Republicans’ urban/suburban problems under Donald Trump became so bad in 2018 that they lost the Oklahoma City-based OK-5 in what was perhaps the Democrats’ most surprising victory that year. Kendra Horn (D), helped by a late infusion of cash from Michael Bloomberg, seemed to catch then-Rep. Steve Russell (R) by surprise.
But now-Rep. Stephanie Bice (R, OK-5) restored Republican order in the district, beating Horn by four points. Still, there is a clear Democratic trend in the district: Mitt Romney won it by 18 points, but that margin fell to 14 for Donald Trump in 2016 and just five in 2020. So one would assume that Republicans, who control redistricting, will attempt to modify OK-5 to prevent it from falling into Democratic hands this decade.
The current OK-5 contains most, but not all, of Oklahoma City’s Oklahoma County, which came within about a point of voting for Biden. That the county stuck with Trump meant that, for the fifth straight presidential election, Republicans won every county in Oklahoma. Trump won every other district in the state by at least 20 points or more, so it wouldn’t be hard to strengthen the GOP in OK-5 at the expense of some surrounding areas.
SOUTH CAROLINA
Number of seats: 7 (no change from 2010s)
Party breakdown in 2012: 6-1 R
Current party breakdown: 6-1 R
Most overpopulated district: SC-1 (Charleston suburbs)
Most underpopulated district: SC-6 (Charleston/Columbia/Black Belt)
Who controls redistricting: Republicans
2012 control: Republicans
Since the 1990 census, either of the Carolinas has gained a district: after two consecutive rounds, 1990 and 2000, of adding seats, North Carolina remained stagnant at 13 districts after 2010 (but the state is adding a 14th seat for the 2020s), while South Carolina jumped from 6 to 7 last decade. The question of the new seat’s placement led to a more dramatic redistricting than usual in South Carolina, despite total Republican control of the process. Essentially, while the state House placed the new 7th seat in the Pee Dee River Basin, the state Senate plan placed it south of Charleston. The result was a compromise that tracked closer to the House plan, and legislators had the goal of a 6-1 Republican delegation.
For most of the decade, the map worked as intended. The 1st District, which hugs coastal communities around Charleston, was the only district to see partisan turnover. In 2018, when pro-Trump Republicans in the 1st District primaried out Rep. Mark Sanford (a former governor who had also represented SC-1 in the 1990s), Democrats snagged the seat with Joe Cunningham. In 2020, though Trump’s margin dropped from 53%-41% to 52%-46%, Cunningham narrowly lost to now-Rep. Nancy Mace. While Mace initially showed some of Sanford’s independence, she has since seemed more of a mainstream Republican.
In any case, Mace may benefit from the state’s population trends: her SC-1, the most populated district, is adjacent to SC-6, the least populated. The 6th District has sent now-Democratic Majority Whip Jim Clyburn to Congress ever since it became a Black-majority seat, in 1992, and it will need to pick up tens of thousands of residents. The 6th could easily grab some Democratic-leaning Charleston precincts in SC-1, which would push the latter seat a few points to the right.
Though both seats are currently held by Republicans, a similar tradeoff could take place between districts 3 and 4 in Upstate South Carolina. SC-4, which is the Greenville-Spartanburg area, has gotten smaller (geographically) over the last several decades, and it could simply transfer more of its Greenville County precincts to SC-3, a rural seat which needs to gain population.
The districts in between Lowcountry and Upstate may not see many changes: all three are already within two percentage points of the ideal district population and each is reliably red, although the 2nd, held by Rep. Joe Wilson (R), could perhaps be strengthened as it became a little less Republican over the course of the decade.
TENNESSEE
Number of seats: 9 (no change from 2010s)
Party breakdown in 2012: 7-2 R
Current party breakdown: 7-2 R
Most overpopulated district: TN-4 (South-Central Tennessee)
Most underpopulated district: TN-9 (Memphis)
Who controls redistricting: Republicans
2012 control: Republicans
Going into the 2011 redistricting process, Republicans were riding high in Tennessee. In 2010, they picked up the governorship and turned a 5-4 Democratic majority in the congressional delegation to a solid 7-2 GOP advantage. Importantly, the three seats that Republicans gained seemed solid: they’d all given McCain double-digit wins in 2008, and the GOP freshmen were replacing entrenched Democrats, whose appeal would be hard for future Democratic challengers to replicate.
So with Republicans’ existing edge in the delegation, the 2011 redistricting in Tennessee was in large part driven by incumbent, not partisan, considerations. For example, then-Rep. Diane Black (R, TN-6) won her 2010 primary with a 31% plurality — it was not surprising when Rutherford County, where her two main primary opponents fared well, was removed from the district.
Though Tennessee Republicans ended up passing a map that preserved their comfortable 7-2 advantage, more aggressive options were considered. While Memphis’ TN-9 is heavily Black (radically altering it would have surely result in court challenges), Nashville’s TN-5, which is white-majority, emerged as a possible target. Currently, the three districts that surround TN-5 are all ruby red (each gave Trump at least 67% in 2020), so it would not be hard to dilute Democratic votes in Nashville by splitting them up among several districts.
In Map 2, Davidson County is split among four districts — the most Democratic of these seats is TN-5, which would have given Trump 57% both times he was on the general election ballot. We used the Cumberland River, which bisects Nashville, as something of a natural guide, but the are many ways to crack the county.
Map 2: Hypothetical pro-Republican gerrymander of Tennessee
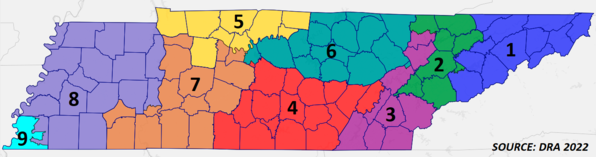
One reason why Republicans didn’t attempt an 8-1 map in 2011 may have been TN-5’s incumbent. Rep. Jim Cooper (D, TN-5), a moderate Democrat who has represented the Nashville area since 2002, used to hold a rural seat earlier in his career, where he was reelected easily in the 1980s and early 1990s. Given Cooper’s record in non-metropolitan parts of the state, it was feasible that he’d hold on in a redder district. But rural Tennessee has continued to shift rightward, and even the strongest statewide Democrats have struggled to find much crossover appeal there. Our sources on both sides of the aisle believe that Cooper is in serious danger of seeing his district broken apart, allowing Republicans to likely net an extra seat in Tennessee.
From a demographic perspective, many of the state’s fast-growing counties form a crescent around Nashville: Sumner and Wilson counties are in TN-6, Rutherford was moved into TN-4 for 2012, and Williamson County, the state’s wealthiest and most college-educated county, has been in TN-7 since 2002. A decade ago, those four counties had 720,000 residents, or just over the population of a single district — they now claim 860,000 residents, which is 115,000 over the ideal district population. On the other extreme, TN-9 has seen the slowest growth, and needs to add roughly 60,000 people — it will likely pick up some suburban Memphis precincts from TN-8, but it should still be around 65% Black. TN-8, which takes in West Tennessee, was amenable to Democrats 15 years ago, but is now a safely red seat, and it probably won’t change as much as the Nashville-area districts.
The only two counties east of the Nashville area where Joe Biden cracked even 40% of the vote were Knox (Knoxville) and Hamilton (Chattanooga); they anchor TN-2 and TN-3, respectively. While those counties have seen some pro-Democratic trends, both districts contain a handful of deeply red rural counties, so Republicans should feel secure in each. Finally, TN-1 will likely see minimal changes — it’s been nestled in the northeastern corner of the state for essentially the state’s entire history and last elected a Democrat in 1878.
WEST VIRGINIA
Number of seats: 2 (down 1 from 2010s)
Party breakdown in 2012: 2-1 R
Current party breakdown: 3-0 R
Most overpopulated district: WV-2 (Charleston/Eastern Panhandle)
Most underpopulated district: WV-3 (Southern coalfields)
Who controls redistricting: Republicans
2012 control: Democrats
In 1952, when voters in a Charleston-area district first sent Robert Byrd to Congress, he was part of the state’s six-member House delegation. Six years later, Byrd made the jump to the Senate, where he’d serve for more than half a century. While Byrd used his clout to steer resources to the state, demographic trends have not been kind to West Virginia: today, some counties in the state’s southern coalfields claim less than half of their 1950 populations.
At the start of the next Congress, the Mountain State will be down to just two seats in the House. Even worse for Republicans, who have full control of state government for the first census since the Hoover Administration, is that one of their own members will have to go — they hold all three of the state’s seats.
Though Democrats, who had a government trifecta in 2011, considered some creative plans last cycle, they ultimately took a minimal change approach. In what was dubbed the “Mason County flip,” just one county on the entire map changed districts (Mason County was moved out of WV-2 and into WV-3).
West Virginia has always kept counties whole. In a ruling that defined the state’s 2011 redistricting outcome, the U.S. Supreme Court maintained that, in the interest of keeping counties whole, a greater-than desirable population deviation between districts is permissible. There are several combinations of whole counties that could produce two districts.
Since 1992, the most awkward district on the map has undoubtedly been the 2nd District, which includes both the Charleston metro area and the Eastern Panhandle. As the Washington, D.C. suburbs have spilled into the panhandle, the two extremes of WV-2 have become increasingly dissimilar.
An obvious fix would be to essentially split WV-2 in two. WV-2’s panhandle could easily be given to WV-1, which is based in Morgantown and includes the state’s Northern Panhandle, while Charleston’s Kanawha County would be grouped with the southern coalfields, which make up the current WV-3.
Though Rep. Alex Mooney (R, WV-2) has a base in the Eastern Panhandle (before his time in Congress, he served in Maryland’s legislature) and would probably prefer an east-west configuration, the state’s cultural, and political, lines seem to fall on more of a north-against-south axis.
Regardless of which Republicans are bunked together, West Virginia is so red these days that virtually any two districts there would both vote safely Republican.
Conclusion
In this Republican-dominated group of states, the GOP could get even stronger, most likely by the dismantling of Democratic-held TN-5 in Nashville. Other than that, the GOP could shore up some of the seats that got more competitive over the course of the last decade, like OK-5 and SC-1. Squeezing a second seat out of Louisiana through Gov. Edwards’ veto pen and/or court action is probably the Democrats’ best chance to get a new seat in these states next year. It seems possible that whatever the outcome in these seats are in 2022 could last the entire decade given the region’s overall lack of competitiveness, but, of course, political trends could upset some of the maps there.
Kyle Kondik is a Political Analyst at the Center for Politics at the University of Virginia and the Managing Editor of Sabato's Crystal Ball.
J. Miles Coleman is an elections analyst for Decision Desk HQ and a political cartographer. Follow him on Twitter @jmilescoleman.
See Other Political Commentary by Kyle Kondik.
See Other Political Commentary by J. Miles Coleman.
See Other Political Commentary.
This article is reprinted from Sabato's Crystal Ball.
Views expressed in this column are those of the author, not those of Rasmussen Reports. Comments about this content should be directed to the author or syndicate.
Related Articles

Rasmussen Reports is a media company specializing in the collection, publication and distribution of public opinion information.
We conduct public opinion polls on a variety of topics to inform our audience on events in the news and other topics of interest. To ensure editorial control and independence, we pay for the polls ourselves and generate revenue through the sale of subscriptions, sponsorships, and advertising. Nightly polling on politics, business and lifestyle topics provides the content to update the Rasmussen Reports web site many times each day. If it's in the news, it's in our polls. Additionally, the data drives a daily update newsletter and various media outlets across the country.
Some information, including the Rasmussen Reports daily Presidential Tracking Poll and commentaries are available for free to the general public. Subscriptions are available for $4.95 a month or 34.95 a year that provide subscribers with exclusive access to more than 20 stories per week on upcoming elections, consumer confidence, and issues that affect us all. For those who are really into the numbers, Platinum Members can review demographic crosstabs and a full history of our data.
To learn more about our methodology, click here.