Notes on the State of the 2020 Election
A Commentary By Kyle Kondik and J. Miles Coleman
Biden’s thin margins in the decisive states; third party vote declines; Senate aligns more closely with presidential partisanship; Republicans demonstrate down-ballot crossover appeal.
KEY POINTS FROM THIS ARTICLE
— Joe Biden is on track to exceed Barack Obama’s 2012 popular vote margin, but his victory in the key states is even narrower than Donald Trump’s in 2016.
— Less than 2% of the national vote went to candidates other than Biden and Trump, a significant change from 2016.
— Assuming nothing changes, as many as 94 of 100 senators in the next Congress will share the same party as the state’s presidential winner.
— The ability to generate crossover support helped Republicans perform surprisingly well in both Senate and House races.
The presidential race: both not close and extremely close
Votes continue to be counted in the presidential race, and all indications are that Joe Biden’s lead in the national popular vote will continue to grow. Among those states that still appear to have a significant number of votes to count are California, Illinois, and New York. These big blue states will pad Biden’s national edge, which currently sits at 50.7%-47.4% in the national popular vote as of Wednesday morning. Biden’s national popular vote edge appears likely to exceed Barack Obama’s from 2012 (about four points), though it will fall short of Obama’s seven-point edge in 2008. Assuming Biden clears Obama’s 3.9-point 2012 margin, his will be the second-biggest popular vote win in the six elections this century (yes, we know, 2000 technically isn’t in this century, but we’re including it anyway).
Of course, the popular vote does not determine who wins the presidency.
We (and others) frequently noted the past four years that Donald Trump’s 2016 victory was built on the strength of a roughly 78,000-vote edge in three key states (Michigan, Pennsylvania, and Wisconsin). Flipping those states, which were Trump’s three-closest victories, to Hillary Clinton would have given her an Electoral College majority.
This time, Biden’s fate was in the hands of four states, Pennsylvania, Wisconsin, Arizona, and Georgia, that were collectively decided by about 97,000 votes (that number will change, and Biden’s edge at least in Pennsylvania should continue to expand while Arizona has gotten closer in later-counted returns). Give these four states to Trump, and Trump wins.
However, it’s actually more complicated than that, and Biden’s actual edge in the decisive states is really even narrower.
If one gave Biden all but his three closest states (Arizona, Georgia, and Wisconsin), he would have been stuck in a 269-269 Electoral College tie with Trump. That would be all of Clinton’s 2016 states — 232 electoral votes — plus Michigan, Pennsylvania, and Nebraska’s Second Congressional District.
As we noted several times before the election, a 269-269 tie broken by the House would likely have been broken in Trump’s favor because of GOP control of individual U.S. House delegations: In a House tiebreaker, each of the 50 states gets a single vote, and the Republicans went into the election controlling a bare majority of delegations, 26 of 50. They continue to hold 26, but Democrats fell from 23 to 20 after Republicans forged ties in Minnesota, Michigan, and Iowa (and Iowa may flip depending on what happens in the uncalled IA-2 race). So we can say with a bit more confidence that a 269-269 tie would have gone to Trump.
Biden’s victory therefore belongs to his narrow margins in just Arizona, Georgia, and Wisconsin — a combined 47,000 votes or so as of Wednesday morning. Flip these states to Trump, and there is a 269-269 tie that Trump likely wins in the House.
By that token, Biden’s victory in 2020 was even smaller than Trump’s in 2016, even though Biden will easily win the popular vote after Trump lost it by two points.
The situation is reminiscent of Harry Truman’s surprise victory over Thomas Dewey in 1948. In that election, Truman ended up winning the national popular vote by about 4.5 points over Dewey in a four-way race that also featured conservative Dixiecrat Strom Thurmond and progressive Henry Wallace (more on notable third party candidacies below).
Truman’s victory in the Electoral College was markedly tighter than his popular vote margin would indicate: He won California by a shade under half a point, and Ohio by just a quarter of a point. Had Dewey won both of those states, the election would have been thrown to the House — and if Dewey had won those two plus Illinois, decided by a little less than a point, Dewey would have won.
Voters focus on the major parties
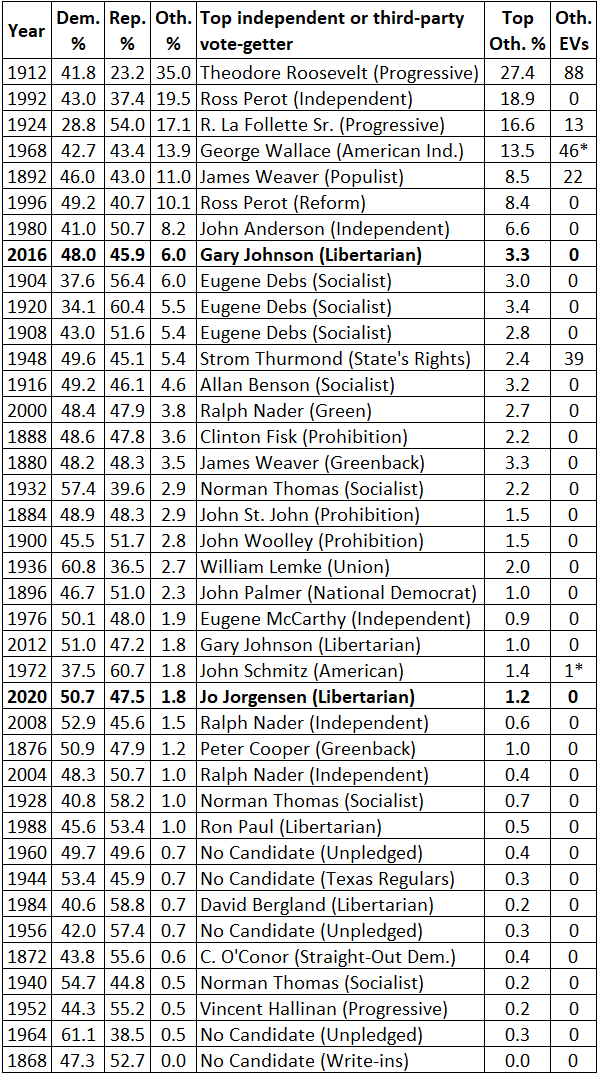
We suggested several months ago that third party candidates did not seem likely to attract as much support as they did in 2016. Donald Trump, as an incumbent president, seemed to focus the minds of both his supporters and his opponents. As it stands now, Trump and Joe Biden are attracting 98.2% of all votes cast, with just the remaining 1.8% going to other candidates and write-ins. That is up markedly from 2016, when Trump and Hillary Clinton split 94% of all the votes cast, with a larger 6% going to other candidates and write-ins.
Jo Jorgensen, the Libertarian nominee, currently is winning close to 1.2% of the vote — so about two-thirds of the total non-major party vote. This is the second-best Libertarian share ever, though well behind Gary Johnson’s 3.3% in 2016. The Libertarian tally is bigger than Biden’s margin of victory in Arizona, Georgia, Pennsylvania (at least for now), and Wisconsin. So, in a reversal of 2016, Republicans are the ones wondering “what if” about conservative third party defectors (just as Democrats were about Jill Stein Green Party voters four years ago).
As it stands now, 2020 appears likely to feature a relatively low share of third party votes compared to the 38 other post-Civil War presidential elections. Table 1 shows the third party vote in this timeframe — both the combined vote share in each election and the top third-party vote-getter in each election (we only included the top non-major party performer each year in the table for space reasons, so the table omits some notable third party candidacies, such as Eugene Debs in 1912 and the aforementioned Wallace in 1948).
Note that 2016 is in the top 10 for third party performance, while 2020 is currently in the lower half. We bolded 2016 and 2020 so you can see for yourselves.
Table 1: Third party presidential performance, 1868-2020
Note: *In 1968, one faithless elector in North Carolina cast his vote for George Wallace rather than Richard Nixon. In 1972, one faithless elector in Virginia cast his vote for Libertarian John Hospers rather than Nixon. The “Oth. EVs” column only includes electoral votes cast for third party candidates who competed in the election.
Source: Dave Leip’s Atlas of U.S. Presidential Elections
Crossover state senators decline
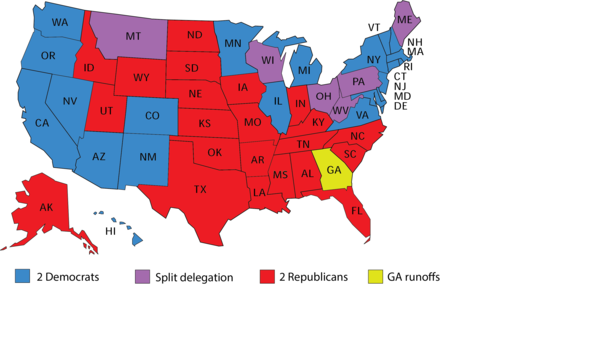
Heading into the election, 11 senators represented states won by the other party’s presidential candidate in 2016. The results of both this year’s Senate and presidential contests have thinned that group.
There are now only six senators, three from each party, who represent states that their party did not win in the 2020 presidential race. (This classifies the two independents who caucus with the Democrats, Angus King of Maine and Bernie Sanders of Vermont, as Democrats for the purposes of this analysis.)
Let’s go through what happened and why the number of crossover state senators declined.
First of all, Sens. Doug Jones (D-AL) and Cory Gardner (R-CO) lost in their states, both of which voted Republican (Alabama) and Democratic (Colorado) for president by double-digit margins. They were always the most vulnerable senators this election cycle and, in the end, their races didn’t feature much drama.
Michigan flipped from Trump to Biden, and Sen. Gary Peters (D-MI) won a narrow victory. Michigan’s other senator, Debbie Stabenow, is also a Democrat, so that’s two more senators (Peters and Stabenow) whose party is aligned with the presidential winner in their state.
Arizona flipping from Trump to Biden also meant that Sen. Kyrsten Sinema (D-AZ) no longer represents crossover turf, nor does Sen.-elect Mark Kelly (D-AZ). Kelly will have to defend his narrowly-won new seat in 2022 as he seeks a full term in what has become a very competitive state. Biden’s margin in the state was of course narrow.
Georgia, which it appears voted for Biden, could add to the crossover group if one or both of Sens. David Perdue (R) and Kelly Loeffler (R) hold their seats in the looming Jan. 5, 2021 Senate runoffs that will determine control of the Senate. But let’s set them aside for now.
Sen. Susan Collins (R-ME), who won an impressive victory last week with a great deal of crossover support, is joined as a Biden-state Republican by Sens. Pat Toomey (R-PA) and Ron Johnson (R-WI). Both of those seats are on the ballot in 2022: Toomey is not running for a third term, and Johnson may or may not.
Meanwhile, three Trump-state Democratic senators remain: Sens. Jon Tester (D-MT), Sherrod Brown (D-OH), and Joe Manchin (D-WV). Those senators are next up in 2024, when the Republican presidential tilt of those states will make all three attractive GOP targets.
Map 1: 2021 party control of senators by state
One other note: Only six states have a split Senate delegation; that number could increase with the Georgia runoffs if voters render a split verdict in those races (typically, though, when two Senate races are on the ballot at the same time, the same party sweeps both races).
Republicans benefit from crossover support
Republicans had an impressive night in the Senate and House: They currently hold a 50-48 edge in the Senate, with two runoffs in Georgia looming. In the House, and with several uncalled races, Republicans have significantly cut into the Democratic House majority, pushing the 235-200 advantage the Democrats won in 2018 down to perhaps 225-210 or even smaller (it may be a little while before we have a complete House tally).
The GOP accomplished their House gains — gains that came as a surprise to us and other handicappers — by both knocking off Trump-district Democratic incumbents and generating crossover support in districts that were more competitive for president.
The number of Trump-district Democrats will be markedly smaller than the 30 that Democrats held going into the election, both because Republicans knocked off many House Democrats in Trump-won districts and because Biden flipped some districts with Democratic House incumbents that Trump carried in 2016. For instance, Reps. Elaine Luria (D, VA-2) and Abigail Spanberger (D, VA-7) held on for reelection as Biden carried their Trump-won districts.
There also are going to be several Biden-district Republicans — one of them is Rep. Don Bacon (R, NE-2). The voting in that district merits a closer look.
Ever since Obama narrowly carried the Omaha-based NE-2 in 2008, it’s been a target for Democrats in the Electoral College, but Republicans retained it in 2012 and 2016. This year, though, the district seemed primed to shift blue. According to the census, just over 42% of its residents over 25 years old have a bachelor’s degree or higher, a number comparable to a state like Massachusetts. While voters don’t cast ballots based on educational attainment alone, it’s become an increasingly salient factor in elections.
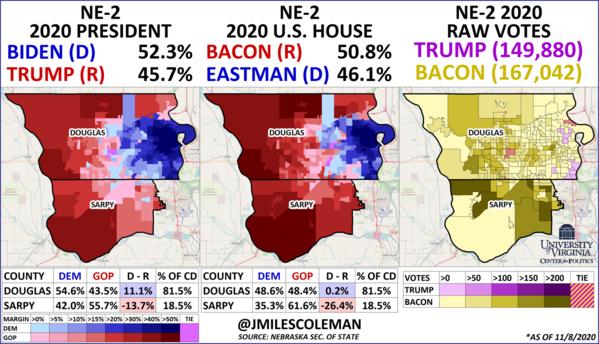
Biden ultimately carried NE-2 by a 52%-46% spread, about in line with what polling suggested. But down the ballot, the district summarized House Democrats’ predicament fairly well, at least in suburbs. Despite Biden’s healthy margin there, two-term Rep. Don Bacon (R, NE-2) won a third term 51%-46% (Map 2).
Map 2: NE-2 in 2020
While the NE-2 result lines up cleanly with the national narrative that emerged last week, there were certainly some factors in this race that pointed to a Bacon win (the Crystal Ball’s final rating for the race was Leans Republican). In the closing weeks of the campaign, former Rep. Brad Ashford (D, NE-2), the district’s most recent Democratic congressman, endorsed Bacon — though for some context, Democratic nominee Kara Eastman beat Ashford in the primary when he tried to stage a comeback in 2018 and then decisively defeated his wife in May’s primary. Speaking of that May primary, at the time we noticed that Bacon received more raw votes than Trump — something fairly rare for members of Congress in down-ballot races, so perhaps that was an early indicator of his appeal. Last week, Bacon again received more votes than the president. On the third image in Map 2, Bacon tended to run further ahead of Trump in the Sarpy County portion of this district; though it sits just outside of the district, the area is home to Offutt Air Force Base, so it’s easy to see Bacon’s biography as a retired Air Force brigadier general playing well there.
Moving one state to the southeast, Democrats were excited about their prospects against Rep. Ann Wagner (R, MO-2). In 2018, then-Sen. Claire McCaskill (D-MO) carried this suburban St. Louis district by about 2.5%, and Wagner held on by four percentage points. Democrats landed a quality recruit in state Sen. Jill Schupp, who raised serious money. Democrats were hoping Biden would carry this district — instead, it looks about tied, and Wagner ended up expanding her margin from 2018, from four points to seven.
After the 2018 elections, California’s Orange County was one of the focal points for Democratic gains in the House. This populous county contains all or parts of seven congressional districts and in the California GOP’s heyday, Orange County would sometimes give Golden State Republicans — like then-Gov. Ronald Reagan — around 70% of the vote in state elections. Fueled by changing demographics and anti-Trump sentiments, Democrats swept the entire Orange County congressional delegation in 2018. As of Wednesday morning, first-term Reps. Gil Cisneros (D, CA-39) and Harley Rouda (D, CA-48) were either trailing or had lost, and both are running behind Biden in their districts and faced Asian-American women: Cisneros is in a rematch with Young Kim (R), while Rouda lost to Orange County Supervisor Michelle Steel (R).
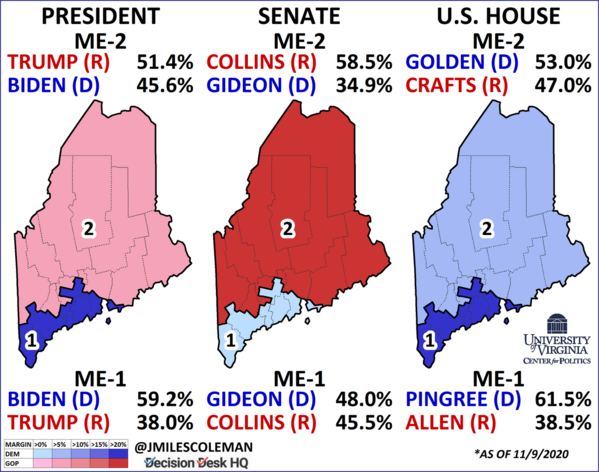
One of the surprises of Election Night was that not only did Sen. Susan Collins (R-ME) win, but she got over 50% and avoided having to win through Maine’s ranked-choice voting system. The level of crossover voting in her race was significant: As of right now, Biden is winning the state by 8.7 points, while Collins us up by 8.9 points.
The crossover vote in Maine may be even more impressive when you factor in the House picture. In the northern ME-2, Trump held the district’s electoral vote by about 6% and Collins won it by nearly 25% in her senatorial reelection. However, the district reelected first-term Rep. Jared Golden (D, ME-2). In the Portland-based ME-1, Collins held her opponent, state House Speaker Sara Gideon (D), to just a 2.5% margin, while neither Trump nor the GOP nominee for Congress broke 40% there. (Map 3)
Map 3: Maine in 2020
In North Carolina, Sen. Thom Tillis (R) prevailed by a 49%-47% vote, defying the preponderance of polling (just like Collins did). Though this result lined up much closer with the presidential result than Maine did, Tillis outperformed Trump in the wealthier suburbs.
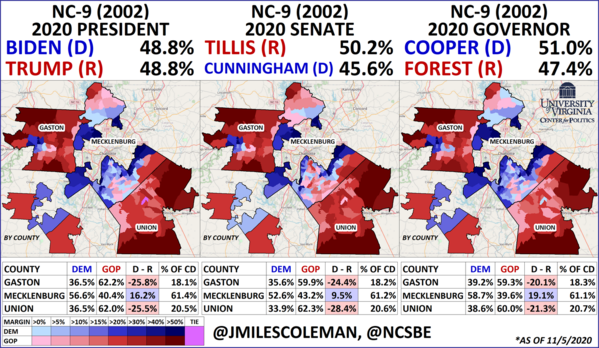
Let’s consider an old congressional district: the 2002 to 2010 version of NC-9. This was based primarily in the heavily white, economically affluent south Charlotte suburbs, and took in parts of Gaston and Union counties, which are more exurban. In 2008, Barack Obama would have lost that iteration of NC-9 54%-45%, and it was essentially a no man’s land for down-ballot Democrats. If this district were still in place, our unofficial calculations have Biden carrying it by about 100 votes. But Tillis’ 4.5% margin there represents something of a reversion — in Map 4, note that there are fewer blue precincts in Mecklenburg County on Tillis’ map.
Map 4: Last decade’s NC-9 in 2020
Once results are finalized, we’ll have much more to say about what happened down the ballot and how many Trump-district Democrats and Biden-district Republicans were elected. But just as in 2016, it appears that with Trump on the ballot, Republicans running in House and Senate races often ran ahead of the president.
Kyle Kondik is a Political Analyst at the Center for Politics at the University of Virginia and the Managing Editor of Sabato's Crystal Ball.
J. Miles Coleman is an elections analyst for Decision Desk HQ and a political cartographer. Follow him on Twitter @jmilescoleman.
See Other Political Commentary by Kyle Kondik.
See Other Political Commentary by J. Miles Coleman.
See Other Political Commentary.
This article is reprinted from Sabato's Crystal Ball.
Views expressed in this column are those of the author, not those of Rasmussen Reports. Comments about this content should be directed to the author or syndicate.
Rasmussen Reports is a media company specializing in the collection, publication and distribution of public opinion information.
We conduct public opinion polls on a variety of topics to inform our audience on events in the news and other topics of interest. To ensure editorial control and independence, we pay for the polls ourselves and generate revenue through the sale of subscriptions, sponsorships, and advertising. Nightly polling on politics, business and lifestyle topics provides the content to update the Rasmussen Reports web site many times each day. If it's in the news, it's in our polls. Additionally, the data drives a daily update newsletter and various media outlets across the country.
Some information, including the Rasmussen Reports daily Presidential Tracking Poll and commentaries are available for free to the general public. Subscriptions are available for $4.95 a month or 34.95 a year that provide subscribers with exclusive access to more than 20 stories per week on upcoming elections, consumer confidence, and issues that affect us all. For those who are really into the numbers, Platinum Members can review demographic crosstabs and a full history of our data.
To learn more about our methodology, click here.
