How the Other Half Votes: The United States, Part Two
A Commentary By Kyle Kondik
Trend from 1996-2020 shows a much larger partisan gap between bigger and smaller counties, with 2000 and 2016 as key contributors.
KEY POINTS FROM THIS ARTICLE
— The presidential voting gap between the nation’s most populous counties and the rest of the nation has nearly tripled from 1996 to 2020.
— The 2000 and 2016 elections were the biggest contributors to this gap.
— While there is nearly a 40-point difference between the top and bottom halves, the gap did not grow from 2016-2020.
Top vs. bottom halves, 1996-2020
Among the many things that stand out from a longer-term look at how the nation’s biggest counties vote versus the rest of the country is this: The George W. Bush realignment of 2000 was comparable to the Donald Trump realignment of 2016 in widening the gap between the nation’s two halves.
As part of our ongoing series in comparing the “top halves” to the “bottom halves” of both the nation and individual states, we decided to expand our look at the nation to encompass not just the changes between 2012 and 2020 — which we did in Part One of this series — but also the trajectory of the last quarter century, from Bill Clinton’s second victory in 1996 to Joe Biden’s win in 2020. As a reminder, what we are doing in this series is adding up a state’s or, in this case, the nation’s largest counties until we get to half of the total votes cast. That group of counties becomes the top half, and then whatever is left becomes the bottom half. Based on the number of votes cast in 2020, 151 of the nation’s 3,100+ counties or county equivalents make up the top half of the nation as a whole. We used these counties as the top half for all the other elections we looked at, even though the list would be a bit different the further back one goes. All of the remaining counties — plus the entire state of Alaska as well as the District of Columbia, which do not have county equivalents for the purposes of the exercise — make up the bottom half. While there are plenty of well-populated counties in the so-called bottom half, this is a loose approximation of the nation’s urban versus rural divide. The presidential voting divide between the top half and bottom half has dramatically expanded since the late 1990s. As a refresher, we have listed all of the top half counties at the bottom of this article, and see past editions of this series for more detail on both the nation as a whole and a variety of different states.
Before we go election by election to track the changes, let’s look at how the gap between the halves has grown since 1996. In that year, Bill Clinton won by 8.5 points nationally. He won the top half counties by 15.7 percentage points, and he won the bottom half by a smaller, 1.8-point margin. That means the difference between the two was 13.9 points. This difference would grow, as shown in Figure 1 and Table 1: By 2020, the difference between the top and bottom halves was 39.2 points — nearly triple that of 1996.
Figure 1 and Table 1: Gap between top and bottom halves, 1996-2020
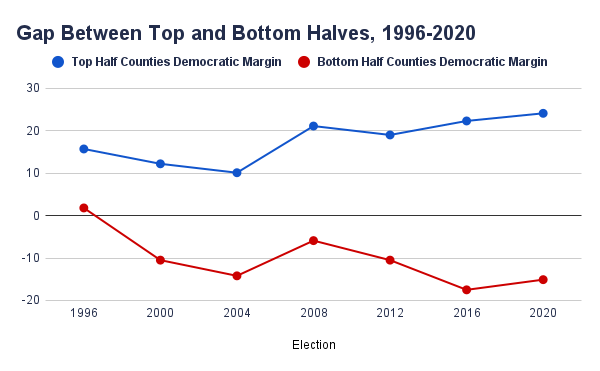
Note: Figure 1 by Carah Ong Whaley
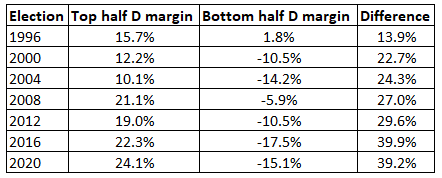
Note that there are two large jumps in the difference between the halves: A big jump from 2012 to 2016 of a little more than 10 points, and a smaller but still significant jump from 1996 to 2000 of close to 9 points.
Let’s start with the changes from 1996 to 2000 and move up to the present day.
Table 2: Top half versus bottom half, 1996-2000
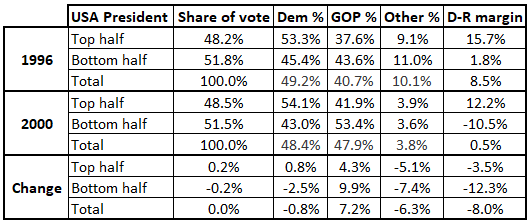
The last election of the 20th century featured an election that was very much like many others before it but unlike almost all of the other elections since: a blowout. While Bill Clinton did not score a double-digit win in the national popular vote — which had been fairly common in the 20th century — he did triumph by 8.5 points nationally. Of the 21st century elections, only Barack Obama’s 2008 victory rivals the size of Clinton’s 1996 win, but it still was a bit more modest — Obama finished behind in his popular vote margin, 7.3 points to Clinton’s 8.5, as well as in his Electoral College tally, 365 to Clinton’s 379.
Clinton is the last Democrat to win the bottom half, albeit by a small, roughly 2-point margin, while he won by nearly 16 in the top half. This election also featured the largest third party share of any election we’ll look at in this article: about 10% of the electorate voted third party. Ross Perot, the populist businessman who in some ways was a precursor to Donald Trump, took the bulk of that support at 8.4% nationally, although that was down about 10 points from the larger national share he won in 1992. Consumer advocate and Green Party nominee Ralph Nader, making the first of what would be four consecutive presidential bids, won seven-tenths of the vote. Notice that the third party share was 2 points higher in the bottom half than the top half in 1996. The much smaller but still important third party share in 2000 would see that imbalance largely even out, although the third party vote was slightly higher in the top half in 2000, perhaps indicating the negative impact Nader had on Al Gore’s narrowly unsuccessful bid for a third-straight Democratic presidential win that year (in 2000, Nader got a little under 3% of the national vote, as a little under 4% of the nation voted for a non-major party candidate). It may also be that more of the Republican vote was parked in the Perot column in 1996 and that a number of those voters “came home” in 2000.
In terms of a share of the popular vote, Gore’s share in the top half counties was actually a little bit higher than Clinton’s (54.1% compared to Clinton’s 53.3%), but the Democratic top half margin dropped 3.5 points from 1996 to 2000 in the midst of lower third-party voting. But the thing that really undid Gore — and aided his opponent, George W. Bush — was a roughly dozen-point drop in margin in the bottom half counties. This improvement for Bush in many less-populated places contributed to huge Republican swings in some Clinton-won states, such as Clinton’s home state of Arkansas, Louisiana to its south, and West Virginia, which are some of the states that do not have a single county (or parish in the case of Louisiana) in the national top half of counties. These states have not voted Democratic for president since 1996. Because Bush’s victory was overshadowed by the post-election legal battle over Florida, it’s easy to lose sight of the fact that Bush’s 2000 election represented a stark widening of the divide between the nation’s most populous counties and the rest of the nation — almost as stark as the Trump effect a decade and a half later.
Table 3: Top half versus bottom half, 2000-2004
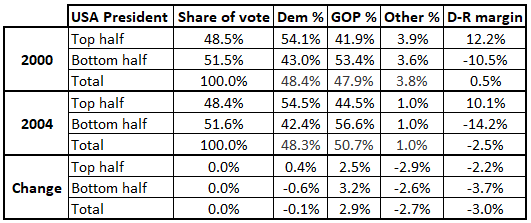
Like Trump in 2016, Bush won the Electoral College despite losing the popular vote. Bush would win a clearer victory in 2004, becoming the only Republican since his father’s victory in 1988 to win the national popular vote. Bush did this by performing a little bit better than he had in 2000 in both the top and bottom halves, although John Kerry still captured the top half counties by 10 points. In the wake of Bush’s victory, Republicans were often credited with a superior turnout operation in an election where overall turnout shot up after the relatively sleepy elections of 1996 and 2000. One subtle indication of strong GOP turnout in this table is that the redder bottom half share of the electorate actually increased ever so slightly from 2000 to 2004 — the difference is so small that it’s obscured on the table by rounding. The top half share has otherwise generally gotten larger from election to election.
The perceived high stakes for 2004 were evidenced by the very low third party share (just 1% of the total votes cast). That’s the lowest total in this timeframe.
Table 4: Top half versus bottom half, 2004-2008
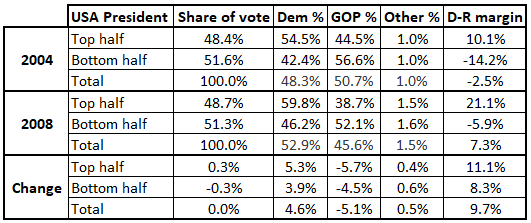
In scoring the biggest victory of the 2000s, Barack Obama improved Democratic fortunes from 2004 in much of the country, although his top half improvement was better than his bottom half improvement. Amidst another low third-party vote, Obama’s bottom half share was actually a little bit better than Bill Clinton’s in 1996, although Obama still lost the bottom half by 6 points to John McCain as the third party vote was much smaller.
Obama pushed the Democrats’ top half margin to a little over 20 points, markedly higher than what it had been in the 1996-2004 time period. This change would endure in the next three elections.
Table 5: Top half versus bottom half, 2008-2012
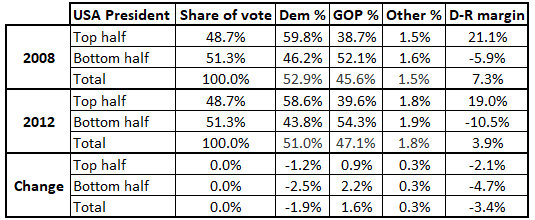
Obama’s national margin was nearly halved from 2008 to 2012, going from 7.3 points to 3.9. But the drop was bigger in the bottom half than the top half. Meanwhile, the gap between the top and bottom halves continued to grow, but only at a relative snail’s pace: The gap grew more from 1996 to 2000 than it did from 2000 to 2012. But 2016 would represent another significant widening of that gap.
Table 6: Top half versus bottom half, 2012-2016
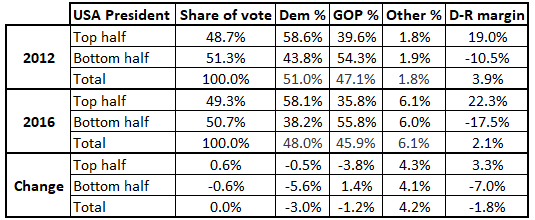
As some Americans recoiled at major party nominees Hillary Clinton and Donald Trump, the third party vote roughly tripled from 2012 (going from about 2% to about 6%), although there was hardly any difference in third party performance between the top and bottom halves. Despite a popular vote margin just half that of Obama’s in 2012, Clinton’s top half margin was about 3 points better than Obama’s. However, Trump’s appeal in the much more rural/small town-oriented bottom half was better than previous GOP nominees, as his 17.5-point margin surpassed even Bush’s 14.2-point margin from 2004. The net result was a 10-point expansion in the difference between the two halves, pushing the gap to about 40 points. Trump won the Electoral College despite a jump of about half a point in the share of votes cast by the hostile (to him) top half counties.
Table 7: Top half versus bottom half, 2016-2020
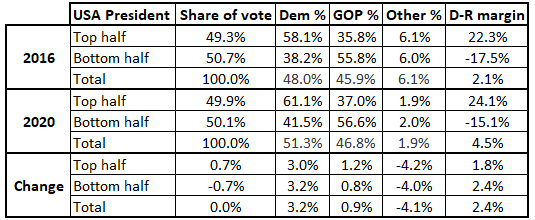
Biden won back the White House for the Democrats in 2020 by adding to their top half edge but, perhaps more importantly, cutting their bottom half deficit. The Biden improvement was slightly better in the bottom half counties by change in margin, and the top half also saw its share of the total vote reach almost exact parity with the bottom half. Interestingly, this is also the first instance in our analysis where the top half versus bottom half gap did not grow — instead, the gap contracted very modestly (by less than a point from 2016-2020). The third party vote decreased back to about 2% of the electorate, and there was hardly any difference between the two halves in terms of third party share. In both halves, Biden’s share of the vote improved about 3 points compared to what Hillary Clinton won, while Trump gained about 1 point from his own shares in 2016.
Conclusion
The counties that make up the top half of the electorate have been growing, although their change in the share of the electorate has been modest over the past quarter century, going from a little over 48% in 1996 to roughly 50% now. We thought the change might be larger over that timeframe, although it’s worth noting that while the top half does contain some fast-growing places, a number of the smaller entities in the bottom half are also growing. For instance, all of the nation’s 10 fastest-growing counties from 2021-2022 are part of the bottom half (per the U.S. Census Bureau).
This analysis also confirms that while the 2012-2016 period represents the biggest single contributor to the widening top half versus bottom half gap, the 1996-2000 period also merits mention as a key contributor.
Broadly speaking, this method of analyzing the electorate is another way to show the wider chasm between the nation’s largest counties and the rest of the country. In 1996, there was only a 14-point gap between them; now, the gap is nearly 40 points. An important aspect of Biden’s victory was arresting the widening of this gap — given how close the margins were in the decisive Electoral College states, it’s possible that Biden would have lost the Electoral College in 2020 had this gap continued to expand. As it was, Trump ran behind his 2016 margin in many bottom half counties in places like eastern Pennsylvania, northern Michigan, and northern Georgia. A recent focus of election analysis, most recently by Nate Cohn in the New York Times, has been Biden’s polling troubles with nonwhite voters, a Democratic-leaning group that may not be quite as Democratic as it used to be. Given the diverse electorates in some of the nation’s most populous counties, if Biden maintains his support with white voters but loses ground with nonwhite voters, that could have the effect of again reducing this top half versus bottom half chasm.
P.S. The list of top half counties
Counties are listed by state, and in order of size within states based on number of votes cast. The cutoff point for inclusion in the top half was slightly over 230,000 votes cast in the 2020 presidential election. Our source for all data in this article is Dave Leip’s Atlas of U.S. Presidential Elections:
Alabama: Jefferson
Arizona: Maricopa, Pima
California: Los Angeles, San Diego, Orange, Riverside, Santa Clara, San Bernardino, Alameda, Sacramento, Contra Costa, San Francisco, Ventura, San Mateo, Fresno, Kern, San Joaquin, Sonoma, Placer
Colorado: Denver, El Paso, Jefferson, Arapahoe, Adams
Connecticut: Fairfield, Hartford, New Haven
Delaware: New Castle
Florida: Miami-Dade, Broward, Palm Beach, Hillsborough, Orange, Pinellas, Duval, Lee, Brevard, Polk, Volusia, Pasco, Sarasota, Seminole
Georgia: Fulton, Gwinnett, Cobb, DeKalb
Hawaii: Honolulu
Idaho: Ada
Illinois: Cook, DuPage, Will, Lake, Kane
Indiana: Marion
Iowa: Polk
Kansas: Johnson
Kentucky: Jefferson
Maryland: Montgomery, Prince George’s, Baltimore County, Anne Arundel, Baltimore City
Massachusetts: Middlesex, Worcester, Essex, Norfolk, Suffolk, Plymouth, Bristol
Michigan: Wayne, Oakland, Macomb, Kent
Minnesota: Hennepin, Ramsey, Dakota
Missouri: St. Louis County (St. Louis City is a different and smaller entity), Jackson
Nebraska: Douglas
Nevada: Clark, Washoe
New Hampshire: Hillsborough
New Jersey: Bergen, Monmouth, Middlesex, Essex, Ocean, Morris, Camden, Burlington, Union, Hudson
New Mexico: Bernalillo
New York: Kings, Queens, Suffolk, Nassau, New York, Erie, Westchester, Bronx, Monroe, Onondaga
North Carolina: Wake, Mecklenburg, Guilford
Ohio: Franklin, Cuyahoga, Hamilton, Summit, Montgomery
Oklahoma: Oklahoma, Tulsa
Oregon: Multnomah, Washington, Clackamas
Pennsylvania: Philadelphia, Allegheny, Montgomery, Bucks, Delaware, Chester, Lancaster, York
Rhode Island: Providence
South Carolina: Greenville
Tennessee: Shelby, Davidson
Texas: Harris, Dallas, Tarrant, Bexar, Travis, Collin, Denton, Fort Bend, Williamson, Montgomery, El Paso
Utah: Salt Lake, Utah
Virginia: Fairfax
Washington: King, Pierce, Snohomish, Spokane, Clark
Wisconsin: Milwaukee, Dane, Waukesha
NO COUNTIES IN TOP HALF: Alaska, Arkansas, District of Columbia, Louisiana, Maine, Mississippi, Montana, North Dakota, South Dakota, Vermont, West Virginia, Wyoming
Kyle Kondik is a Political Analyst at the Center for Politics at the University of Virginia and the Managing Editor of Sabato's Crystal Ball.
See Other Political Commentary by Kyle Kondik.
See Other Political Commentary.
Views expressed in this column are those of the author, not those of Rasmussen Reports. Comments about this content should be directed to the author or syndicate.
Related Articles

Rasmussen Reports is a media company specializing in the collection, publication and distribution of public opinion information.
We conduct public opinion polls on a variety of topics to inform our audience on events in the news and other topics of interest. To ensure editorial control and independence, we pay for the polls ourselves and generate revenue through the sale of subscriptions, sponsorships, and advertising. Nightly polling on politics, business and lifestyle topics provides the content to update the Rasmussen Reports web site many times each day. If it's in the news, it's in our polls. Additionally, the data drives a daily update newsletter and various media outlets across the country.
Some information, including the Rasmussen Reports daily Presidential Tracking Poll and commentaries are available for free to the general public. Subscriptions are available for $4.95 a month or 34.95 a year that provide subscribers with exclusive access to more than 20 stories per week on upcoming elections, consumer confidence, and issues that affect us all. For those who are really into the numbers, Platinum Members can review demographic crosstabs and a full history of our data.
To learn more about our methodology, click here.