How the Other Half Votes: Manchin and Tester’s Challenge
A Commentary By Kyle Kondik
Democratic Senate coalitions in red presidential states Montana and West Virginia.
KEY POINTS FROM THIS ARTICLE
— Sens. Joe Manchin (D-WV) and Jon Tester (D-MT) are outliers in Congress — no other Senate or House member holds a state/district that is more hostile to his or her party at the presidential level than this pair.
— Montana and especially West Virginia are deeply Republican at the presidential level, and while Manchin and Tester have clearly run way ahead of Democratic presidential performance in recent years, changes at the presidential level are reflected in their own coalitions.
Other halves in Montana and West Virginia
Later today, Gov. Jim Justice (R-WV) is expected to announce his candidacy for the Senate seat held by Sen. Joe Manchin (D-WV). The popular governor, who was elected as a Democrat in 2016 but quickly switched to the Republicans after taking office, gives Republicans a top recruit in the race. However, Justice first has to advance through a primary, which already features another prominent candidate, Rep. Alex Mooney (R, WV-2), who will run to Justice’s right with the support of the conservative Club for Growth.
Manchin has yet to announce his decision on whether to run again. We feel like Republicans have the advantage in this race whether Manchin runs or not. This has less to do with Manchin himself and more to do with immense shifts in West Virginia toward the Republicans. Manchin would have a fighting chance if he runs owing to his successful past track record; if the seat is open, Democrats essentially have no chance to hold it.
No other senator represents a state nearly as hostile to his party as Manchin does. Donald Trump won West Virginia by 39 points in 2020. There are only 4 other senators who represent states their party didn’t win for president in 2020, and the only other senator who holds a seat that their party lost by a double-digit margin was Sen. Jon Tester (D-MT) — Trump won his state by 16 points. In the House, no member holds a district that their party lost by 15 or more points for president. That makes Tester an outlier in either chamber of Congress — and Manchin an extreme outlier.
West Virginia was once reliably Democratic. It was 1 of just 4 states — the others being Hawaii, Minnesota, and Rhode Island — along with the District of Columbia to vote for both Jimmy Carter in his unsuccessful reelection bid in 1980 as well as Michael Dukakis in his big loss to George H.W. Bush in 1988’s open-seat presidential contest. The state went more than a half-century without electing a Republican to the Senate until now-Sen. Shelley Moore Capito (R-WV) broke through to replace the retiring Jay Rockefeller (D) in 2014. That same year, long-serving Rep. Nick Rahall (D, WV-3) was unseated, leaving Manchin as the only Democrat in the state’s congressional delegation, a lonely position Manchin still holds.
The state had already drifted far away from Democrats before Donald Trump entered the political arena, and Trump’s appeal to white voters who do not hold a 4-year college degree made him an electoral powerhouse in the Mountain State, perhaps the quintessential “white working-class” state. And yet, despite this, Manchin did win in 2018 even after the Trump revolution in the state. Tester also won in a state that has been reliably Republican for president for decades but is historically more competitive down the ballot (Tester has already announced his reelection bid). Those 2 Senate seats are on the ballot this cycle, concurrent with the presidential race. In order to win, each will have to run very substantially ahead of the Democratic presidential nominee.
What follows is a look at these pair of Democratic senators in Trump-won states who are up for reelection in 2024. We are going to use the “other half” analysis we’ve used in a few other recent articles to look at how these states have voted for president in recent years as well as how these 2 senators have performed in their recent elections. To recap our process, what we’re doing here is identifying the biggest sources of votes in a state that add up to roughly 50% of the vote, and then comparing those counties, collectively, to the rest of the state. The “top halves” of states — the bigger counties that collectively cast half the votes — are more Democratic than the bottom halves, we have found, and the partisan gap between the halves has generally been increasing in the states we’ve looked at.
We’ll explore how both states vote for president as well as how Tester and Manchin have won in recent years. For Tester, we are comparing his 2012 and 2018 elections, which were his second and third Senate victories (he won his first term in 2006 by a 1-point margin, whereas he won by about 3.5 points in his subsequent victories). For Manchin, we’ll look at his initial election — a 2010 special election that he won by about 10 points — as well as his 2018 reelection by about 3 points (Manchin won in a blowout in 2012, so we decided to compare 2010 and 2018 instead because the topline results were more similar). For the presidential results, we’re comparing 2012 to 2020, just like we have in previous installments of this series.
The maps below were made in Dave’s Redistricting App, with the counties in orange representing the “top half.” The results are from Dave Leip’s Atlas of U.S. Presidential Election (the site has Senate and gubernatorial results in addition to presidential tallies).
With that, let’s take a look at West Virginia and Montana and how they have voted for president — and for Manchin and Tester — in recent years.
WEST VIRGINIA
Map 1: West Virginia top half counties
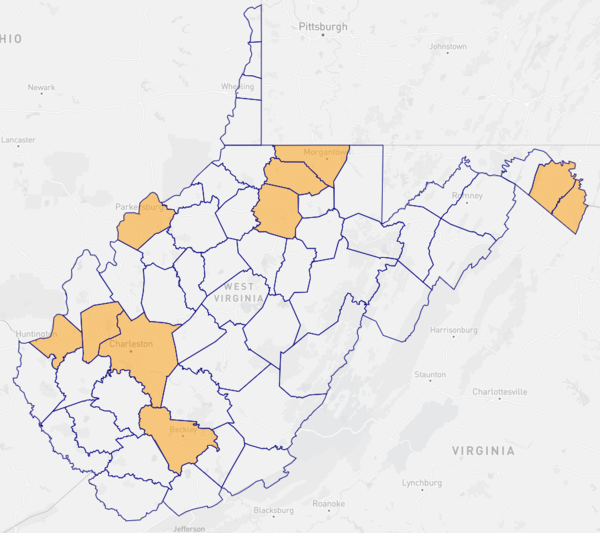
Table 1: West Virginia presidential voting, 2020 vs. 2012
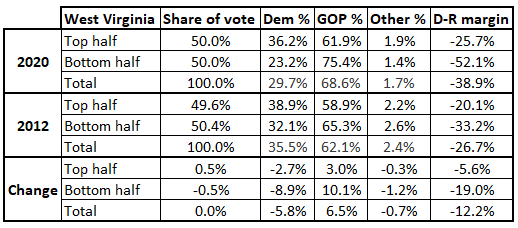
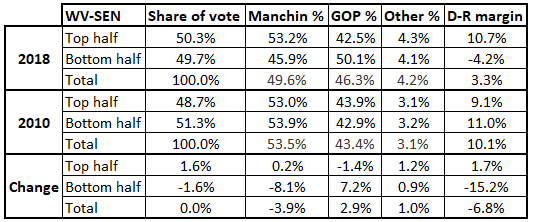
Table 2: West Virginia Senate voting, 2018 vs. 2010
Top half counties that make up half the statewide vote: West Virginia’s biggest single source of votes, Kanawha County (Charleston), cast 10% of the statewide vote in 2020. Also in the top half are Putnam to Kanawha’s west, and Cabell (Huntington) another county over, along with Raleigh (Beckley) to Kanawha’s south. The eastern West Virginia panhandle has essentially become a Washington, D.C. exurban area, and Berkeley (Martinsburg) and Jefferson are the biggest vote sources there (Jefferson is the tip of the panhandle and contains both the city of Charles Town as well as Harpers Ferry, home of John Brown’s famous raid before the Civil War). Monongalia (Morgantown and West Virginia University) sits in north central West Virginia along the Pennsylvania border, and its neighbor, Marion, contains Manchin’s hometown of Farmington. To Marion’s south is Harrison (Clarksburg), and the final county that makes up the top half is Wood (Parkersburg), which lies across the Ohio River from southeast Ohio.
Bottom half counties that make up the other half of the statewide vote: The remaining 45 counties. Both Barack Obama in 2012 and Joe Biden in 2020 (as well as Hillary Clinton in 2016) lost every single county in the state.
There is obviously a huge difference between how Democratic presidential candidates have fared in West Virginia lately compared to how Manchin has fared, although the overall trends afflicting Democrats in the state are hurting Manchin, too, which should give Republicans some confidence that they could unseat him if he does seek another term.
In presidential politics, both halves of West Virginia are of course deeply Republican. But the same growing gap between top half and bottom half that we have seen in many other states is present in the Mountain State, too. Notice that in the 2012 presidential race, Obama’s net showing in the bottom half was 13 points worse than his showing in the top half. By 2020, the difference in the halves had doubled, as the bottom absolutely fell out for Biden in the bottom half — he lost that group of counties by more than 50 points.
A key driver has been the Democratic collapse in ancestrally Democratic southern West Virginia, a region known for coal mining. Mingo County — dubbed “Bloody Mingo” for violent clashes between coal miners and agents working for the mine owners a century ago — exemplifies the trends. As recently as 2004, John Kerry won the county by 13 points. By 2020, Mingo voted for Trump by 71 points. Appearing on the same ballot as Kerry, Manchin won the first of 2 terms as governor (he left midway through his second term when he won his Senate seat). Manchin won Mingo by 66 points in 2004, 59 in 2008, 37 in his 2010 Senate bid, and 47 in his 2012 reelection romp. But Manchin then lost Mingo by 13 points in 2018. Remember that Manchin’s most recent election came during a Democratic-leaning electoral environment nationally and Manchin was not on the same ballot with a presidential race (this is the same basic problem for Tester, although his state is not nearly as red).
Note that in comparing Manchin’s 2010 and 2018 showings, the top and bottom halves voted very similarly in 2010, with Manchin actually running a little better in the bottom half than the top.[1] But by 2018, Manchin was losing the bottom half but doing slightly better in the top half, at least compared to 2010. Manchin did worse in the lion’s share of the state’s counties, but he did do markedly better in 2018 in Charleston’s Kanawha, winning it by 26 points, double his 2010 margin. If one assumes Manchin will do worse in the rapidly reddening lower half counties in 2024 if he runs — and that seems like a fair assumption — he’ll need to do better in the top half to compensate. One of the other places where Manchin did better in 2018 than 2010 was Morgantown’s Monongalia — given trends across the country, it’s no shock that a Democrat would be improving his performance in a county anchored by a major college town. In fact, Monongalia was the only county in the state where Manchin ran ahead of his 2012 performance in 2018 (he won statewide by 24 points in 2012, much larger than his 10-point 2010 margin). Monongalia is the only county in the state that could potentially vote Democratic for president in 2024: Trump won by about a point, whereas he won every other county by double digits. Regardless, it seems like Manchin is going to need to compensate for bottom half losses with top half gains if he’s going to survive (and, again, that’s assuming he runs at all).
MONTANA
Map 2: Montana top half counties
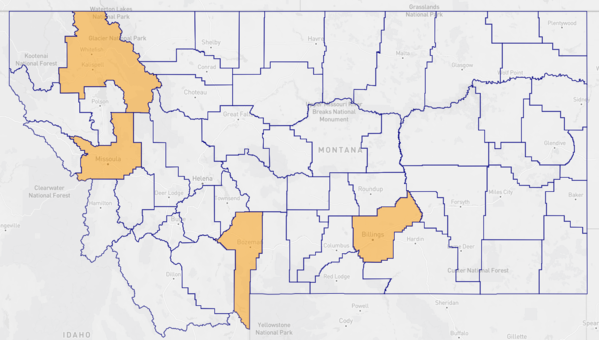
Table 3: Montana presidential voting, 2020 vs. 2012
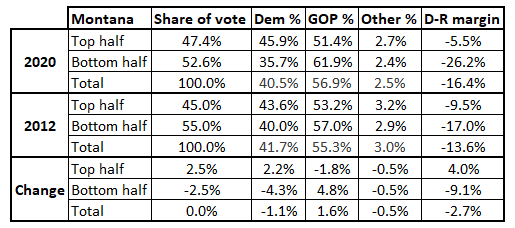
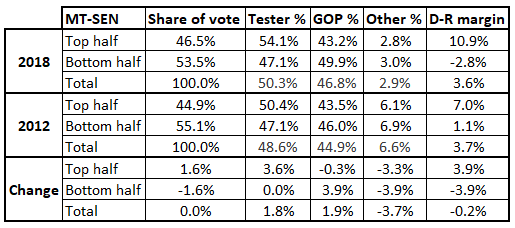
Table 4: Montana Senate voting, 2018 vs. 2012
Top half: Just 4 of the state’s 56 counties, although here the “top half” is a couple of percentage points shy of half the statewide vote. Yellowstone (Billings) in the south/central part of the state cast about 14% of the statewide vote, followed by Missoula (home of the University of Montana) in the western center of the state, Gallatin (Bozeman) in the southeast, and Flathead (Kalispell) north of Missoula. Both Flathead and Yellowstone are strongly Republican in presidential elections — Lyndon Johnson was the last Democrat to carry either. Missoula, another college county, has trended Democratic in recent years; so too has Gallatin, which did not vote for Obama in 2012 but did back Biden in 2020. Bozeman has become a hub for expats of other states (including California) in recent years, which likely has something to do with the political change; Gallatin County also has a high 4-year college attainment rate, just like many other places that have trended Democratic in recent years.
Bottom half: The remaining 52 counties. Biden carried just 5 of them while Obama carried 7. The state has something of a western versus eastern political split, which is demonstrated in the state’s 2 congressional districts (the state had 2 districts prior to the 1990 census, and then gained the district back in the 2020 census). Under the new lines, the western district (MT-1, which covers about a third of the state, give or take) voted for Trump by 7 points, while the geographically more expansive MT-2 voted for him by 27 points.
At the presidential level, we again see a widening gap between top and bottom halves in Montana. Mitt Romney and Donald Trump each won both halves of the state in 2012 and 2020, respectively, but the gap between the halves expanded in 2020, to the overall benefit of Trump, who did a few points better in the state than Romney thanks to improvement in the bottom half. We see the same trend for Tester, who won by almost the exact same margin in 2012 and 2018: He won both halves in 2012 but only the top half (by a larger margin) in 2018.
A major focus of county-level presidential analysis in the Trump era has been the Democratic decline in white working-class hubs in the electorally competitive Industrial North/Midwest — think places like Youngstown, Scranton, several parts of the so-called “Driftless Area” in Illinois, Iowa, Minnesota, and Wisconsin, etc. But outside this region, we can find similar kinds of places where longstanding Democratic allegiance has eroded in recent years.
In Montana, look at Silver Bow (Butte) and its smaller neighbor, Deer Lodge (Anaconda), in southeast Montana. Both have strong Democratic lineage dating back to at least the Great Depression (which is true of some of the other places we previously mentioned) and cover historic mining territory. The Depression-era Federal Writers’ Project volume on Butte dubbed it “the World’s Greatest Mining Town,” although mining there is now mostly an industry of the past. Tellingly, both counties cast more votes back in the Depression era than they do now (that’s also true of the aforementioned Mingo County in West Virginia). Obama won both Montana counties in 2012 by a little over 30 points, but Biden’s margin in each was cut by more than half: He won Silver Bow by 14 and Deer Lodge by just 8.
Tester, meanwhile, maintained landslide margins in each county in 2018: He actually did slightly better in the more populous Silver Bow in 2018 compared to 2012 (46 points, up from 45), and while he dipped in Deer Lodge (46 points to 40), his margin was still robust. These are not huge components of the statewide vote — combined, they were just 4% of the statewide presidential tally in 2020 — but we think they merit watching for Tester. As the incumbent will likely need to run something like 15-to-20 points ahead of the presidential ticket to win, look and see how much better Tester does there.
Beyond that, Tester will of course need to run ahead of the presidential ticket across the state as well. For instance, while the state’s most populous county, Yellowstone, voted for Trump by 24 points, Tester only lost it by about 3.5 points, a roughly 20-point difference that was similar to Tester’s overall overperformance in 2018 of Biden’s eventual 16.5-point statewide loss in 2020.
One other wrinkle in Montana, which our friend Jacob Smith discovered a few years ago, is that it is very common for the incumbent president to do worse in Montana than he did in his first election, even if he is being reelected nationally. If that tradition holds, Biden would be doing worse in Montana than he did in 2020, which would also force Tester to secure more crossover support to win.
Conclusion
While Manchin and Tester have clearly done a lot better than their party’s presidential nominees in their states in recent years, their own coalitions are not immune to the trends we are seeing at the presidential level. The top halves of their states moved toward them recently, but the bottom halves have moved away. Clearly they both need a lot of crossover support from Republican presidential voters to win, particularly Manchin — crossover support that often has been harder to come by for candidates across the country in recent years.
[1] Though it is not included in the table, Manchin’s larger 2012 win actually featured a bluer bottom half than top half, with Manchin winning the former by 26 points and the latter by 23.
Kyle Kondik is a Political Analyst at the Center for Politics at the University of Virginia and the Managing Editor of Sabato's Crystal Ball.
See Other Political Commentary by Kyle Kondik.
See Other Political Commentary.
Views expressed in this column are those of the author, not those of Rasmussen Reports. Comments about this content should be directed to the author or syndicate.
Related Articles

Rasmussen Reports is a media company specializing in the collection, publication and distribution of public opinion information.
We conduct public opinion polls on a variety of topics to inform our audience on events in the news and other topics of interest. To ensure editorial control and independence, we pay for the polls ourselves and generate revenue through the sale of subscriptions, sponsorships, and advertising. Nightly polling on politics, business and lifestyle topics provides the content to update the Rasmussen Reports web site many times each day. If it's in the news, it's in our polls. Additionally, the data drives a daily update newsletter and various media outlets across the country.
Some information, including the Rasmussen Reports daily Presidential Tracking Poll and commentaries are available for free to the general public. Subscriptions are available for $4.95 a month or 34.95 a year that provide subscribers with exclusive access to more than 20 stories per week on upcoming elections, consumer confidence, and issues that affect us all. For those who are really into the numbers, Platinum Members can review demographic crosstabs and a full history of our data.
To learn more about our methodology, click here.