What Fairer House Maps in One-Party Delegation States Could Look Like
A Commentary By J. Miles Coleman
KEY POINTS FROM THIS ARTICLE
— The recent mid-decade redistricting developments have prompted a debate about proportionality and representation in the House.
— There are several states across the country where either party lacks representation in the House even as its candidates routinely take a sizable minority share of the vote in statewide elections.
— Redistricting could yield more equitable House delegations in those states, although in many cases, it is hard to get a party’s share of the vote exactly in line with its seat count.
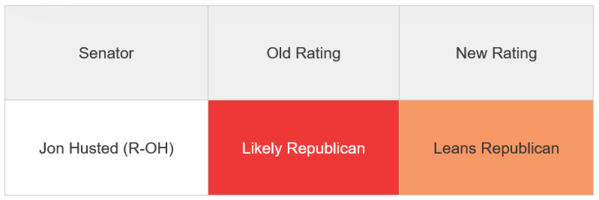
— In Ohio, former Sen. Sherrod Brown’s (D) entrance into the 2026 Senate race against appointed Sen. Jon Husted (R) has prompted us to move the race from Likely Republican to Leans Republican.
More competitive maps in one-party delegation states
As the mid-decade redistricting “arms race” has heated up in recent weeks, much of the attention has focused on larger states, like Texas and California. This has not been without good reason, as the leaders of both states have insisted that they will pass new maps before next year’s midterms.
One point that has come up during the redistricting debate has to do with proportionality. In other words, in many gerrymandered states, the minority party’s share of House seats is below its share of the vote. In Texas, for instance, Kamala Harris took 43% of the statewide two-party vote but Democrats hold 34% of its House seats (13 of 38)—if Republicans’ proposed new map takes effect and works as intended, the share of seats held by House Democrats would fall to 21%. In California, the gap is wider, even as the state currently has a commission-drawn map: Republicans hold 17% of the state’s House seats (9 of 52) even though Donald Trump took 40% of the statewide vote there in 2024.
With this in mind, there are several states across the country where the minority party is completely shut out of the state’s House delegation even as it sometimes takes a respectable share of the statewide vote. How possible would it be to draw maps in these states that are at least a little more reflective of that statewide partisan balance?
In what follows, we’ve focused on 8 such states that have one-party representation in the House. On the Democratic side, the list includes Massachusetts, Connecticut, and New Mexico while the Republican states are Oklahoma, Arkansas, Iowa, Nebraska, and Utah. All 8 states are smaller—none has more than 10 districts—although, for the sake of length, we’ve excluded states that have fewer than 3 districts. While Republicans have more states on our list, the number of districts that their states account for, 20, is only a little more than the 17 districts in those all-Democratic states.
Finally, before we get into the actual list of states, we would like to thank Dave’s Redistricting App and Redistricter, as this article relies heavily on data and maps generated from both sites.
MASSACHUSETTS
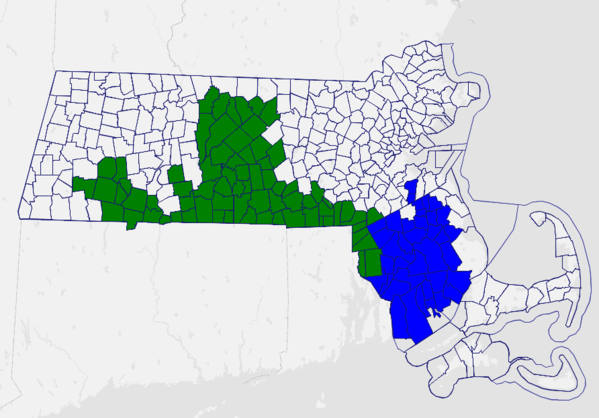
Massachusetts is the largest state with a one-party congressional delegation. Though Democrats occasionally have had some close calls—a Cape Cod-area district saw a competitive open-seat race in 2010 and then-Rep. John Tierney’s (D, MA-6) ethics issues gave Republicans an opening in 2012—they have retained all of the state’s seats since the 1996 elections.
But, what would a district designed to elect a Republican look like? Map 1 shows a hypothetical map that features two districts that each backed Trump by less than a percentage point in 2024. Combining the reddest parts of each could produce a single seat that Trump carried by mid-single digits. For Map 1, the author kept municipalities whole, although the actual map splits several, and it would be possible to draw districts that are a little bit redder by splitting towns.
Map 1: Possible Republican-leaning districts in Massachusetts
CONNECTICUT
Going south, Connecticut dropped from 6 seats to 5 as a result of the 2000 census. Since then, court-approved maps have only lightly modified the lines that a bipartisan commission originally drew. Though Democrats have had complete control of the state’s delegation since the 2008 elections, such a result was not the intention when the map was conceived ahead of 2002.
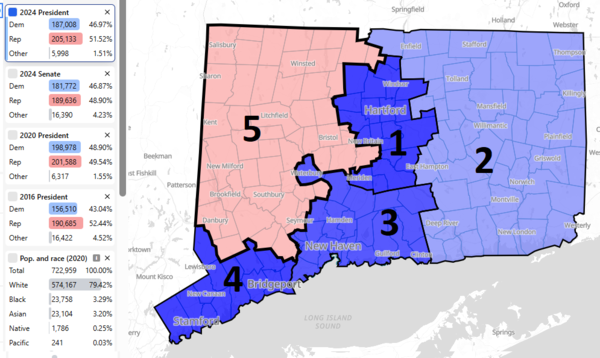
The most marginal district on the current map is the 5th District, which connects much of the Naugatuck Valley, as well as the northwestern corner of the state, to some cities that are closer into the state capital region. Per the Almanac of American Politics, the current configuration of CT-5 was designed to be a “fair fight” district. Elsewhere on the map, either party had two relatively firm seats, so the intent of the mappers during that post-2000 redistricting cycle seemed to be for a “2-2-1” map.
In any case, the then-new CT-5 pitted Reps. Nancy Johnson (R) and Jim Maloney (D) into a contest where the former won. Johnson herself was defeated in 2006 by now-Sen. Chris Murphy (D-CT) as part of the anti-George W. Bush wave that year. But, even as the state’s delegation has remained all-Democratic since the Obama era, CT-5 remains the closest thing to a “fair fight” district that the state has: when Murphy moved to the Senate, in 2012, Republicans came within 3 points of flipping the seat—a decade later, current Rep. Jahana Hayes (D) was reelected by 2,000 votes in one of 2022’s closest House races. Hayes won a rematch last year by a more comfortable 7-point margin.
Though there are some other deep blue towns in the district, New Britain’s presence in CT-5 has proved ironic. As the aforementioned Johnson’s hometown, it was put into the district for 2002. While it gave Johnson a narrow majority that year—and she kept it close as part of her 2004 reelection result—it has worked against Republicans since then. In both those 2012 and 2022 races, New Britain more than accounted for the Democratic nominees’ margins of victory. With that in mind, Map 2 creates a relatively compact, and Republican-leaning, version of CT-5. The iteration below gave Trump a 51%-47% margin last year, and it would have narrowly voted against both Biden in 2020 and Murphy in last year’s Senate race. Compared to the actual district, this proposed CT-5 gives New Britain to the deeply blue CT-1, hands Waterbury, another blue city, to CT-3, and goes south to pick up more red-leaning towns in the Naugatuck Valley.
Map 2: Connecticut with Trump-won CT-5
While it would be possible to draw a second-Trump won district in the state, it would probably involve some less logical lines. Essentially, the trick would involve packing CT-1, giving CT-3 almost all of the state’s eastern coastline, and dividing some redder interior towns between CT-2 and CT-5. Even without such a gerrymander, Republicans could have had a shot at winning the actual CT-2 if some cards had fallen into place after 2016. Hillary Clinton’s performance in that district, which takes in much of the eastern part of the state, was surprisingly weak in 2016, as she only carried the seat by a 49%-46% margin after it had given Barack Obama double-digit margins twice. If the long-serving Rep. Joe Courtney (D, CT-2) had retired during a Clinton midterm, both CT-2 and CT-5 could have been dicey defensive assignments for Democrats.
NEW MEXICO
New Mexico has had a 3-0 Democratic delegation in the House since the 2022 elections. Envisioning New Mexico with a Republican-leaning district does not take much imagination—in fact, until 2022, it was the reality.
The state gained a third seat as a result of the 1980 census and, for decades, the districts followed the same basic formula: District 1 centered on Albuquerque; District 2 included Las Cruces and “Little Texas”; District 3 took in Santa Fe and most of the state’s northern Hispano counties. With that configuration, NM-2 was normally a GOP-leaning seat. While it flipped blue in 2018, Republicans won it back with then-former state Rep. Yvette Herrell (R) in 2020. But during redistricting, state Democrats divided Little Texas three ways to produce a map that created 3 Biden-won seats. Under the new lines, Herrell was defeated by now-Rep. Gabe Vasquez (D) and lost a rematch by an even larger margin in 2024.
Democrats’ current lock on the state’s delegation is mostly due to the 2022 gerrymander, although NM-2 is hardly out of reach for Republicans. If Republicans had run a stronger nominee than Herrell, it is possible they could have won the reconfigured version in either 2022 or 2024. In 2022, Herrell lost as GOP gubernatorial nominee Mark Ronchetti carried the seat in his unsuccessful run. In 2024, Vasquez won a second term by 4 points as Trump carried his seat by about 2 points.
If state Democrats had kept a status quo map for 2022, there would be little question that Republicans would still hold the 2nd District. Considering the actual 2024 House popular vote in the state, if the old NM-2 were in place, it would have backed Republicans 55%-45%.
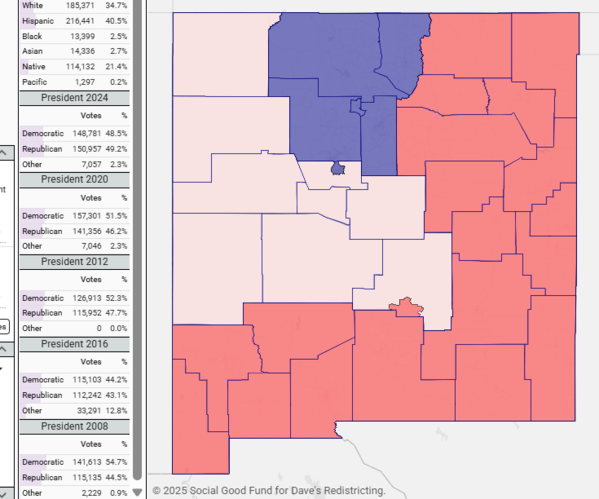
Though it is something that a Democratic trifecta would never produce, it is possible to draw a “1-1-1” configuration of the state. Map 3 pairs Santa Fe with the bluest precincts of Albuquerque while a Republican district would hug the southern and eastern borders of the state. The remaining seat would be one that has gone with the national popular vote winner in presidential elections since 2008. In the context of 2024, that may have resulted in a 2-1 GOP delegation.
Map 3: Hypothetical “1-1-1” New Mexico plan
OKLAHOMA
For all but one cycle since 2012, Republicans have held all 5 of Oklahoma’s seats. The one exception to the GOP’s monopoly came in 2018, when Kendra Horn (D) pulled one of the year’s biggest upsets, as she narrowly ousted a Republican incumbent in the Oklahoma City-area OK-5. Two years later, Horn lost her seat 52%-48% to now-Rep. Stephanie Bice (R)—while the former carried the Oklahoma County portion of the district, the latter won by taking 70% in the two smaller rural counties that OK-5 included at the time. For 2022, Republicans split Oklahoma County three ways—in large part because of that, no Oklahoma House race since the Horn-Bice matchup has been decided by less than 20 points.
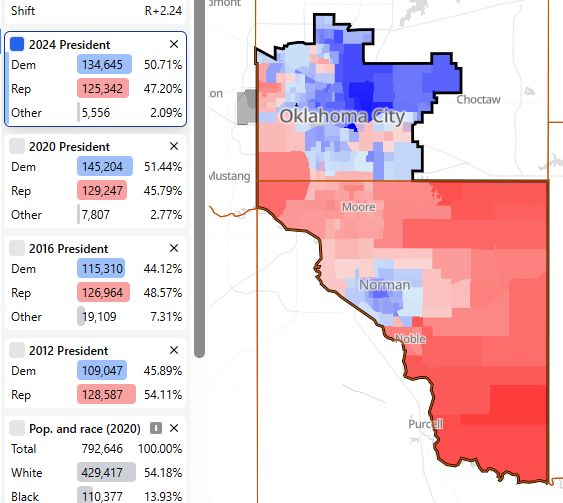
Under a fair map, though, the configuration of OK-5 would seem obvious: in 2020, Oklahoma County’s population of 796,000 was just over the state’s ideal district population, 791,871. So a hypothetical district could be Oklahoma County minus a precinct or two. Though Trump still would have carried this district, he only carried Oklahoma County by 1.2% in 2020 and 1.7% in 2024.
It’s possible that an Oklahoma County-only district could be the contemporary version of what New Hampshire’s 1st District was last decade—that is, a seat that flips between parties with regularity. After losing in 2020, Horn was the Democratic nominee for a special Senate election in 2022. Horn carried Oklahoma County by 4 points in that race, so it’s possible she could have put up similar numbers in a House race. Despite the county’s close presidential topline in 2024, Republicans could have still won an Oklahoma County-only district last year—as it was, Horn ran less than a point ahead of Biden in that part of her district in 2020, and would have had to run even further ahead of Harris there last year.
Aside from that swingy configuration of OK-5, Map 2 shows that a more clearly Democratic-leaning seat could be drawn in the area. Essentially, it involves trading out the reddest precincts of Oklahoma County and moving Cleveland County, which contains several blue precincts that make up Norman (home to the University of Oklahoma), into the district. The district pictured in Map 4 gave Biden a 51%-46% margin in 2020—last year, Harris would have done only a little worse.
Map 4: Democratic-leaning Oklahoma City-to-Norman district
The state’s other main metro area, Tulsa, meanwhile, is probably too red to support a cleanly-drawn district that would be truly competitive. Tulsa County, which gave Trump a 14-point margin, contains enough population for about 85% of a district. None of the counties that border it, which would provide the other 15% needed for a full district, gave Trump less than about 70% of the vote.
ARKANSAS
As we’ve alluded to before, probably the biggest “own goal” of the post-2010 redistricting cycle was committed by Arkansas Democrats. Though the writing was on the wall for state Democrats by 2010, they still held the governorship and both chambers of the state legislature. Democrats opted to, more or less, stick with the configuration that had been operative since the 1970s. In practical terms, that meant instead of passing a map that had one or two winnable seats, they enacted a plan that featured 4 districts that the late John McCain (R) had easily carried in 2008. In 2012, Republicans won all 4 seats, and have held them since. With their post-2010 maps, Arkansas Democrats also needlessly broke the state’s long-standing tradition of keeping counties whole—this was used against them during the most recent round of redistricting, when GOP-drawn maps split up some blue parts of Little Rock.
Around the time of the post-2010 redistricting, the author thought something like the first image on Map 5 might make sense for Arkansas Democrats. District 4 would include the Delta counties and the southern part of the state—though it backed McCain by 13 points, it included the parts of the state with the strongest Democratic heritage and seemed amenable to a Blue Dog—and District 2 would be a McCain+4 seat pairing Pulaski County (Little Rock) with Jefferson County (Pine Bluff). But, by 2014, even the Democratic “Milesmander” of Arkansas would have been under strain: when now-former Sen. Mark Pryor (D) lost his seat that year, he only barely managed to carry the Little Rock-based seat and lost the Delta seat by 8 points to now-Sen Tom Cotton (R).
Map 5: Hypothetical Arkansas maps
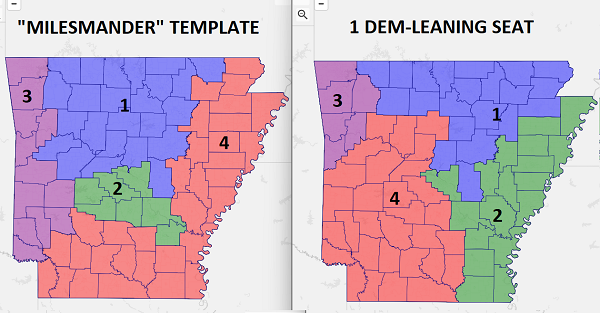
So, realistically, the best Democrats could hope for under any reasonable Arkansas map would be one winnable seat. While a Little Rock-area seat that contains both Pulaski and Jefferson counties would still only be light red at the presidential level, we cannot find a statewide race since 2014 where Democrats have actually carried it. In other words, it would hardly be a reliably blue seat. With that, as the right image on Map 5 shows, the only way to draw a clean Democratic-leaning seat in the state involves linking Pulaski County with some marginal, but red-trending, Delta counties (it would be the green district).
IOWA
Though Iowa has had a 4-0 Republican delegation since the 2022 elections, it is not really accurate to call its map a blatant partisan gerrymander.
As Managing Editor Kyle Kondik pointed out in another recent article, though the current map preserves 4 Trump-won seats, 3 of them are at least a little more Democratic than the state as a whole. As the 2026 elections are shaping up, we rate Districts 1 and 3 as Toss-ups, while District 2 could potentially get more competitive if Sen. Joni Ernst (R) retires and Rep. Ashley Hinson (R, IA-2), a strong performer in her district, runs for Senate.
However, even if they have some good offensive opportunities on the current map, Democrats would still probably prefer a map where they would be outright favored in at least one district. That was basically the case with the first map that the state’s nonpartisan Legislative Services Agency released after 2020. Though legislative Republicans voted it down, that map created two deep red seats, a light red seat that included Des Moines, and a blue seat in the eastern part of the state. The ideal Democratic map of the state, though, would likely be a 2-2 plan. In this instance, Democrats could have two light blue seats—one in the east, and another that links Des Moines and Ames—while the other two seats would be solid red.
NEBRASKA
Republicans have held all 3 of Nebraska’s seats since the 2016 elections. However, an important factor in the GOP’s monopoly here has been the crossover support that Rep. Don Bacon (R, NE-2) has been able to generate in what has become a Democratic-leaning seat at the presidential level. During the post-2020 round of redistricting, Bacon got some help, as Saunders County, a rural county that is ruby red, was added to his seat. But, in what was still a Biden +6 seat, Bacon would have been reelected in 2022 even if Saunders County hadn’t cast any votes. Though Saunders County provided his margin in 2024, it still seems possible he could have found a way to win even if his seat was confined to Douglas (Omaha) and Sarpy counties.
In any case, with Bacon retiring, the Crystal Ball rates the contest for his seat as Leans Democratic, so assuming the current lines stand, Democrats may have representation in Nebraska next year. We say “assuming” because Nebraska is another state where legislators are at least discussing the idea of mid-decade redistricting. State Navigate’s Chaz Nuttycombe posted a thread recently exploring some Nebraska map scenarios.
UTAH
Since the post-2000 redistricting cycle, when Republicans unsuccessfully targeted then-Rep. Jim Matheson (D, UT-2), Salt Lake County has been “pizzamandered” between 3, and then 4, districts. In 2018, Utah voters passed a constitutional amendment aimed at creating fairer districts, but Republicans, holding a state governmental trifecta, ignored a commission’s recommendations and instead passed their own gerrymander. There is a pending case related to the matter that has been sitting in state courts for some time, making Utah a possible candidate for a court-ordered 2026 remap.
Under basically any fair map, Salt Lake City, which had a population of 200,000 as of the 2020 census, should dominate an urban district—such was basically the case in the seat that the aforementioned Matheson was elected to in 2000. Putting Salt Lake City with some municipalities immediately to its south, like West Valley and Murray, typically yields a seat that would have backed Harris by about 20 points.
While it would probably represent a less logical outcome, it is possible to create 2 districts that Trump lost in both 2020 and 2024. Under this scenario, Salt Lake City proper could be put with Davis County, a conservative but blue-trending county to its north, while much of the rest of Salt Lake County could be put in a district with Summit County, which includes some touristy areas.
Conclusion
It is feasible to draw at least one minority-party district in each of these states, although some are easier to draw and more politically logical than others—in many cases, they would require the majority party helping out the minority party, which is not really plausible. Many of the minority-party seats drawn for this article would also probably be the types of seats that would swing with the national environment—something that would at least make things more interesting for those of us who follow elections. In a good Democratic year, for instance, Democrats could be clear favorites in two Utah districts while in a red wave year, Republicans could gain several more seats in New England.
P.S. Ohio Senate to Leans Republican
Table 1: Crystal Ball Senate rating change
Last week, Managing Editor Kyle Kondik touched on how former Sen. Sherrod Brown’s (D-OH) potential 2026 intentions could impact our ratings. Earlier this week, Cleveland.com’s Jeremy Pelzer reported that Brown is pushing ahead with a rumored 2026 Senate comeback bid.
Brown is actually not running for his old seat (it is not up until 2030), but if he wins next year, he’ll serve out the final 2 years of the term that now-Vice President JD Vance was elected to in 2022. Though appointed Sen. Jon Husted (R), who has a long resume in state government, is probably a stronger candidate than Sen. Bernie Moreno (R), who defeated Brown by 3.5% last year, Brown’s entrance into the race gives Democrats their strongest possible recruit in what could be a favorable year for them. With that, we are officially moving the race from Likely Republican to Leans Republican.
J. Miles Coleman is an elections analyst for Decision Desk HQ and a political cartographer. Follow him on Twitter @jmilescoleman.
See Other Political Commentary by J. Miles Coleman.
See Other Political Commentary.
Views expressed in this column are those of the author, not those of Rasmussen Reports. Comments about this content should be directed to the author or syndicate.
Related Articles

Rasmussen Reports is a media company specializing in the collection, publication and distribution of public opinion information.
We conduct public opinion polls on a variety of topics to inform our audience on events in the news and other topics of interest. To ensure editorial control and independence, we pay for the polls ourselves and generate revenue through the sale of subscriptions, sponsorships, and advertising. Nightly polling on politics, business and lifestyle topics provides the content to update the Rasmussen Reports web site many times each day. If it's in the news, it's in our polls. Additionally, the data drives a daily update newsletter and various media outlets across the country.
Some information, including the Rasmussen Reports daily Presidential Tracking Poll and commentaries are available for free to the general public. Subscriptions are available for $4.95 a month or 34.95 a year that provide subscribers with exclusive access to more than 20 stories per week on upcoming elections, consumer confidence, and issues that affect us all. For those who are really into the numbers, Platinum Members can review demographic crosstabs and a full history of our data.
To learn more about our methodology, click here.