2004 to 2024, Part Two: When Each State Was at its Most Republican
A Commentary By J. Miles Coleman
KEY POINTS FROM THIS ARTICLE
— The “presidential lean” of a state can, over time, help us quantify its political trajectory.
— Much of the Heartland and Midwest has come to lean more to the GOP over the past two decades, though the Sun Belt has gotten more Democratic.
— By our “leans” metric, Donald Trump held up especially well in several swing states in 2020, even as he lost the presidency that year.
— Florida was the only state that was at its most Democratic in 2004, the earliest year that we consider, and its most Republican last year, showing a clear trend toward Republicans over two decades.
Measuring how Republican each state has been since 2004
This week, we are continuing our look at when each state “leaned” most towards either party over the six presidential elections since 2004. A couple of weeks ago, we did a national walkthrough breaking down when each state leaned most towards Democrats. We will now do the same for the Republicans.
For an example of our methodology, let’s consider Louisiana. In most of the elections that we’re considering for this article, the state voted Republican by a roughly 60%-40% two-party margin. That was the case in last year’s election, when Donald Trump won the national popular vote. But in 2008, John McCain was also able to sustain that type of margin in the state despite losing decisively at the national level. So, compared to the rest of the country, McCain’s showing in Louisiana was more impressive than Trump’s. This is the basis of the “leans” metric we’ve been using.
Map 1 shows when each state had its most Republican lean from 2004 to 2024. In what follows, we go through each year to discuss noteworthy points.
Map 1: Year each state leaned most Republican relative to the nation, 2004-2024
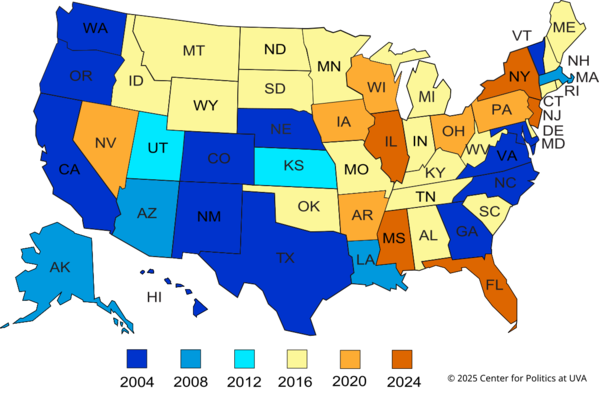
Source: Dave Leip’s Atlas of U.S. Presidential Elections; Note: Calculations are two-party.
2004
The 13 dark blue states on Map 1, which were most Republican in 2004, contain some of the states that have, over the long term, moved most towards Democrats—something that makes sense, as they were at the most Republican, relative to the nation as a whole, in the least recent election. In fact, 9 of the 13 states in this group were also at their most Democratic in 2024.
In the Pacific Northwest, Oregon and Washington state were both within 10 percentage points of the national popular vote in 2004—20 years later, they each moved 10 points left. Similarly, George W. Bush posted very respectable performances in California and Hawaii (a visit by then-Vice President Dick Cheney to the latter late in the campaign was suggestive of the state being on the periphery of the playing field that year, although John Kerry still won it by 9 points).
Moving west, Colorado and New Mexico were states that Bush carried outright but later backed losing Democratic nominees in both 2016 and 2024. While Nebraska is still a solidly GOP state, Democratic gains in both the Omaha and Lincoln areas since 2004 help explain the state’s position here. Though large swaths of Texas have drifted right over the past 20 years, Bush’s showing in his home state remains the GOP’s high-water mark there, in both raw and relative terms.
On the Eastern Seaboard, Virginia, North Carolina, and Georgia all gave Bush high-single or double-digit outright margins in 2004. But 20 years later, Virginia clearly leans left of the nation while Georgia and North Carolina are both intensely competitive. In 2004, 2008, and 2012, Georgia was more than 10 points right of the nation but even as Kamala Harris lost the state last year, its red lean continued to erode, and it was within a point of the national popular vote. North Carolina, meanwhile, was parked at about 6 to 7 points right of the nation from 2008 to 2020. Its Republican lean fell to less than 2 points last year.
2008
Two of the four states that were most Republican in 2008 had connections to the top of the GOP ticket: the medium blue category on Map 1 includes John McCain’s Arizona and Sarah Palin’s Alaska. From 2004 to 2008, Arizona shifted from being 8 points right of the nation to 16 points to the right—in raw terms, McCain’s percentage margin there was only slightly worse than what Bush got, but his national margin was obviously significantly worse. Over the last two presidential elections, Arizona has stayed around 4 points right of the nation. In 2008, Alaska leaned nearly 30 points right of the national popular vote, and its lean has steadily become less pronounced. Still, we would not exactly call Alaska a pressing Democratic target in presidential elections.
By 2008, the New Orleans area was still working to recover from Hurricane Katrina. Politically, this probably benefited Republicans, as a sizable portion of the city’s Black residents fled to other states, and many had not returned. This explains, at least in part, why Louisiana’s GOP lean doubled from 12 points in 2004 to 26 points in 2008. In outright terms, McCain carried the perpetually marginal New Orleans area 52%-46%, which was the most comfortable margin for any presidential candidate during the 2004 to 2024 span.
2012
Mitt Romney’s 2012 showing represented the GOP’s best relative showing in two states: Kansas and Utah. Starting with the latter, it should come as no surprise that the first LDS nominee from a major party would fare especially well in Utah. Eight years earlier, Bush came close to matching Romney’s eventual margin there, as the former’s 46-point margin was only a little worse than the latter’s 48-point win. But the difference in the national picture meant that, Utah was 44 points right of the nation in 2004 and 53 points to its right in 2012. Utah’s Republican lean has come down considerably since 2012—it was 21% right of the nation last year—though Democrats’ “Blutah” aspirations seem, at the very least, multiple cycles away.
On the other side of Colorado, Romney owes his best relative placement in Kansas to his strength in its urban areas. Johnson County, which is the state’s most populous county, speaks to this. Even as Bush won the county by 6 more percentage points than Romney (17% vs 23%), the latter received about 300 more votes (158,103 vs 158,401). And while turnout rose markedly in the Trump era, both in Johnson County and nationally, Trump’s highest vote total there was 155,631, in 2020. Romney was a better fit for this kind of area than Trump, which helps explain Kansas’s GOP lean decreasing, even as the state is still Safe Republican at the presidential level.
2016
The yellow category, where Trump’s 2016 result represented the strongest relative showing for a Republican, was the most prevalent, with 20 states in the group. These states include the Dakotas and the adjacent northern Rocky Mountain states. In the Heartland, the Trump 2016 category also included a span of states stretching from Oklahoma to West Virginia—these were all preexisting red states that swung to Trump in 2016 and have stayed fairly static since.
Though this was the most numerous category, it only included one of last year’s seven presidential Toss-up states: Michigan. In a way, this underscores how fluky Trump’s victory in the state seemed to be in 2016—in 2020, its GOP lean went down enough to enable Joe Biden to carry it, and by 2024, it was actually slightly left of the national popular vote.
The yellow group also includes blue states that were, in outright terms, much closer than Democrats would have wanted in 2016. For instance, 2016 was the only presidential year since the Eisenhower era where Minnesota was right of the national popular vote. Other similar cases included four of the New England states and Delaware—all of which showed a degree of openness to Trump in 2016 but snapped back to Democrats in subsequent cycles. New England can usually be considered the nation’s most secular region, so Trump increasingly aligning himself with the evangelical right probably played a part in turning off those voters. Meanwhile, Delaware’s shift back to the left likely had something to do with its loyalty to Biden.
2020
In orange, the Trump 2020 states could be considered the opposite of the yellow Trump 2016 ones: they are not a large group but contain several of last year’s most contested electoral prizes. Specifically, this set of six states included Pennsylvania, Wisconsin, and Nevada. Of the 7 core Toss-up states from 2024, Joe Biden saw his smallest improvement over Hillary Clinton in these three: in raw terms, Pennsylvania and Wisconsin shifted less than two points to the left from 2016 to 2020 (although this was enough for them to change sides), and Biden actually lost a little ground in Nevada during that same span. But last year, because Trump won the national popular vote, his strength in those states did not stand out as much vis-à-vis his past runs. One way to think about these three Toss-up states is that, after mostly being to the left of the nation in the three pre-Trump elections, they were consistently close in all of 2016, 2020, and 2024 despite differing national results—so Trump’s showing in those states stood out most when he was losing the national popular vote by almost 5 points.
2024
Trump’s 2024 result represented the best relative showing for Republicans in only five states. Driven mostly by the urban swing in the New York City area, it is not surprising that New York and New Jersey are in this category. 2024 was the only year that we considered where the former was within 15 points of the national popular vote and the latter was only single digits left of the nation.
Illinois was another large state where Kamala Harris’s raw margin was weighed down by comparatively poor urban numbers. But even as Chicago’s Cook County moved about 10 points to the right, it did not change the state’s relative lean much: Illinois was 12.6% left of the nation last year, down slightly from 12.8% in 2020, and basically coming full circle from its 12.9% blue lean from 2004.
Towards the end of the Obama era, Mississippi seemed like a legitimate possibility for a Democratic reach target someday: with a large Black population, Obama pushed its red lean down to only about 15 points in 2012. But in the Trump era, it has been more than 20 points right of the nation, and has reddened a little in each of the past few elections. As recent history shows, some movements turn into longer trends while others prove more ephemeral.
Over the past few years, we have not exactly hidden our long-term bearishness for Democrats in Florida, and our finding in this exercise helps confirm that. Florida was the only state on the whole map that was at its most Democratic in 2004 but at its most Republican in 2024—in other words, the opposite of most dark blue states in the first category.
Finally, Map 2 doesn’t take into consideration all six presidential cycles, as we’ve been doing so far, but shows linear change in each state’s lean from 2004 to 2024. Blue states came to lean more Democratic over the 20-year period, red ones got more Republican, and yellow ones changed by less than a percentage point either way.
Map 2: Change in state leans, 2004-2024
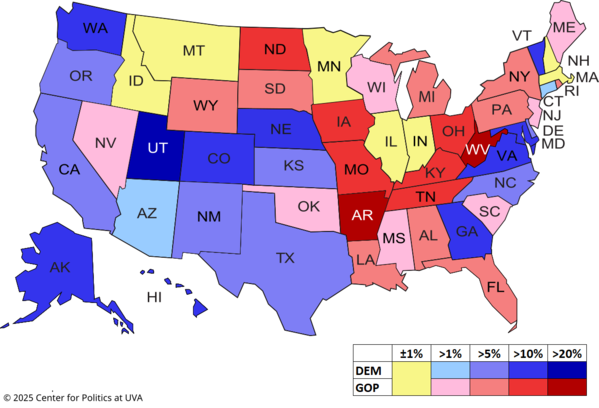
Overall, this map lines up with the state-level trends we’ve discussed over these two articles. At the topline level, the totals of the categories are not very different from what a presidential map would be in a close election: the blue states account for 232 electoral votes, the red ones have 240, while there are 63 yellow (Toss-up) states. Washington DC, which was already heavily Democratic, has leaned even further to the left since 2004, so it would provide 3 more electoral votes to the blue side on Map 2. Of course, some of the blue-shaded states on Map 2 usually still vote Republican, and vice versa.
So while there has been considerable internal movement across the electoral map over the last few decades, we are still in a time of highly competitive elections.
J. Miles Coleman is an elections analyst for Decision Desk HQ and a political cartographer. Follow him on Twitter @jmilescoleman.
See Other Political Commentary by J. Miles Coleman.
See Other Political Commentary.
Views expressed in this column are those of the author, not those of Rasmussen Reports. Comments about this content should be directed to the author or syndicate.
Related Articles

Rasmussen Reports is a media company specializing in the collection, publication and distribution of public opinion information.
We conduct public opinion polls on a variety of topics to inform our audience on events in the news and other topics of interest. To ensure editorial control and independence, we pay for the polls ourselves and generate revenue through the sale of subscriptions, sponsorships, and advertising. Nightly polling on politics, business and lifestyle topics provides the content to update the Rasmussen Reports web site many times each day. If it's in the news, it's in our polls. Additionally, the data drives a daily update newsletter and various media outlets across the country.
Some information, including the Rasmussen Reports daily Presidential Tracking Poll and commentaries are available for free to the general public. Subscriptions are available for $4.95 a month or 34.95 a year that provide subscribers with exclusive access to more than 20 stories per week on upcoming elections, consumer confidence, and issues that affect us all. For those who are really into the numbers, Platinum Members can review demographic crosstabs and a full history of our data.
To learn more about our methodology, click here.