2004 to 2024, Part One: When Each State Was at its Most Democratic
A Commentary By J. Miles Coleman
KEY POINTS FROM THIS ARTICLE
— The “presidential lean” of a state can, over time, tell us something about how it is trending.
— Though 2004 and 2024 produced similar topline national results, there has been some significant change in how individual states vote relative to the country.
— By this measure, Kamala Harris held up relatively well in Sun Belt Toss-up states, while it has been several cycles since the Rust Belt Toss-ups were at their most Democratic.
Change in presidential elections over the last 20 years
The years 2004 and 2024 had some broad similarities when it comes to presidential politics. In both years, Republicans who had originally gotten into office despite losing the popular vote both expanded their margin in the Electoral College and carried the popular vote. However, as we’ve discussed often, the country has seen significant internal electoral movement during the time that was bookended by those two Republican wins. For this piece, as well as another one that will follow, we are going to look closer at how each state has moved politically over the last two decades of presidential politics.
We’ll be considering how states have “leaned” compared to the nation. For instance, let’s say state A votes 51%-49% for the Republican candidate while the national vote was a 50%-50% tie (this analysis uses the two-party vote in all cases). So in that year, state A would have “leaned” 2 percentage points right of the nation. But the next election, the Republican nominee improves their national showing to 52%-48% but state A gives Republicans the same 51%-49% vote. In this example, even though state A was unchanged in terms of its presidential margin, it “leaned” a little to the right of the country as a whole in the first election but took on a “lean” that was less Republican—or, more Democratic, since we are dealing in binary terms—than the country in the second election. Though the concept of partisan “lean” may admittedly have an “academic” or theoretical component, tracking how a state leans over time can give us a good idea of how it is trending.
Map 1 takes this into consideration and looks at when each state had its most Democratic lean from 2004 to 2024. The colors themselves don’t really have any partisan implications; we just went with colors that we thought would be visually distinctive. In Part Two, we’ll look at when each state was most Republican. Below Map 1, we’ll go through each group of states and discuss what stood out to us.
Map 1: Year each state leaned most Democratic relative to the nation, 2004-2024
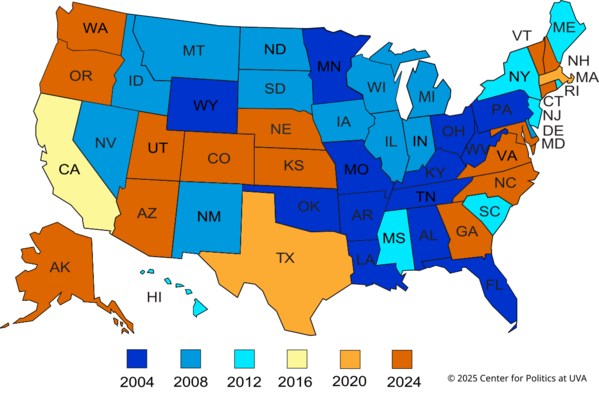
Let’s go through the six election years and see what stands out:
2004
Not surprisingly, many of the states that were most Democratic in 2004, the earliest year that Map 1 considers, have seen the sharpest movement away from the party overall. With a few exceptions, the navy blue states form a continuous mass centering on what could be called “Greater Appalachia.” This was the only year that we’re considering where Arkansas, Louisiana, Tennessee, Kentucky, and West Virginia—states with traditional but long-eroded Democratic loyalties—were all less than 20 percentage points right of the national popular vote. The 2004 election also represented the only year on Map 1 where Ohio voted left of the nation, while Pennsylvania—last year’s tipping point state—leaned 5 points left of the nation. Those states also have significant territory defined as Appalachian by the federal Appalachian Regional Commission. Though John Kerry’s 5-point loss in Florida must have seemed like a landslide loss at the time—especially coming immediately after the state’s infamously close 2000 result—it speaks to how tough the state has gotten for Democrats since then that, in relative terms, his showing there was the best of the last couple of decades.
2008
In 2008, Barack Obama was an especially strong Democrat throughout much of the Upper Midwest. He was the best performing Democrat in all four states that border Lake Michigan. While Indiana and Wisconsin contain parts of what could be considered “Greater Chicagoland,” Michigan’s economy was especially hard-hit during the onset of the Great Recession, which probably worked in Democrats’ favor in 2008. Going west, Iowa, where caucus-goers gave Obama a crucial early primary victory, as well as the Dakotas, are blue on Map 1—these were states where the late Sen. John McCain’s opposition to ethanol subsidies likely hurt him. Obama showed strength in some Mountain West states—the most electorally critical of which was Nevada, a state that was economically in much the same boat as Michigan at the time. Also of note may be that Delaware was actually at its most Democratic in 2008, when its home candidate, Joe Biden, was tapped to be vice president—it voted about 18 points left of the nation that year. In 2020, with Biden leading the Democratic ticket, its Democratic lean was reduced to about 15 points left of the nation.
2012
The 7 light blue states on Map 1, where Obama’s 2012 performance represented the best recent Democratic showing, can be basically divided into four groups. In the South, Obama outright improved on his raw percentage margins from 2008 throughout much of the Black Belt, large portions of which are located in Mississippi and South Carolina. Further up the East Coast, incumbency likely helped Obama in New York and New Jersey, which were both hit by Hurricane Sandy weeks before Election Day. In Maine and Rhode Island, we were initially tempted to chalk Obama’s strong 2012 showing up to his strength in the working class districts of those states. But digging a little deeper, the four House districts between the two states all got at least a little more Democratic, relative to the nation, from 2008 to 2012, suggesting Obama held up well across various demographics in those states. And then there is Hawaii. Obama’s native state gave him margins of a little better than 70%-30% both times he was on the ballot—because his national margin fell a few points in 2012, Hawaii leaned further to the left of the country that year.
2016
While Hillary Clinton was the best-performing Democrat in only one state, it was a big one: California. Roughly speaking, Clinton pushed California 30 points left of the nation in 2016 by getting Obama-type numbers with Hispanics and suburban numbers that were on par with what Joe Biden got in 2020. While Kamala Harris’s numbers in her native state may have seemed unimpressive last year—she carried California “only” by a 60%-40% spread—California still exhibited a more pronounced Democratic lean in 2024 than it did in the Obama era.
2020
If Clinton had the ideal Democratic coalition for California, Biden had the best coalitions for Texas and Massachusetts. From 2004 to 2012, Texas was parked at about 20 points right of the nation. Then, in 2016, its Republican lean went down to 12 points. Though Biden underperformed Clinton’s numbers with Hispanics, he improved at least a few percentage points over her margins in most large urban counties, which was enough to almost get Texas’s Republican lean to within single digits. In raw terms, Trump’s roughly 14-point margin in Texas from last year represented a significant improvement from his past two results in the state, but in relative terms, its red lean was only a little more pronounced in 2024 than it was in 2016. Meanwhile, in the Trump era, Massachusetts has always been between 27 and 30 points left of the nation.
2024
Despite her popular vote loss, when we adjust things to account for a tied national vote, Kamala Harris was the best-performing recent Democratic nominee in 15 states. While we won’t go through all of them, the dark orange states on Map 1 include 3 of the 4 Sun Belt states that we rated as Toss-ups during much of the fall campaign.
As we’ve suggested in previous posts, we are relatively bullish on Democrats’ long-term prospects in Georgia, and Map 1 helps explain why. In every presidential election that we considered for this piece, the Republican lean of Georgia has lessened. In 2004, it voted 14 points right of the nation—by the time Democrats actually managed to flip it, in 2020, it was still a little over 4 points redder than the national popular vote. Though Trump reclaimed the state by about 2 points last year, his margin in Georgia was within a percentage point of his national margin.
Meanwhile, from 2012 to 2020, North Carolina was eerily stagnant, always landing 6 points to the right of the nation. As with Georgia, its presidential lean got about 4 percentage points less red in 2024, as it voted within 2 points of the national popular vote.
Arizona turned out to be Trump’s best of the seven Toss-up states, as it was the only state out of the lot where his margin exceeded 5 points. But the swing that Arizona saw from 2020 to 2024 was nearly identical to the national swing—Trump improved by 5.9% in the former and 6.0% in the latter. With that, Arizona was one of the nation’s most relatively stagnant states between the two most recent presidential elections: it moved from voting 4.2% more Republican than the nation to 4.1% more Republican than the nation last year.
Out of the 300 state-level results that we considered for Map 1 (6 presidential elections each with 50 state results), there was only one instance where a state mirrored the national vote to within less than a tenth of a percentage point: in 2012, Obama carried Virginia and the national popular vote by a 3.93% two-party margin. So Virginia’s presidential lean for 2012 was zero. Going into this year’s gubernatorial election, Virginia Democrats may like that the Old Dominion has steadily moved left relative to the country—last year, it was 7.4% left of the nation, its most pronounced lean of this two-decade era.
We’ll do a similar walkthrough considering when each state had its most Republican lean in elections since 2004 in Part Two.
J. Miles Coleman is an elections analyst for Decision Desk HQ and a political cartographer. Follow him on Twitter @jmilescoleman.
See Other Political Commentary by J. Miles Coleman.
See Other Political Commentary.
Views expressed in this column are those of the author, not those of Rasmussen Reports. Comments about this content should be directed to the author or syndicate.
Related Articles

Rasmussen Reports is a media company specializing in the collection, publication and distribution of public opinion information.
We conduct public opinion polls on a variety of topics to inform our audience on events in the news and other topics of interest. To ensure editorial control and independence, we pay for the polls ourselves and generate revenue through the sale of subscriptions, sponsorships, and advertising. Nightly polling on politics, business and lifestyle topics provides the content to update the Rasmussen Reports web site many times each day. If it's in the news, it's in our polls. Additionally, the data drives a daily update newsletter and various media outlets across the country.
Some information, including the Rasmussen Reports daily Presidential Tracking Poll and commentaries are available for free to the general public. Subscriptions are available for $4.95 a month or 34.95 a year that provide subscribers with exclusive access to more than 20 stories per week on upcoming elections, consumer confidence, and issues that affect us all. For those who are really into the numbers, Platinum Members can review demographic crosstabs and a full history of our data.
To learn more about our methodology, click here.