Texas Republicans Aim for Five-Seat Gain in New Proposed Gerrymander
A Commentary By Kyle Kondik and J. Miles Coleman
KEY POINTS FROM THIS ARTICLE
— A much-anticipated draft of a new Republican gerrymander of Texas emerged Wednesday morning.
— The map is designed to allow Republicans to win five new seats in Texas, which would have the effect of pushing their edge in the state delegation from 25-13 at full strength to 30-8.
— Not all the newly-drawn seats are guaranteed Republican pickups, though.
— We offer tentative possible ratings of the new map’s 38 districts below, although without knowing if the map will be enacted under this form (or at all), we are not actually making any rating changes today.
A first look at the proposed Texas map
The proposed new Republican gerrymander of Texas dropped Wednesday morning. Reporting prior to the map’s release suggested that Republicans would try to wring an extra five seats out of the Lone Star State. The new map gives them that potential, although they would not necessarily be guaranteed to achieve that maximal gain.
Just to offer a few important caveats, this map is NOT yet enacted. It is merely proposed. It could be changed before being signed into law, or perhaps a Democratic gambit to deny state legislative Republicans a quorum during this ongoing special session could succeed (we doubt it, but this is something Democrats might try—Owen Dahlkamp of the Texas Tribune has details). There also almost assuredly will be lawsuits about the map, which the Democratic Congressional Campaign Committee has already threatened. For the time being, let’s set all of that aside and just look at the map and how it has performed politically.
The current Texas map, designed as a 25-13 Republican gerrymander with some possible growth potential for Republicans in South Texas, has performed as intended in its two cycles of use. Republicans have easily won their 25 allotted seats, and an additional two seats—traditionally Democratic but red-shifting TX-28 and TX-34 in South Texas—voted for Donald Trump in the 2024 presidential election. However, they reelected their Democratic House incumbents at the same time, Reps. Henry Cuellar (D, TX-28) and Vicente Gonzalez (D, TX-34). Under the current map, we rate both of those seats as Toss-ups, along with 25 Safe Republican districts and 11 Safe Democratic districts.
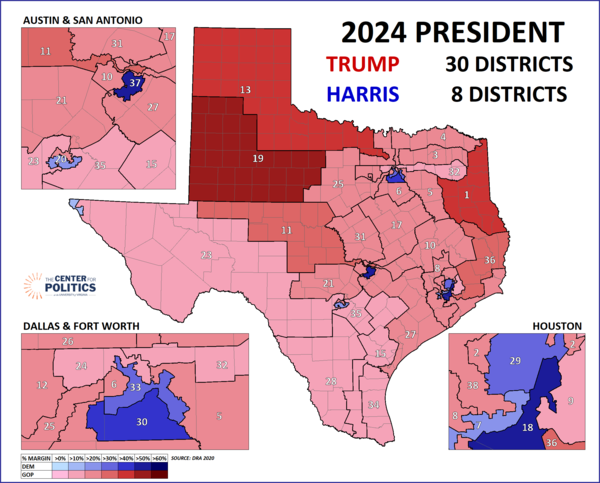
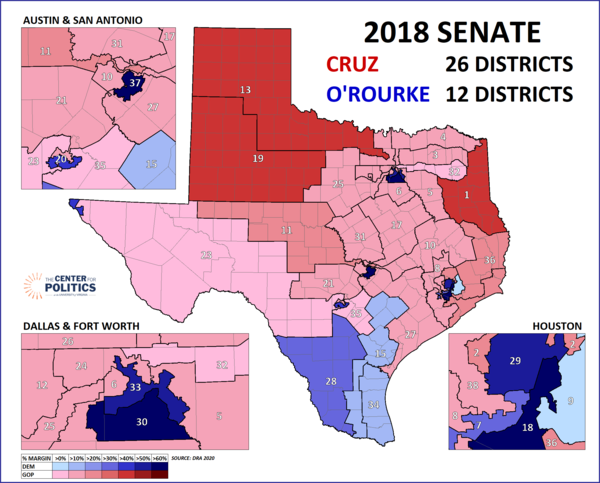
As we go through the proposed new map, we’re going to offer thoughts on how we might rate the new districts if they actually go into effect. To be clear—we will not change any ratings until the map is signed into law by the governor, so these are not actual rating changes, and we may come to different conclusions later as we further digest the map. Maps 1 and 2 show the new proposed map by, respectively, the 2024 presidential results and the 2018 Senate results (right-click to enlarge). Statewide, Trump won by a little over 13.5 points in 2024 while Sen. Ted Cruz (R-TX) won reelection by about 2.5 points in 2018. Showcasing these two elections shows how the districts performed in both a good Republican year (2024) and a much tougher one (2018). Under this proposal, Trump would have carried 30 of the 38 districts in 2024 (all by 10 points or more), while Cruz would have carried 26 overall in 2018, with the difference being three red-trending South Texas districts (TX-15 as well as the aforementioned 28 and 34) as well as TX-9 in Houston. We will touch on all of these districts in our analysis below.
Map 1: Proposed Texas congressional map by 2024 presidential results
Map 2: Proposed Texas congressional map by 2018 Senate results
First of all, there are 26 districts that we would probably characterize as Safe Republican. Of those, two could possibly be more like Likely Republican: Rep. Tony Gonzales (R, TX-23) in a geographically enormous district that stretches from El Paso to San Antonio and Rep. Monica De La Cruz (R, TX-15) in a South Texas district that snakes north from the border. Under both the current map and the proposed map, Trump carried them by about 15 (TX-23) and 18 (TX-15) points. Gonzales did almost lose a primary last year, and his seat could be more vulnerable as an open seat, and De La Cruz may draw an interesting opponent in singer Bobby Pulido. But Democrats would need a ton of breaks to put either in play. Overall, we don’t see any real risk that this map spreads Republicans so thin that they could come out of 2026 with fewer than the 25 seats they currently hold, even if there is a Democratic wave.
Meanwhile, eight districts are Safe Democratic. So in one long and one short paragraph, we’ve addressed 34 of the state’s 38 districts. The remaining four are at least a bit more interesting.
As part of this gerrymander, Republicans reconfigured seats in San Antonio and Houston to be majority-Latino districts designed to elect Republicans. TX-35, the remade San Antonio seat, voted for Trump by about 10 points for president in 2024. Other recent races were closer: Cruz won it by 0.3 and 3.8 points, respectively, in his 2018 and 2024 victories, and Trump carried it by 2 points in 2020. This is a district that Republicans would certainly have been more skittish about drawing in the 2022 redistricting cycle—remember that they were going for 25 ironclad Republican seats, as opposed to the maximization strategy they are now pursuing on orders from the White House—but Trump’s improvement in the district could give them more confidence about carrying it in 2026. The fact that even Cruz carried it in 2018 despite winning by less than 3 points statewide—very competitive for Texas—suggests that Democrats could get very close here but would have a hard time winning. The new TX-9 in Houston is redder in the context of the 2024 results—Trump won it by 15 points—but it did vote for Beto O’Rourke (D) by 2 points in the 2018 Senate race. We would probably categorize both of these seats as Likely Republican, with TX-35 having more potential to be more like Leans.
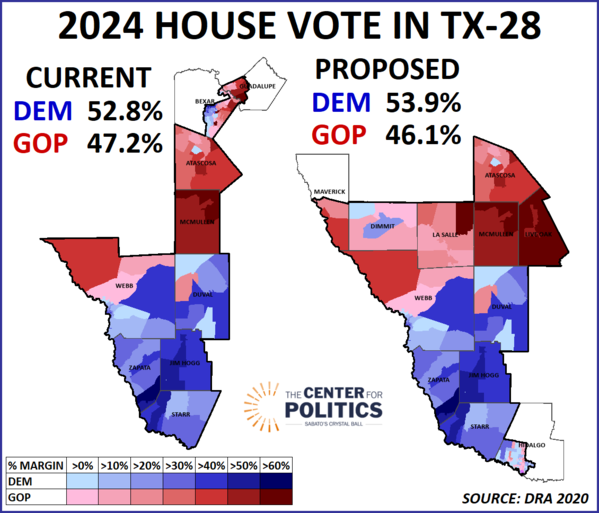
Both TX-28 and TX-34 are made more Republican-leaning on the map, but not by so much that they are guaranteed Republican wins. In fact, TX-28 might still be a Toss-up. Cuellar, arguably the least liberal member of the House Democratic caucus, is also under indictment on bribery charges, and Glenn Thrush of the New York Times recently reported that the Justice Department plans to move forward on a prosecution. Still, Cuellar’s potential legal problems have been public knowledge since the 2022 election cycle, and he has continued to win reelection (he faced credible primary and general election opponents in 2022 and a not-so-credible general election opponent in 2024). This proposal would take him out of San Antonio’s Bexar County, territory where he is less known and has less crossover appeal, and instead expands his holdings in South Texas: Our analysis suggests that Cuellar has, at some point in his long congressional career, previously represented nearly all of this new district before. The changes increase the Trump margin in his district from about 7.5 to 10.5 points, but the combined Democratic House vote from the district would be D+8, actually better than Cuellar performed in 2024 (this is shown in Map 2). Cruz won the district by a couple tenths of a percentage point in 2024, but lost it by 32 (!) points in 2018, a sign of the very rapid move to the right in this district. One could see how Cuellar could hang on, particularly if the Republican trend among Latinos here stalls or even reverses to some degree in 2026. It may be that Republicans are banking on Cuellar not being the Democratic incumbent in this seat in 2026, for one reason or another.
Map 3: 2024 House vote in current TX-28 vs. proposed TX-28
Meanwhile, the red shift in TX-34 at the presidential level is a little more pronounced, as the district moves from Trump +4.5 to Trump +10, although that new presidential topline is very similar to the proposed TX-28. Cruz, meanwhile, would have won the district by about 2 points in 2024. One difference, though, between how this district is drawn compared to TX-28 is that while in TX-28 Cuellar sees a potentially favorable or neutral trade of territory, Gonzalez sees his holdings in South Texas contract as his district moves north to take in much of Nueces County (Corpus Christi). This may make the Republican House performance of the district more durable than the topline shift suggests—in 2024, Gonzalez ran the most ahead of Kamala Harris in the Hidalgo County portion of the district, which is removed on this map. Nueces County will make up nearly 40% of the district now, which is territory Gonzalez has not represented before. So this is probably a Leans Republican district—Gonzalez would have a chance to win but he would likely start as an underdog. Gonzalez facing an unfavorable territorial swap is somewhat reminiscent of what happened in the mid-decade remap of Texas two decades ago—Republicans hurt Democratic incumbents in part by replacing familiar territory with unfamiliar territory, which made their incumbency less valuable (and incumbency in general is less valuable now than it seemed to be in the 2000s).
There is going to be more to say about this map over time, and the battle over enacting it is not over, not to mention the redistricting dominoes that may fall in other places, as we discussed in detail last week. But the map is clearly designed to allow Republicans to net up to five additional seats from Texas, even though that outcome would not be guaranteed.
Kyle Kondik is a Political Analyst at the Center for Politics at the University of Virginia and the Managing Editor of Sabato's Crystal Ball.
J. Miles Coleman is an elections analyst for Decision Desk HQ and a political cartographer. Follow him on Twitter @jmilescoleman.
See Other Political Commentary by Kyle Kondik.
See Other Political Commentary by J. Miles Coleman.
See Other Political Commentary.
Views expressed in this column are those of the author, not those of Rasmussen Reports. Comments about this content should be directed to the author or syndicate.
Related Articles

Rasmussen Reports is a media company specializing in the collection, publication and distribution of public opinion information.
We conduct public opinion polls on a variety of topics to inform our audience on events in the news and other topics of interest. To ensure editorial control and independence, we pay for the polls ourselves and generate revenue through the sale of subscriptions, sponsorships, and advertising. Nightly polling on politics, business and lifestyle topics provides the content to update the Rasmussen Reports web site many times each day. If it's in the news, it's in our polls. Additionally, the data drives a daily update newsletter and various media outlets across the country.
Some information, including the Rasmussen Reports daily Presidential Tracking Poll and commentaries are available for free to the general public. Subscriptions are available for $4.95 a month or 34.95 a year that provide subscribers with exclusive access to more than 20 stories per week on upcoming elections, consumer confidence, and issues that affect us all. For those who are really into the numbers, Platinum Members can review demographic crosstabs and a full history of our data.
To learn more about our methodology, click here.