House District Loyalty in the Trump Era
A Commentary By J. Miles Coleman
KEY POINTS FROM THIS ARTICLE
— In presidential elections since 2016, only 28 of the 435 current House districts have backed nominees of different parties.
— In next year’s House elections, districts that have been Electoral College bellwethers since 2016 could play a large role in determining whether Democrats can recapture the majority.
— Still, Republicans have some potential offensive targets in districts that have been national popular vote bellwethers.
— While House Democrats find themselves in a similar overall situation now as they did in 2017, the general contours of the House battlefield are different.
Partisan loyalty of House districts in the Trump era
During the first calendar month of Donald Trump’s second term, the main characters of the news cycles have unquestionably been the president himself and Elon Musk, whose role with DOGE’s efforts have seemed to make him something that comes close to a “co-president.” For all of the attention that executive branch actors have gotten, Congress has begun to creep into the limelight as well. Earlier this week, for instance, Speaker Mike Johnson (R, LA-4) scored a legislative win as House Republicans passed a budget resolution that Trump backed.
But some House Republicans have also begun to find themselves in the hot seat in recent days. At town hall meetings, Republicans have fielded questions from angry constituents animated by Trump and Musk’s antics—for those of us who have been following politics for several decades, the recent town halls probably bring back memories of the summer of 2009, when House Democrats seemed to be caught off guard defending then-President Obama’s health care proposals. In Georgia, a recent meeting hosted by Rep. Rich McCormick (R, GA-7) gained national attention. Something we want to note at a global level is that while McCormick holds a solidly red seat (Trump carried it 60%-39% last year), Kamala Harris received more than 160,000 votes there—so lopsided districts are not devoid of constituents who back the non-dominant party. In fact, from our calculations based on Drew Savicki’s handy “2024 Pres by CD” sheet, nearly 20% of Harris’s total votes (about 15 million of 75 million) came from districts that are redder than GA-7.
But with the 2026 midterms on the horizon, we’ll turn today to districts that are more competitive. While we have not yet released our formal district ratings yet, we’ll look at the districts that will probably be the most pivotal going forward.
Last year, we broke down how the current House districts voted from 2008 to 2020, looking specifically at the partisan loyalty over time. Most districts, not surprisingly, stayed with presidential nominees of one party or the other in all four elections. Many of the districts that saw competitive races last fall came from some type of “non-straight party” category. Today, we are doing something of an update on that article, although we are limiting our focus to only Trump-era presidential elections.
Map 1 isolates districts that have voted for either party at least once since 2016—districts that are omitted from the map stuck with the same presidential party in all 3 elections. All told, only 28 districts fall into some sort of non-straight party pattern. That is a low tally, although we would note that only 6 of the 50 states voted for each party at least once in that timeframe, so the high number of straight-party districts mirrors the high number of straight-party states in the Trump era.
Additionally, Map 1 accounts for 5 straight-party districts that elected crossover members in 2024. Democrats hold ME-2 (Jared Golden), OH-9 (Marcy Kaptur), and WA-3 (Marie Gluesenkamp Perez), which backed Trump in all three of his runs, while Republicans hold NY-17 (Mike Lawler) and PA-1 (Brian Fitzpatrick), which both have only voted blue for president in the Trump era. We included those districts here—they are striped on the map—because it is hard to discuss the broader House playing field without them.
Map 1: Non-straight party districts in the Trump era
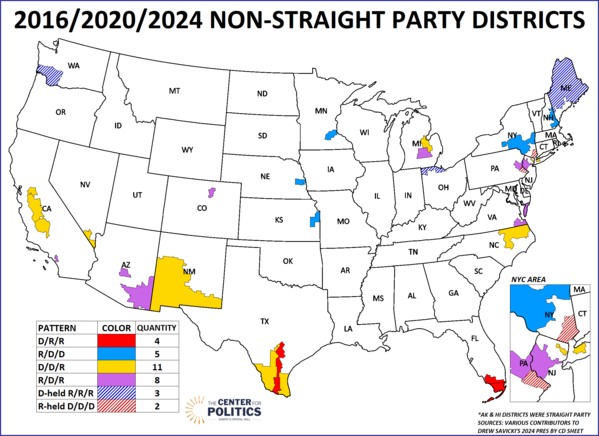
From a competitiveness standpoint, the 4 red districts, which backed Hillary Clinton in 2016 but Trump in the two subsequent elections, represent, at best, reach targets for Democrats. This group includes South Florida’s three heavily Cuban districts, where all GOP incumbents cleared 60% last year, and South Texas’s TX-15, where Rep. Monica De La Cruz (R) won a second term by nearly 15 points.
The 5 solid blue districts represent the opposite pattern, as they supported Trump only in 2016. These districts include MN-2, KS-3, and NE-2, all of which are dominated by a large metro county, as well as NY-19 and NH-1, which include a mix of suburban and rural areas. Something that ties the districts together are relatively high college attainment rates: aside from NY-19, they have higher rates than the national average. Though Democrats flipped NY-19 last year, they are nearly maxed out with this group: NE-2 is the sole Republican-held seat, as Rep. Don Bacon (R) is a veteran of close races—in recent days, Bacon has emerged as one of Trump’s loudest intraparty critics on the Russia/Ukraine conflict.
Gold districts, which have backed the national popular vote winner since 2016, make up the most common non-straight party subgroup. Democrats hold all but one of these 11 districts. A majority of these districts are also at least Latino-plurality by composition: a trio of California Central Valley seats are included, as well as the 3 border districts of NM-2, TX-28, and TX-34; though it is not located in a southwestern state, the Paterson-centric NJ-9, which made for one of Trump’s most surprising flips, finds itself in this group.
Over the past several midterm cycles where the president’s party was on the receiving end of the electorate’s wrath, there have still typically been a few seats that go against the current—the 2006 cycle, where House Democrats held all their seats, is an exception to this rule. In 2018, for example, despite netting more than 40 seats, Democrats lost a pair of open Obama-to-Trump districts in Minnesota, as well as a newly-redrawn seat in western Pennsylvania. These aforementioned Clinton-Biden-Trump districts stand out as potential against-the-grain flips even if 2026 ends up being a strong year for Democrats. Though the South Texas seats are probably the strongest possibilities, one of House Democrats’ most impressive pickups last year was CA-13—as the sprawling Central Valley seat swung double-digits to Trump, then-former state Assemblyman Adam Gray (D) narrowly ousted first-term Rep. John Duarte (R). We are watching how much staying power Gray will show next year in a region that has some political idiosyncrasies.
Moving south down the Central Valley to CA-22, Rep. David Valadao is the sole Republican with a seat in this group. After running in a series of close contests, Valadao won by a relatively comfortable 7-point margin last year, so he may be seen as a somewhat less attractive Democratic target going forward.
The remainder of the national popular vote bellwether group consists of MI-8, NV-3, NC-1, and NY-3.
Finally, the 8 purple districts on Map 1 represent the Trump era’s Electoral College bellwethers, which backed Trump in 2016 and 2024 but not 2020. Importantly, Republicans hold all the purple districts, so we expect these districts to be at the center of Democrats’ offensive efforts in 2026. In fact, last year, these districts played an outsized role in determining control of the House: Republicans picked up 3 of these districts, a gain that accounts for their current majority—had Democrats held all of CO-8, MI-7, and PA-7, they would have secured 218 seats (assuming they could have replicated their actual performance elsewhere on the map).
Also in this category are several districts where Democrats have made credible attempts over the past two cycles but have come up short. On the Eastern Seaboard, Reps. Tom Kean (R, NJ-7) and Jen Kiggans (R, VA-2) benefitted from redistricting in 2022 and ran ahead of Trump in their districts in 2024. VA-2 saw one of the closest presidential-level results in the country, backing Trump by about 850 votes, and it has had one of the longer streaks of being an overall bellwether for the House, as it’s been held by the majority party since the 2008 elections (Kiggans unseated Democrat Elaine Luria in 2022). Both VA-2 and NJ-7 will be worth watching in their state’s gubernatorial races later this year.
In Arizona, Republicans have won narrow victories in the pair of AZ-1 (David Schweikert) and AZ-6 (Juan Ciscomani) since 2022. Last year, Trump carried the former by 3 points and the latter by less than a point, so both seats are quite marginal.
Many of these purple districts will likely host races that we categorize as Toss-ups this cycle. One clear exception, though, would probably be CA-40, the only other purple seat on the map: Rep. Young Kim (R) has now won by double-digits twice in what is, on paper, a marginal seat in Orange County, CA. Though Kim has also not been targeted to the degree that other GOP incumbents in this group have been since 2022, we’d probably still start her race off as at least Leans Republican.
As a bit of a thought experiment, we went back to 2017, when House Democrats were out of power and looking to retake the chamber during an upcoming midterm, to see what Map 1 would have looked like at the time, taking into account the 2008, 2012, and 2016 presidential elections.
As Map 2 shows, while the macro-level situation was analogous to our current time—Trump had just assumed the presidency and Republicans had unified control of Congress—in some ways, it was a completely different world. As with Map 1, in addition to the non-straight party districts, we included straight-party districts that sent crossover members to the House.
Map 2: Non-straight party districts, 2008-2016
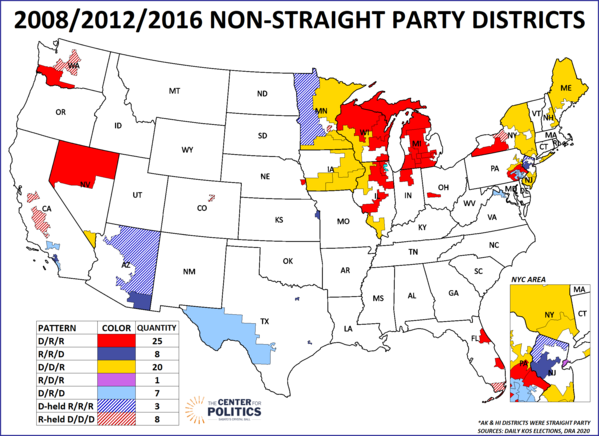
One of the most obvious differences between 2017 and 2025 is the number of districts of interest. While Map 1 highlights 33 districts, Map 2 features 72. A major contributor to this was probably just timing: Map 2 captures a time that represented the transition between the Obama and Trump years, while we are now three elections into the Trump era, and coalitions have become more stable.
Another difference has to do with the partisan composition of the districts on either map. In 2017, Republicans held 60 of 72 districts on Map 2, while the districts on Map 1 are about evenly split between the parties. Put a little differently, because Democrats are entering the cycle from a higher starting point (they currently have 215 seats, up from 194 after the 2016 elections) they have fewer targets. Going into the 2018 midterms, Republicans held 8 districts that had continuously backed Democrats for president since 2008—while Democrats would go on to flip most of them in 2018, they only have two such possibilities next year, the aforementioned NY-17 and PA-1.
House Democrats’ best category, in terms of actually flipping seats, came in the “R/R/D” group. In 2016, 8 districts that Obama lost in both of his campaigns flipped to Clinton—these districts tended to be high-income suburban seats. Realignment took hold quickly in these districts, as they all elected Democrats two years later. But unfortunately for Democrats, there is no such category on Map 1, something that also speaks to their higher baseline this cycle.
As with 2018—and basically every House election—there will undoubtedly be some surprises in 2026. Do Democrats flip a double-digit Trump seat, like they did in 2018 with Oklahoma’s 5th? Can House Republicans flip more than a few Biden-to-Trump seats?
It’s early, but for now, we’ve tried to outline some of the more obvious targets for either side.
J. Miles Coleman is an elections analyst for Decision Desk HQ and a political cartographer. Follow him on Twitter @jmilescoleman.
See Other Political Commentary by J. Miles Coleman.
See Other Political Commentary.
Related Articles

Rasmussen Reports is a media company specializing in the collection, publication and distribution of public opinion information.
We conduct public opinion polls on a variety of topics to inform our audience on events in the news and other topics of interest. To ensure editorial control and independence, we pay for the polls ourselves and generate revenue through the sale of subscriptions, sponsorships, and advertising. Nightly polling on politics, business and lifestyle topics provides the content to update the Rasmussen Reports web site many times each day. If it's in the news, it's in our polls. Additionally, the data drives a daily update newsletter and various media outlets across the country.
Some information, including the Rasmussen Reports daily Presidential Tracking Poll and commentaries are available for free to the general public. Subscriptions are available for $4.95 a month or 34.95 a year that provide subscribers with exclusive access to more than 20 stories per week on upcoming elections, consumer confidence, and issues that affect us all. For those who are really into the numbers, Platinum Members can review demographic crosstabs and a full history of our data.
To learn more about our methodology, click here.