Two New Swing Seats? Unpacking Utah’s (Possible) New Map
A Commentary By J. Miles Coleman
KEY POINTS FROM THIS ARTICLE
—In Utah, Republicans passed a new U.S. House map that could potentially be used next year, as the current map was ruled unconstitutional.
—Though the map Republicans passed retains four Trump-won districts, we would likely place two of those districts in competitive rating categories.
—The plaintiffs, who sued to have the original Utah map overturned, have submitted their own plans to a judge; both maps would almost certainly result in 3-1 GOP delegations.
—In Tennessee, the parties picked nominees for a TN-7 special election this week; we rate that contest as Likely Republican.
Utah redistricting: two swing seats?
Earlier this week, Utah’s mid-decade redistricting process passed an important milestone.
In late August, Judge Dianna Gibson ruled that a gerrymander that dated back to the 2022 elections violated the state constitution. On Monday, Republicans in the state legislature passed a replacement plan that will now head to Gibson’s courtroom. While it is possible Gibson could still reject the map, we are going to walk through the possible implications of Utah Republicans’ proposed map.
Map 1 compares the existing map to the version approved by legislative Republicans earlier this week (right click to enlarge).
Map 1: 2022 vs. possible 2026 Utah maps
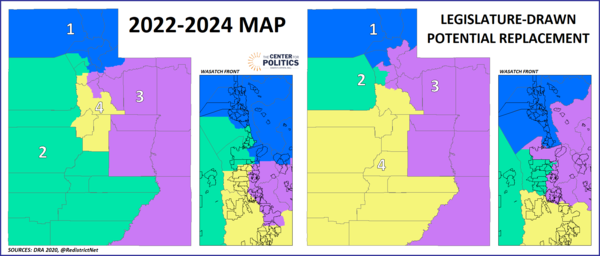
One reason the right map may look cleaner is because it splits fewer counties. Under the proposed new map, Salt Lake County, which has been split at least three ways since the 1992 elections, is only split between Districts 2 and 3. As in the old map, Utah County, which includes Provo and is the state’s second most populous county, is also split. Though it is hard to see in Map 1, the only other county split in the proposed new map is Davis County, which is immediately north of Salt Lake County—though UT-1 is otherwise only whole counties, a single precinct in the city of North Salt Lake was put into UT-3 to achieve 0 population variance between the districts.
In what is now their second attempt at a map, Republicans also were less aggressive about splitting municipalities: the proposed new map splits just three cities, which is down from about a dozen under the map that was in place in 2022 and 2024. For some reason, the city of Millcreek, an extreme example which is immediately south of Salt Lake City, apparently drew the ire of GOP mappers: the city of about 65,000 was quartered about evenly between all four districts. As with Salt Lake County overall, it would only be split two ways if the proposed new map took effect.
Getting into partisanship, as we suggested the last time we wrote about Utah redistricting several weeks ago, Republicans have refused to concede a blue-leaning Salt Lake County-only district. However, if Judge Gibson accepts this map and it is operative for 2026, Utah may feature two highly competitive districts. None of the proposed districts have backed Democrats in recent statewide elections, although some have come relatively close to doing so.
Visually, UT-3 would not be that much different from the district it replaces: it includes part of the urban Wasatch Front as well as much of the state’s western border—for outdoor enthusiasts, its geographically vast southeastern section includes two of the state’s “Mighty Five” national parks, Arches and Canyonlands. However, the changes along the Wasatch Front are key. Since the 1982 elections, when Utah gained its third district, Provo, the home of Brigham Young University, has been included within UT-3. Though Provo has become less red over the last decade or so, Trump still carried it by about 20 points last year. Under the map legislative Republicans submitted, UT-3 drops Provo and takes in all of Salt Lake City, which went almost 4-to-1 against Trump in both 2020 and 2024. As its holdings in Salt Lake County would increase from 22% to 37% of the county, UT-3 would become the most marginal district on the map: though Trump still carried it, his margin would have dropped from 19 points to about 2 points, according to Dave’s Redistricting App.
Though UT-3 drops Provo, its portion of Utah County still includes first-term Rep. Mike Kennedy’s home city of Alpine, so this would still be the most logical district for him to run in. Former Rep. Ben McAdams (D, UT-4), a Blue Dog who was the most recent Democrat to represent Utah at the federal level, is reportedly interested in a comeback effort—before his time representing a Trump-won House seat, he served as mayor of Salt Lake City.
The redrawn 2nd District includes the balance of Salt Lake County along with Tooele County. As with UT-3, the red lean of UT-2 erodes considerably, falling from a district that backed Trump by 20 points to one that he only caried by less than 7 points in 2024. We would probably start this district off as Leans Republican, although it is several points less red than the district that McAdams won in the 2018 blue wave, so it could become even more competitive. Aside from McAdams, there are several Democratic legislators from Salt Lake County who would likely take serious looks at the two marginal Trump-won seats if the legislature’s proposed map takes effect.
Aside from the partisan changes the proposed map would bring—namely, pushing two previously safe red seats on to the board—there might be some interesting maneuvering among Republicans in the delegation. Much of the Salt Lake County portion of the new 2nd comes from the current UT-4, held by GOP Rep. Burgess Owens—from what we can tell, Owens lives in Salt Lake County. Meanwhile, Rep. Celeste Maloy (R) currently holds the district labeled UT-2 but is from the southwestern corner of the state, which her district loses to UT-4.
The 4th District, which is already the reddest district in the state, becomes even more of a Republican pack as it adds territory around Washington County, in the southwest. The proposed UT-4 is the only one of the four districts that gave Trump more than 70% in both 2020 and 2024. The district’s deep red lean was also evident in last year’s gubernatorial race: it is the only district on the proposed map where Brian King, the Democratic gubernatorial nominee, finished third behind GOP Gov. Spencer Cox, who has tried to craft a postpartisan image, and then-state Rep. Phil Lyman, a further-right Republican from southern Utah who lost the primary to Cox but ran as a write-in in the general election.
Something that we’d expect to weigh on Maloy’s thinking is her last primary. After winning a 2023 special election, she only barely secured renomination for a full term. There was an ideological angle to that race, with Sen. Mike Lee (R-UT) backing a more conservative challenger, but there was also a geographical component—Washington County, near her home of Cedar City, went heavily against her and she was saved by the parts of her district closer to Salt Lake City. Owens, who has generally garnered higher scores from conservative interest groups than Maloy, would seem to be a better fit for UT-4. So, this is all to say that, under this map, it is possible that Maloy and Owens may run in the numerical successors to the seats that they currently hold, even if they may not actually live in those districts.
When we analyzed Texas Republicans’ mid-decade gerrymander over the summer, we used the 2018 Senate race as the Democrats’ statewide “high water mark.” In another red state, we can similarly view Utah’s 2022 Senate contest as Republicans’ “low water mark.” In 2022, the aforementioned Lee defeated independent Evan McMullin, who had some notoriety after faring relatively well in his home state of Utah as an anti-Trump independent presidential candidate in 2016, by a 53%-43% vote.
At a statewide level, Republicans’ 2022 gerrymander held up as intended: Lee carried all four districts by margins that were not too far off from the statewide result. As we alluded to earlier, the proposed map features districts that are more polarized: UT-2 and UT-3 gave McMullin margins of 3 and 9 points, respectively, while Lee’s margins in districts 1 and 4 ballooned.
Table 1: 2022 Utah Senate race by 2022 and potential 2026 districts
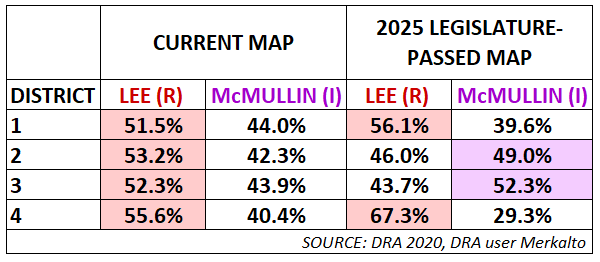
Obviously, McMullin’s numbers in districts 2 and 3 might be hard for candidates running with the Democratic label to achieve. But to actually flip those districts, the eventual Democratic nominee in UT-3 would only have to perform a couple of points better than Harris, although the nominee in UT-2 would have to perform decidedly more like McMullin than Harris (a 3-point win and a nearly 7-point loss, respectively).
In ruling against the Utah legislature earlier this year, Gibson sided with the plaintiffs who were challenging the existing map—in this instance, those plaintiffs are a coalition of civic and good government groups. The plaintiffs also submitted two of their own maps for Gibson to consider, although, from a ratings perspective, their maps would be more open-and-shut cases than what the legislature passed. Both plaintiff-drawn maps would make Salt Lake City the anchor of a clearly blue-leaning seat while the three other districts would be firmly red.
P.S. TN-7 special election nominees set
On Tuesday night, voters in Tennessee’s 7th District settled on their nominees for a Dec. 2 special election to replace now-former Rep. Mark Green (R), who resigned after the passage of the so-called “Big Beautiful Bill.”
The Republican primary initially looked highly competitive, as nearly a dozen candidates were on the ballot. But Matt Van Epps (R), who has connections to Gov. Bill Lee (R), was the beneficiary of a late Trump endorsement. Van Epps took an outright majority of the vote and carried nearly every county in the district.
Democrats, as it turned out, had the more hotly contested primary: all four candidates in the race took more than 20% of the vote. State Rep. Aftyn Behn, who represents Nashville and could have reasonably been called the most liberal candidate in the race, won with a 28% plurality. Aside from a narrow win in exurban Williamson County, Behn didn’t finish ahead in any of the district’s 13 other counties—in some primaries, being voters’ second choice in most places can be a winning strategy.
In any case, we are holding the December special election at Likely Republican. Democrats have, broadly, continued to punch above their weight in special elections this year, and our own analysis of two recent cases, VA-11 and AZ-7, suggests that college-educated voters tend to turn out at relatively high rates in special elections. On Tuesday, Republicans outvoted Democrats by a roughly 9-point margin, as about 37,000 ballots were cast in the GOP primary to 31,000 on the Democratic side. If Van Epps ultimately won by 9 points in a Trump+22 seat, that result would fit with other recent special elections. We might note, though, that Republicans will occasionally post an overperformance of their own in a special House election—in 2023, Maloy’s win in UT-2 was an example of this.
Aside from TN-7, there is also an upcoming November special election in the deep-blue TX-18, which is in the Houston area. Although, because Texas uses Louisiana-style jungle primaries for special elections, the race may go to a later runoff.
J. Miles Coleman is an elections analyst for Decision Desk HQ and a political cartographer. Follow him on Twitter @jmilescoleman.
See Other Political Commentary by J. Miles Coleman.
See Other Political Commentary.
Views expressed in this column are those of the author, not those of Rasmussen Reports. Comments about this content should be directed to the author or syndicate.
Related Articles

Rasmussen Reports is a media company specializing in the collection, publication and distribution of public opinion information.
We conduct public opinion polls on a variety of topics to inform our audience on events in the news and other topics of interest. To ensure editorial control and independence, we pay for the polls ourselves and generate revenue through the sale of subscriptions, sponsorships, and advertising. Nightly polling on politics, business and lifestyle topics provides the content to update the Rasmussen Reports web site many times each day. If it's in the news, it's in our polls. Additionally, the data drives a daily update newsletter and various media outlets across the country.
Some information, including the Rasmussen Reports daily Presidential Tracking Poll and commentaries are available for free to the general public. Subscriptions are available for $4.95 a month or 34.95 a year that provide subscribers with exclusive access to more than 20 stories per week on upcoming elections, consumer confidence, and issues that affect us all. For those who are really into the numbers, Platinum Members can review demographic crosstabs and a full history of our data.
To learn more about our methodology, click here.