The House: A Big Sort Lowers the Odds of a Big Wave
A Commentary By Kyle Kondik
KEY POINTS FROM THIS ARTICLE
— Two of the three major ingredients that went into the huge numerical House gains that the winning side made in the 2010 and 2018 midterms are not present for Democrats in 2026.
— One of those, however, is that the opposition party started those cycles with far fewer seats than the Democrats hold now, which is hardly a bad thing for them. But that should also inform our expectations about the size of the gain Democrats could make in 2026 and how it would compare to midterm history.
— The other is that the House is much more sorted along partisan lines now than it was in either 2010 or even 2018, meaning that the party control of House seats is better aligned with how districts vote at the presidential level. This level of sorting also likely helps explain why Republicans in 2022 were able to flip the House, but only made modest gains in doing so—and also why Republicans can plausibly argue that they could hold onto the House next year.
— If the House remains so sorted along presidential voting lines, it stands to reason that large numerical swings in House seats would become rarer, even as the House majority itself would often be up for grabs.
A very sorted House
Democrats may very well win the House majority next year, but some of the typical factors that have featured in recent big numerical seat gains for the non-presidential party are absent in this midterm. Namely, Democrats are starting from a high point of seats already (they won 215 in 2024), and the House is already very well sorted along partisan lines.
In recent midterms, we have seen some wild swings in the House. Specifically, 2010 and 2018 come to mind, as both were years when the House majority flipped to the non-presidential party. As part of those elections, the presidential party lost more than 33 seats, which is the average midterm seat loss for the presidential party since the Civil War. In other words, while midterm seat losses for the presidential party have been very common, the numerical seat loss for the presidential party in both 2010 and 2018 was especially large.
Those 2010 and 2018 waves produced such turnover for a variety of different reasons, but there were three overarching factors present in both elections:
1. A good political environment for the House minority party.
2. The majority party held a lot of obviously vulnerable seats, based on recent presidential results.
3. The non-presidential party was starting from a deep minority.
Factors 2 and 3 are somewhat interconnected. As part of presidential victories in 2008 and 2016, the Democrats and Republicans (respectively) built substantial House majorities in which they held a lot of districts that were, on paper, hostile to them. The midterms thus served a politically realigning purpose.
The Democrats in 2008 provide a dramatic example. Table 1 shows the distribution of the House seats that year based on presidential results. Barack Obama won 53% (rounded) of the national vote that year, and so seats where he got 52%-54% (again, rounded) of the vote (or R+1 or D+1, as categorized in the table) are in the middle of the table, while seats where Obama did better are higher on the table and where he did worse are lower on the table. We made our calculations by using district-level presidential results from the Downballot. For more information on how to interpret the tables and other details, see the note at the end of the article.[*]
Table 1: 2008 vs. 2010 in the House, based on 2008 presidential results
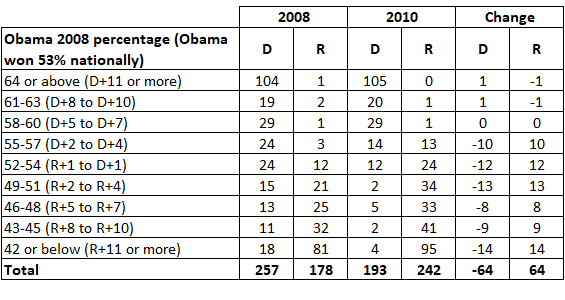
Two big things stand out. First of all, Republicans only won 178 seats in the 2008 election. That is more than 20 seats fewer than they have won in any other House election held since 1994, when Republicans won the House majority for the first time in four decades, ushering in a much more competitive era in the House. So Republicans were in an abnormally weak position. Additionally, Democrats were deeply overextended into districts where Obama had run worse than he did nationally: Democrats held 57 districts where Obama had won 51% of the vote (rounded) or less, so R+2 or greater. The lion’s share of the GOP’s net gain in 2010 (also shown in Table 1) came in these districts: Democrats only won 13 of these districts that year, a 44-seat net loss that accounts for two-thirds of the districts they lost in 2010. Republicans did also net an additional 22 seats in districts where Obama got between 52%-57% of the vote—so it’s not as if their only gains came in red turf—but that realignment fueled a large chunk of their overall gains. So Republicans were at a low ebb in 2008, and Democrats held a bunch of seats that they arguably had no business holding—particularly from the perspective of today, when red-state and red-district Democrats have become a rarity after being so ubiquitous before 2010.
The Democratic gains in 2018 were less dramatic, but they still won 41 more seats that year than they had won in 2016. Democrats, too, were at something of a low point in 2016, having won just 194 seats—one of just three times since the 1994 Republican Revolution that they had won fewer than 200 seats (2010 and 2014 were the other years). Table 2 shows the mix of seats in 2016 and then what changed in 2018—this is based on the map that was in place in 2018, so it takes into account a new House map created in Pennsylvania in advance of the 2018 election. It is indexed to Trump’s 2016 popular vote showing—he got 46% of the vote, so districts where he got 45%-47% of the vote are represented as D+1 to R+1, with more Republican-leaning districts above that midpoint and more Democratic-leaning districts below it.
Table 2: 2016 vs. 2018 in the House, based on 2016 presidential results
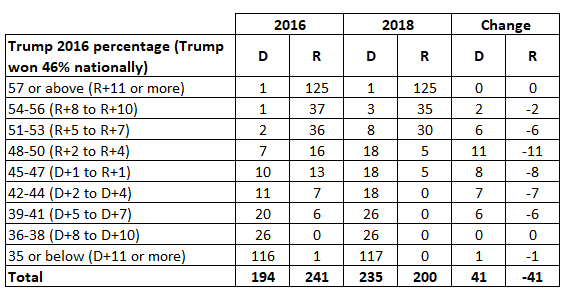
While Republicans did not hold nearly as many Democratic-leaning districts in 2016 as Democrats held Republican-leaning seats in 2008, Republicans still were defending 14 districts where Trump received 44% of the vote or less in 2016. They lost every single one in 2018. Democrats also made big inroads in districts where Trump got between 45%-50% of the vote, with about half (19 of 41) of their net gains coming from this group. Democrats won a smattering of redder districts where Trump got more than 50% of the vote, but their gains generally petered out past this point—and Democrats would lose many of these districts in 2020, as their majority was cut from 235 in 2018 to 222 in 2020.
After 2020 came a national redistricting cycle. Table 3 shows the distribution of seats based on Joe Biden’s performance in 2020, although the 2020 figures are for the lines in place in 2020, and the 2022 figures are based on the new lines (we tried to retroactively apply the 2022 map to the 2020 results, but the seat reapportionment made it too unwieldy). So the changes shown in Table 3 reflect not just the actual 2022 results, but also the changes made to the map in redistricting. Overall, Republicans flipped the House but only made modest numerical gains, netting nine seats and electing a 222-213 majority.
Table 3: 2020 vs. 2022 in the House, based on 2020 presidential results
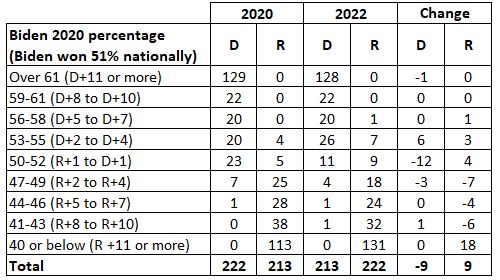
Unlike in 2010 and 2018, two of the three aforementioned factors that we see in big numerical waves were not present in 2022: Republicans were not starting at a big deficit (they already had won 213 seats in 2020, very close to a majority) and Democrats were not very overextended into clearly hostile turf: Notice that in 2020, Democrats held all of the districts where Biden got 56% of the vote or more, and Republicans held all but one of the districts where Biden got 46% of the vote or less: The exception was Rep. Jared Golden (D, ME-2), who has continued to hold a red-leaning district; Democrats actually won an extra seat from that broad category in 2022 thanks to former Rep. Mary Peltola’s (D, AK-AL) victory, but she would lose in 2024. Redistricting expanded the number of super-safe Republican districts, although for Republicans, the changes in the red-leaning districts basically canceled out, as they added 18 seats in the R+11 or more group but lost 17 in the R+2 to R+10 range. Republicans made modest gains in the R+1 to D+4 range by winning a handful of swing districts, but they only added one additional seat in the bluer categories, thanks to former Rep. Anthony D’Esposito (R, NY-4) winning a Nassau County-based seat that he would lose in 2024 despite it becoming much more competitive for president.
Here is what happened in 2024, with the districts sorted in the same manner as above by Trump’s showing:
Table 4: 2024 House districts by Trump performance
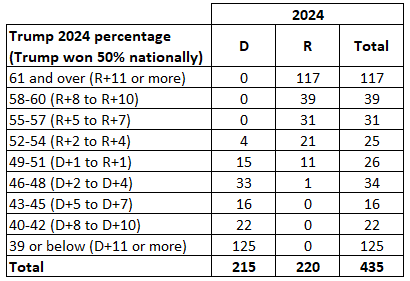
The House is extremely well-sorted. There are no Democrats in districts where Trump got 55% of the vote or more, nor are there any Republicans in districts where he got 45% of the vote or less. Only in the group of districts that best matched the presidential vote—the 50% to 52% Trump zone—is there a true amount of partisan diversity, with Democrats holding 15 districts and Republicans holding 11. Gains in that group would be key to a Democratic House majority, and if the national House vote shifts from a small Republican advantage (like we saw in 2022 and 2024) to a Democratic advantage of some size—something that seems reasonable to expect given midterm history—Democrats would be well-positioned to widen their edge among this group. That could be enough to flip the House right there, even as the already-sorted map gives Republicans a path to holding onto the majority themselves (they can plausibly target at least some of the Democrats in this category too, particularly if the environment isn’t as hostile to Republicans as 2018 was). On the other hand, if Democrats do have the wind at their back next year, seats in that R+2 to R+4 category—where Republicans currently hold 21 of 25 districts—could be quite vulnerable (note the healthy gains the opposition party made in that category in both 2010—the equivalent would have been D+2 to D+4 that year given that there was a Democrat in the White House—and 2018).
Overall, this sorted House map combined with the Democrats’ already-large number of seats for a minority party (215) means that we shouldn’t necessarily expect them to net a ton of seats next year even if political conditions are ideal.
If the House remains solidly sorted, we could fall into a two-year pattern where both House majorities and the seat swings between elections are small. But the thin margins of control would also mean that majorities would often be up for grabs.
However, the House staying sorted also assumes that the political alignment that’s become familiar in the Trump years endures. The 2028 presidential election could scramble the coalitions, either by changes to demographic voting patterns that leads to House members finding themselves on shaky ground (like we see with South Texas Democrats Henry Cuellar and Vicente Gonzalez, who retained their seats despite their districts moving to Trump), or a 2008-style presidential wave that also produces a giant House majority for one side or the other—which would then naturally include a lot of seats that would be vulnerable in the following midterm.
Note on methodology
[*] This article is based on research for a piece we ran in 2022, “The Kinds of Seats That Flip in Midterms.” The explanatory language below is largely borrowed from that piece:
The tables categorize House districts by presidential performance. We used whatever share of the vote the presidential winner received nationally as the midpoint for the tables, and then we included all the districts where the president did the same, a point better, or a point worse than he did nationally as the midpoint category (we used rounded numbers in all instances). Another term for this is what we call presidential deviation. Basically, this means how much more Democratic or Republican a district was compared to the nation in a given election, expressed in a whole number. So, for instance, Donald Trump got 50% nationally in 2024. A district where he got 52% would be R+2, and one where he got 48% would be D+2. These figures are also expressed in the tables. So the midpoint of each table is the R+1 to D+1 range (or 49% to 51% Trump in 2024).
We then looked at districts where the president did 2-4 points better or 2-4 points worse than he did nationally, and so on and so forth until we reached districts where the president did either more than 10 points better or more than 10 points worse than he did nationally. In recent years, those kinds of districts have not been plausible targets for the other party. And districts that are a bit more competitive than that often also aren’t plausible targets for the other side either, even in a wave. The district-level data we used to compile the tables are from the Downballot, which keeps an excellent history of presidential results by congressional districts.
Redistricting had no impact in the 2008 to 2010 discussion, because no maps changed between those years. In 2018, maps changed in Pennsylvania, but we were able to effectively apply those changes retroactively to our categorization of the 2016 results (so the 2016 list is based on the 2018 maps, which is why Republicans are characterized as defending a district in the most Democratic category—that is PA-5, which became way more blue in post-2016 redistricting and almost assuredly would have been won by Democrats had it actually been in effect in 2016). As noted above, we used the maps in place in 2020 to categorize that year’s results in Table 3, and then we used the maps in place for 2022 to categorize that year’s results.
Changes reflected in the tables compare the House elected in November of the presidential year to November of the midterm year.
Kyle Kondik is a Political Analyst at the Center for Politics at the University of Virginia and the Managing Editor of Sabato's Crystal Ball.
See Other Political Commentary by Kyle Kondik.
See Other Political Commentary.
Views expressed in this column are those of the author, not those of Rasmussen Reports. Comments about this content should be directed to the author or syndicate.
Related Articles

Rasmussen Reports is a media company specializing in the collection, publication and distribution of public opinion information.
We conduct public opinion polls on a variety of topics to inform our audience on events in the news and other topics of interest. To ensure editorial control and independence, we pay for the polls ourselves and generate revenue through the sale of subscriptions, sponsorships, and advertising. Nightly polling on politics, business and lifestyle topics provides the content to update the Rasmussen Reports web site many times each day. If it's in the news, it's in our polls. Additionally, the data drives a daily update newsletter and various media outlets across the country.
Some information, including the Rasmussen Reports daily Presidential Tracking Poll and commentaries are available for free to the general public. Subscriptions are available for $4.95 a month or 34.95 a year that provide subscribers with exclusive access to more than 20 stories per week on upcoming elections, consumer confidence, and issues that affect us all. For those who are really into the numbers, Platinum Members can review demographic crosstabs and a full history of our data.
To learn more about our methodology, click here.