How the New Catalist Report on 2024 Compares to the Exit Polls
A Commentary By Kyle Kondik and J. Miles Coleman
KEY POINTS FROM THIS ARTICLE
– A new report from the Democratic data firm Catalist provides a fresh look at the 2024 presidential election results.
– There are key differences among the two Election Night exit polls, from Edison Research and from VoteCast, and the Catalist report, but they by and large tell a similar story about the election.
– All three sources show Trump making big improvements compared to 2020 among young and nonwhite voters.
The post-election story on age, race, and education
Analyzing what happened in a presidential race takes place in stages.
Arguably—and, likely, increasingly—the analysis can begin even before the election, as a significant share of the electorate votes in the days and weeks before the actual Election Day, with some states providing fairly detailed information about those who have cast a ballot. Pre-election polling also gives us clues about how different subgroups may be changing compared to previous results.
Then there is the actual election, where we get nearly all of the results (even as some states—looking at you, California—take longer to report all of them). In addition to the actual results, there are exit polls that give us information about how different demographic groups voted.
For several election cycles, starting in 2004, major news organizations (called the National Election Pool) worked with Edison Research to create a single exit poll. That exit poll still exists, and the Pool consists of ABC News, CBS News, NBC News, and CNN. When people say “exit poll,” this is probably the one they are thinking of.
Since the 2018 election, though, there has been another version of an exit poll, as the Associated Press and Fox News broke off from the National Election Pool and worked with NORC at the University of Chicago to produce the VoteCast. Both the Edison exit poll and VoteCast are large-sample surveys that are then adjusted by the actual results.
In the weeks and months following the election, states certify their vote totals and eventually update their voter files. That allows for further and more granular analysis, which can take months to produce.
One of the reports incorporating the voter file analysis came out on Tuesday. Catalist, a Democratic data firm whose numbers are nonetheless respected by analysts across the political spectrum, released its much-anticipated “What Happened in 2024” report. (The Pew Research Center has also produced “verified voter” election analyses, and its 2024 report will be out in a month or so.) These two reports will probably be a more accurate source for demographic voting patterns and the composition of the electorate for 2024 moving forward, in large part because they take into account information (the voter files) that was not available to the Edison and VoteCast polls when they were conducted. As our friend Nathaniel Rakich of the now-unfortunately shuttered FiveThirtyEight put it about this Catalist report and the eventual Pew report, these reports will provide the “closest we will ever come to a definitive answer” to demographic voting questions in this past election.
So we thought we’d take a look at the Catalist report and see how it compares to the Edison and VoteCast analyses, both in terms of the makeup of the electorate and also how different kinds of groups voted. Specifically, we’re going to look at three important demographic features: age, race, and education and race. (There is plenty more in the report beyond these demographic features, and we’ll revisit this overall topic again, including when the Pew report is released.)
What follows are several tables that compare Edison, VoteCast, and Catalist findings about these three categories. The first table in a section shows the percentage of the electorate that each sub-group within a demographic category accounted for in both the 2020 and 2024 versions of the Edison exit poll, the VoteCast, and the Catalist report, along with how the percentage share of that group changed between the two elections, according to these analyses. The second table in each section shows the Republican popular vote percentage margin among these same groups in both 2020 and 2024. So in the results tables, a positive number means the Republican nominee (Donald Trump in each election) won the group, while a negative number means that the Democratic nominee (Joe Biden in 2020 and Kamala Harris in 2024) won the group. Likewise, a positive number in the “change” column in Tables 2, 4, and 6 means that Trump ran better with that group in 2024 than 2020; a negative number means that Harris did better in 2024 with that group than Biden did in 2020. Given Trump’s improvements from 2020 to 2024, it’s not surprising that the Catalist report found that the lion’s share of demographic groups swung right in this election. Republican pollster Patrick Ruffini helpfully compiled the changes in the Catalist report from 2020 to 2024 by various demographic groups into a single chart. Nearly every group analyzed, with the exception of varying categories of white women as well as older Black voters, swung toward Trump.
As you survey these tables, remember that Trump improved his national popular vote margin by 6 points from 2020 to 2024, going from losing by about 4.5 points in 2020 to winning by about 1.5 points in 2024. So groups that swung less than 6 points from 2020 to 2024 moved less than the national swing, while groups that swung more than 6 points moved more than the national swing.
With that, let’s look at what happened by age, race, and race/education:
AGE
While the individual numbers vary across the three analyses, something to note is that 18-29 year olds make up the smallest share of the presidential electorate of the four age brackets—roughly 15%. The 30-44 group is a little less than a quarter of the electorate, meaning that voters under 45 are only about 40% or perhaps a little less of the electorate. Meanwhile, voters 45 and over make up 60% or more of the electorate, with the 45-64 block likely making up a bigger portion than the 65+ group.
It is true that the Edison exit poll shows the 18-29 group dropping as a share of the electorate from 2020 to 2024 while the VoteCast shows younger voters gaining, but that’s probably just noise (remember, these are both polls, and we’re comparing two different iterations of the poll conducted four years apart in both instances). Catalist’s 18-to-29 share falls between that of Edison and VoteCast. That’s why we’ll just say “roughly 15%” to describe the young voter share in this election.
Table 1: Composition of electorate by age, 2020 vs. 2024

Source: Edison Research national exit poll for 2020 and 2024; Associated Press VoteCast for 2020 and 2024; Catalist “What Happened in 2024” report, which includes both 2020 and 2024 figures at this link. These sources apply to all six tables in this piece.
One of the big stories of the election, both in pre-election polling and the exit polls, was that Democratic performance dropped sharply with the 18-29 year old group. All three sources show that to varying degrees—notice that the drop from 2020 is clearly larger than that 6 point national baseline when comparing what these analyses reported in 2020 compared to 2024.
Table 2: Republican national margin by age, 2020 vs. 2024
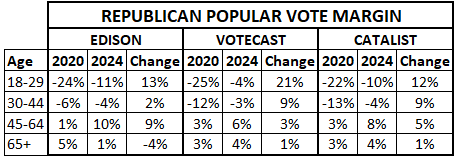
The margin among 18-29 year olds was one of the more notable differences between the Edison exit poll and VoteCast, with the former showing Kamala Harris winning the group by 11 points while the latter showed her winning that group by just 4. Catalist finds a 10-point margin, so it is basically the same as the Edison poll. One thing that is otherwise notable about the young voter findings is that all three sources do find Harris winning 18-29 year olds. That is not a universally-held opinion though, it seems: Democratic strategist David Shor said earlier this year that Trump “probably narrowly won 18- to 29-year-olds.” These three analyses don’t suggest that, although it’s also clear that Trump made very significant gains among the youngest age cohort in 2024, which directionally substantiates a lot of the pre-election polling that suggested Democratic problems with young voters.
Still, all three sources show that 18-29 year olds were the most Democratic age cohort in 2024, while all three also showed 45-64 year olds as the most Republican age cohort. Trump did win the 65 and over vote in all three analyses, although apparently just by roughly a few points—before the election, it seemed possible that Harris might win the 65 and over group. It does not appear as though that happened, although the group was collectively competitive and clearly shifted less toward Trump in 2024 than the youngest cohort did (and perhaps didn’t shift at all or even got a little less red).
RACE
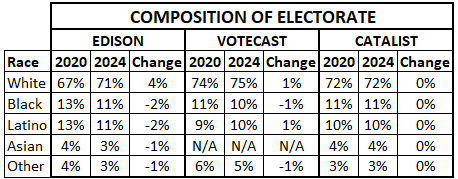
Broadly, the American electorate has gotten less white over the past several presidential elections—but all three of the analyses we’re considering for this article found a 2024 electorate that was, at minimum, no less white than 2020’s. All three analyses concluded that white voters made up somewhere a little over 70% of the 2024 electorate. Of the three, only Edison’s poll saw noticeable movement in the white composition of the electorate, as it jumps 4 percentage points from 2020 to 2024 (67% to 71%) in their poll. Meanwhile, VoteCast had the whitest universe of the trio, with whites making up about three-quarters of their electorate in both years that we consider. Catalist found the most consistent electorate across all ethnic groups between 2020 and 2024—they found a 72% white electorate in both years (and, in fact, all five of the racial category percentage shares were the same between both years in its analysis). Looking to other groups, all three analyses find that Black and Latino voters made up around 10% of the 2024 vote apiece. While we did not find public breakdowns from VoteCast for Asian voters, both Edison and Catalist found the Asian share of the electorate to be a little less than 5% for both years. The overall takeaway, for us, is that a presidential electorate that had been getting more racially diverse for several presidential elections in a row did not appear to get more diverse in 2024.
Table 3: Composition of the electorate by race, 2020 vs. 2024
Next, Table 4 examines how the racial categories voted between the last two presidential elections.
Table 4: Republican national margin by race, 2020 vs. 2024
All three analyses agree that Trump carried white voters by about 15 percentage points. One of the ironies that has been on our mind since the election is that Harris, as the first Black woman to run with a major party’s nomination, fared best (relatively speaking) with white voters—this also likely explains why Wisconsin, the whitest of the seven key Toss-up states, was both the state that shifted the least toward Trump from 2020 to 2024 and was the one that Harris came closest to winning. This is an observation that the three analyses, in aggregate, seem to back up. VoteCast and Catalist saw Trump improving 2 and 3 percentage points, respectively, with whites since 2020—much less than the 6 percentage point gain Trump saw nationally—while Edison saw the GOP margin among whites outright decline by a couple of percentage points.
It was not a surprise that Trump’s deficits were largest with Black voters. Trump still made some gains in this group, although there is some disagreement over the extent: Edison and Catalist show single-digit swings in his direction, while VoteCast shows a much larger 16-point improvement (but VoteCast also showed the biggest Democratic margin among Black voters in 2020, meaning the Democratic share had further to fall based on that benchmark).
On Election Night, the racial datapoint that stuck out most to us was Harris’s single-digit margin with Latino voters (both authors covered the election for CBS, which, as mentioned in the introduction, uses Edison’s data). As Table 4 shows, Harris’s 5-point margin with Latinos represented a 28-point decline from Biden’s margin in 2020. VoteCast and Catalist, meanwhile, agree that Trump’s improvement with Latinos was actually more in the mid-teens and that Harris carried the Latino vote by either high-single or low double-digits (although that degree of movement is still obviously quite significant). As mentioned earlier, while VoteCast doesn’t separate Asian voters out, there is agreement among Edison and Catalist that Asians swung rightward more than Blacks did but less than Latinos.
EDUCATION AND RACE
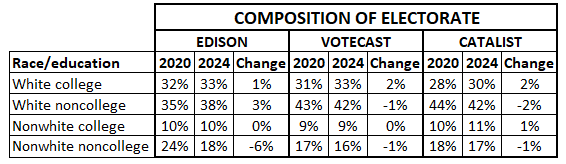
Polling in general can sometimes overstate the education level of an electorate because of the higher likelihood of someone with a college degree responding to a survey. The Edison exit poll, to its credit, has improved in terms of presenting a more realistic view of four-year degree holders in the electorate: The 2016 exit poll showed an even split of those who held a degree versus those who did not; their 2020 and 2024 exit polls showed closer to a little less than 60% noncollege to slightly more than 40% college split. That’s not because the electorate that showed up in 2020 and 2024 was way less educated than the 2016 electorate; rather, the exit poll got more accurate. Overall, the U.S. Census Bureau finds that just 35% of Americans over 25 have at least a four-year college degree, but the census also reports that self-reported voting rises with education level, so it makes sense that people with a degree would be overrepresented in the electorate—they just do not make up a full half of it. The VoteCast and Catalist data also report this roughly 60% noncollege/40% college split. Table 5 shows the share of the electorate divided into four parts: white college and noncollege, and nonwhite college and noncollege. While the specific sources differ a bit, roughly 30% of the electorate is white college, a little more than 40% is white noncollege, about 10% is nonwhite college, and a little less than 20% is nonwhite noncollege.
Table 5: Composition of age by college degree and race
Over what has become the Trump era in presidential politics, a general theme has been Trump’s strength among white noncollege voters and weakness among white college voters compared to previous Republican presidential nominees. An initial shift among these groups, from 2012 to 2016, helped Trump make the white working class Midwest/Industrial North redder, taking states like Iowa and Ohio off the board and eliminating the Democratic lean of battlegrounds Michigan, Pennsylvania, and Wisconsin. On the flip side, states with higher shares of college white voters, especially in their suburbs, moved to Democrats—Colorado and Virginia, for instance, shifted from swing states to clearly blue ones, while that dynamic also helped push Georgia, which was red-leaning since the 1990s, to Toss-up state status.
Table 6: Republican national margin by education and race, 2020-2024
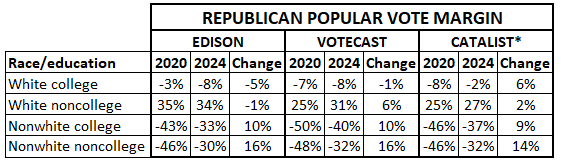
Note* Catalist results in this section reflect the two-party vote, not the all-party vote, although given the very small third-party vote in 2020 and 2024 (only about 2% in each election), this is a distinction without that much of a difference. Thanks to Catalist for providing us the aggregate two-party support numbers for nonwhite voters by education in both 2020 and 2024, which is not included in their published report. All of the other margins in this table (and Tables 2 and 4) are for all-party results for all three analyses.
The different sources tell different stories on race and education among whites, but they tell a very similar story on race and education among nonwhites.
Among white voters with a college degree, Edison found the Republicans slipping further from 2024, VoteCast saw essentially no change, and Catalist found Republicans gaining with the group by the same margin that Trump gained overall. Among white voters without a college degree, VoteCast found Republicans gaining 6 points, but the others found hardly any change. It is worth noting that one of the surprises, to us anyway, of 2024 was that Democrats stalled out or lost a little ground in highly-educated suburban areas like Northern Virginia and greater Philadelphia and Detroit, among many other places. That perhaps bolsters the Catalist finding that Democrats lost some vote share among white college-educated voters, although these areas often have a fair amount of racial diversity, too, so there are a number of different demographic ingredients that went into either Harris stagnating or Trump outright improving in these kinds of places.
Setting aside the white voter changes, we see that the improvement for Trump among nonwhite voters both with and without a college degree was more of a driver of the overall shift in the popular vote, as all three sources showed the Democratic margin among nonwhite college-educated voters dropping about 10 points and the Democratic margin among nonwhite noncollege voters dropping about 15 points (all three sources are very consistent on the size of the shift among both groups, even if their starting points in 2020 differed a bit). This adds some backing to the idea of American politics splitting increasingly on educational lines, although it’s also fair to note that the education gap is far wider among whites than nonwhites (at least for now), and that whites in total are still clearly a Republican-leaning group while nonwhites collectively are still clearly a Democratic-leaning group, even as individual subgroups have changed quite a bit recently.
Conclusion
At least on these demographic features, the Catalist report does not dramatically alter what the two exit polls told us about the election: Trump gained to varying degrees among most groups, with young voters and nonwhite voters leading the way. There are differences among the three analyses but they tell similar stories, and those stories are reinforced by some of the post–election analysis the Crystal Ball has done about the results and trends at the county and congressional district level (and that contributors to our forthcoming book on the 2024 election, Campaign of Chaos: Trump, Biden, Harris, and the 2024 American Election, coming in July, will analyze further).
Kyle Kondik is a Political Analyst at the Center for Politics at the University of Virginia and the Managing Editor of Sabato's Crystal Ball.
J. Miles Coleman is an elections analyst for Decision Desk HQ and a political cartographer. Follow him on Twitter @jmilescoleman.
See Other Political Commentary by Kyle Kondik.
See Other Political Commentary by J. Miles Coleman.
See Other Political Commentary.
Views expressed in this column are those of the author, not those of Rasmussen Reports. Comments about this content should be directed to the author or syndicate.
Related Articles

Rasmussen Reports is a media company specializing in the collection, publication and distribution of public opinion information.
We conduct public opinion polls on a variety of topics to inform our audience on events in the news and other topics of interest. To ensure editorial control and independence, we pay for the polls ourselves and generate revenue through the sale of subscriptions, sponsorships, and advertising. Nightly polling on politics, business and lifestyle topics provides the content to update the Rasmussen Reports web site many times each day. If it's in the news, it's in our polls. Additionally, the data drives a daily update newsletter and various media outlets across the country.
Some information, including the Rasmussen Reports daily Presidential Tracking Poll and commentaries are available for free to the general public. Subscriptions are available for $4.95 a month or 34.95 a year that provide subscribers with exclusive access to more than 20 stories per week on upcoming elections, consumer confidence, and issues that affect us all. For those who are really into the numbers, Platinum Members can review demographic crosstabs and a full history of our data.
To learn more about our methodology, click here.