A Post-Memorial Day Status Report
A Commentary By Kyle Kondik
Where things stand in the battles for Congress and the governorships
KEY POINTS IN THIS ARTICLE
— Both Democrats and Republicans have about equal odds of winning the House majority.
— Republicans remain clearly favored in the battle for Senate control.
— Democrats should start 2019 with at least a few more net governorships than they hold now.
Checking in on 2018’s big picture
In a bygone political era, the symbolic end of summer — Labor Day — denoted the unofficial start of the campaign season. In our current era, one might be tempted to say that the symbolic start of summer — Memorial Day — now represents the campaign season kickoff, though American politics is in a state of perpetual campaigning. As soon as one campaign concludes with an election, candidates for the next election start to emerge. That will be the case after this November’s election, when one would expect the battle for the Democratic presidential nomination to begin in earnest.
Still, the effective start of summer offers an opportunity to assess where the races for the House, Senate, and governorships stand. So we thought we’d offer brief updates on the state of play.
The race for the House
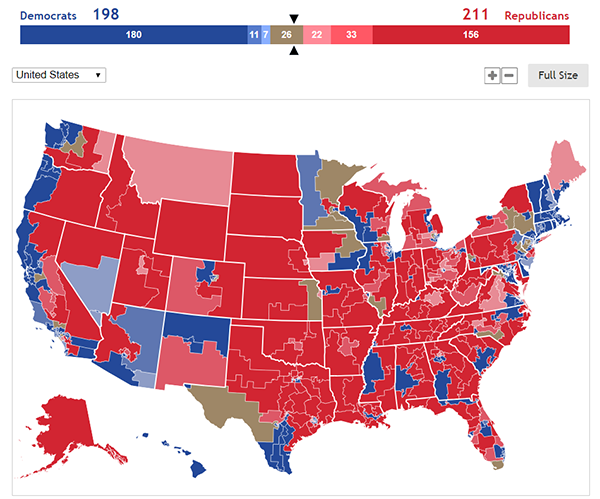
Map 1: Crystal Ball House ratings
Source: Map is reprinted from 270towin.com
We have written a lot about the House recently, so those interested in a more in-depth assessment can check out some of our past pieces. But we’ve held at roughly 50-50 odds of a House flip for months. In a nutshell, Democrats have historical advantages: Since the Civil War, the president’s party has lost ground in 36 of 39 midterms, with an average loss of 33 seats. In the shorter timeframe of the post-World War II era, the president’s party has lost an average of 26 seats per midterm. The Democrats need to net 23 seats to win the House.
That said, the Republicans have advantages of their own. While some of the Republicans’ gerrymandering advantages have been reduced through court-ordered maps in Florida, Pennsylvania, and Virginia, the overall House map still leans Republican — the median House seat measured by 2016 presidential margin, NE-2, is about four percentage points to the right of the national margin. Republican gerrymanders in states like Michigan, North Carolina, Ohio, and Wisconsin endure (though a court order forced a modification in the Tar Heel State), making it challenging for Democrats to net House seats in these competitive states.
Democrats do benefit, on balance, from an unusually large number of open seats. At least 59 districts — 39 held by Republicans, 20 held by Democrats — will not feature an incumbent running for reelection, the second-highest total of open seats in the postwar era. Democrats will need to net a substantial number of seats from the open districts, probably a third or more of the 23 seats they need to flip the House.
The Democratic lead in the House generic ballot polling average probably will need to be in the high single digits for Democrats to really feel good about their chances in the fall. The Democrats’ edge is currently short of that, but it has been in that range for much of the rest of the cycle.
Overall, our ratings show 211 House seats at least leaning to the Republicans, 198 at least leaning to the Democrats, and 26 Toss-ups (24 held by Republicans, just two held by Democrats). Splitting the Toss-ups evenly would produce a 224-211 Republican House majority, or a net gain of 17 for the Democrats from the 194 seats they won in 2016. But if the election breaks toward the Democrats, as midterms often (but not always) do for the opposition party, one would expect their gains to be north of that.
The race for the Senate
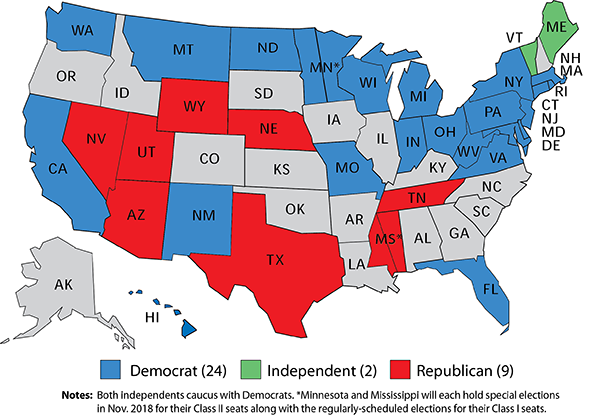
Map 2: 2018 Senate races shaded by current party control
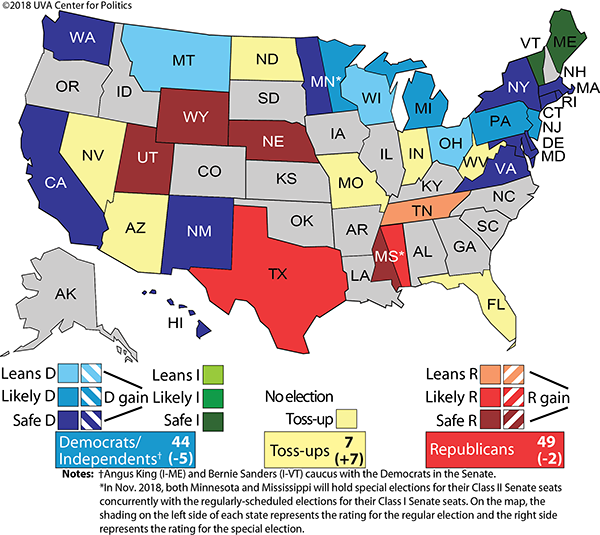
Map 3: Crystal Ball Senate ratings
Could Democrats win the Senate? Yes. Is the race for control a Toss-up? No. Republicans remain substantial favorites to retain the Senate majority.
The reason is that the Senate map is so bad for Democrats. Even though the party that doesn’t hold the White House typically makes up ground in the Senate, just like in the House, the non-presidential party has arguably never been so disadvantaged on a midterm Senate map as the Democrats are on this one. That’s particularly true if one counts the two independents running for reelection this year as Democrats, which is reasonable considering that Sens. Angus King of Maine and Bernie Sanders of Vermont caucus with the minority party. Thus, Democrats are defending 26 of the 35 Senate seats being contested this year, including 10 seats in states that President Donald Trump won in the last presidential election. If one uses such seats as a proxy for the most vulnerable Democratic-held Senate seats — a reasonable metric — then almost all of the most vulnerable Senate Democrats are on the ballot this year. The only two Trump-state Senate Democrats who are not on the ballot this year are Sens. Doug Jones (D-AL) and Gary Peters (D-MI). Peters convincingly won even in the bad Democratic year of 2014; Jones should have a very difficult race for a full term in 2020 after winning a special election last December. Meanwhile, there are only three Republican senators that hold seats in states Hillary Clinton won, and of those, only one — highly vulnerable Sen. Dean Heller (R-NV) — is on the ballot. The other two are Sens. Cory Gardner (R-CO) and Susan Collins (R-ME), both of whom are up for reelection in 2020. That Democrats can hold a 12-3 edge in “crossover” state senators and not hold the majority speaks to the Republican lean of the Senate: The median Senate seat by presidential performance would be the average of Arizona and North Carolina, or a seat that Trump won by about 3.5 points, so about 5.5 points to the right of the nation in terms of the most recent presidential results.
Jones’ special election victory at the end of last year got the Democrats within range of the Senate majority by narrowing the GOP’s Senate edge to 51-49. So the clearest path for the Democrats is to hold everything they have and net two additional seats, most likely the Toss-up seats in Arizona and Nevada.
Our ratings put 11 Senate seats in the Toss-up and Leans columns. Democrats need to win 10 to take control, in addition to holding all of the other seats we currently rate as Likely or Safe Democratic.
That remains a heavy lift for Democrats. At the same time, none of the Democratic Senate incumbents have worse that 50-50 odds. But, as one Democratic source stressed to us earlier this cycle, even if the Democrats are having a good cycle, most of these races will still be raging in October. If Democrats truly have a good chance to take the Senate, that might not become clear until very late in the cycle. Conversely, the Republicans could net seats, which would give them a buffer when they defend lopsided, Republican-dominated Senate maps in 2020 and 2022.
Our best guess? A lot of close and competitive Senate races but perhaps not much net change either way.
The race in the states
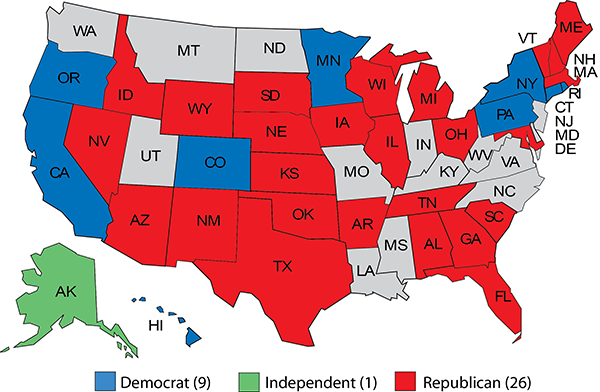
Map 4: 2018 gubernatorial races shaded by current party control
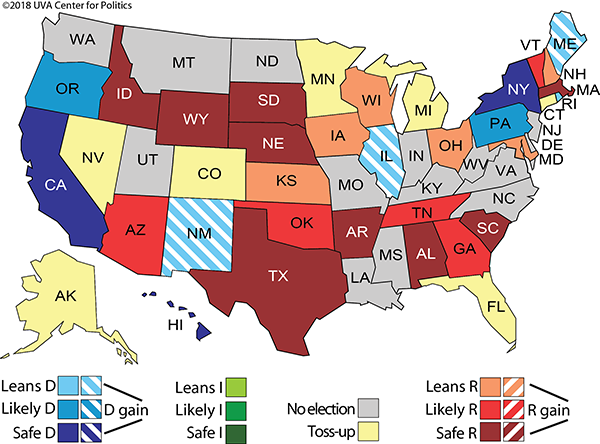
Map 5: Crystal Ball gubernatorial ratings
Republicans hold a 33-16-1 edge over the Democrats in state governorships. Of the 36 governorships on the ballot this year, Republicans are defending 26 and the Democrats are only defending nine, or the exact opposite of the level of party exposure in the Senate. An independent, Gov. Bill Walker of Alaska, is also on the ballot.
Because of the level of exposure for Republicans in the governorships, it would be shocking if the Democrats didn’t net at least some governorships. Our current ratings show them favored to pick up three: Illinois, Maine, and New Mexico. Alaska is a Toss-up and probably represents the Republicans’ best chance to pick up a governorship. There are six other Toss-ups, all of which are open seats: Democrats are defending Colorado, Connecticut, and Minnesota, while Republicans are defending Florida, Michigan, and Nevada. We have previously suggested that the winner of this year’s gubernatorial elections probably will be the party that wins a majority of these five big states that appear competitive: Florida, Illinois, Michigan, Ohio, and Pennsylvania. Republicans currently hold all but Pennsylvania, where Gov. Tom Wolf (D) remains a favorite over the newly-minted Republican nominee, state Sen. Scott Wagner.
Democrats also will almost certainly pick up state legislative seats this year after losing so many over the course of Barack Obama’s presidency (close to 1,000 total). The Democratic losses under Obama were large but hardly unprecedented: On average, the presidential party has lost more than 300 state legislative seats nationally in postwar midterms. That sounds like a lot, and it is, although there will be 6,069 state legislative seats on the ballot this November, the lion’s share of the 7,383 total, according to Ballotpedia. Still, the Republicans gained so much ground in state legislatures in the Obama years that the Democrats may have a hard time picking up many state legislative chambers (Tim Storey of the National Conference of State Legislatures noted some of the chambers in play for the Crystal Ball earlier this year).
The bottom line at the state level is that the Democrats will gain some ground. It’s just a matter of where they make gains, and how substantial those gains are.
Kyle Kondik is a Political Analyst at the Center for Politics at the University of Virginia.
See Other Political Commentary by Kyle Kondik
See Other Political Commentary
Rasmussen Reports is a media company specializing in the collection, publication and distribution of public opinion information.
We conduct public opinion polls on a variety of topics to inform our audience on events in the news and other topics of interest. To ensure editorial control and independence, we pay for the polls ourselves and generate revenue through the sale of subscriptions, sponsorships, and advertising. Nightly polling on politics, business and lifestyle topics provides the content to update the Rasmussen Reports web site many times each day. If it's in the news, it's in our polls. Additionally, the data drives a daily update newsletter and various media outlets across the country.
Some information, including the Rasmussen Reports daily Presidential Tracking Poll and commentaries are available for free to the general public. Subscriptions are available for $4.95 a month or 34.95 a year that provide subscribers with exclusive access to more than 20 stories per week on upcoming elections, consumer confidence, and issues that affect us all. For those who are really into the numbers, Platinum Members can review demographic crosstabs and a full history of our data.
To learn more about our methodology, click here.
