Wisconsin 2024: Not Critical But Still Crucial
A Commentary By J. Miles Coleman
KEY POINTS FROM THIS ARTICLE
— Though she still lost it by less than a percentage point, Wisconsin was Kamala Harris’s best state out of the 7 that we rated as Toss-ups during the election.
— In the traditionally red WOW counties around Milwaukee, Harris gained votes, but fewer than she would have liked.
— Though it is still a Democratic bastion, Donald Trump saw some of his biggest vote gains in Milwaukee County.
— Much of Trump’s margin in the state came from doing just a little bit better across the board in 2024 than he did in 2020.
— In the northeastern part of the state, Harris held up relatively well in the BOW counties, and several cities in that region will be worth watching going forward.
Wisconsin in the 2024 presidential election
With the year winding down, it seems a perfect time to revive what has sometimes been a Crystal Ball holiday-time tradition: dedicating an edition of the newsletter to Wisconsin.
On one level, Wisconsin was not much different than the other two Industrial North Toss-up states: as with Michigan and Pennsylvania, after going for Donald Trump in 2016 and then for Joe Biden in 2020, it voted for Trump this year by an even larger margin than what he got during his first run.
But unlike the last two presidential elections, Wisconsin was not the tipping point state this year—that distinction fell to Pennsylvania. So, while it was not the most critical state in the election, it was still, to use parlance popularized by reporter Dave Weigel, one of the most crucial.
Another key difference this year had to do with the partisan order of the 7 Toss-up states. After ranking as Biden’s third-narrowest win of the lot in 2020, Wisconsin was the Toss-up state that Harris came closest to carrying. Part of the reason could be demographic: as Trump’s gains disproportionately came from minority voters, Wisconsin, the whitest swing state, was relatively less impacted. At a larger level, Wisconsin found itself left of the nation as a whole—a position it hadn’t been in since the Obama years—after being nearly 4 points right of the national popular vote four years ago.
In what follows, we are going to take a detailed look at some of the dynamics that were at play in Wisconsin this year, and we may do the same for other key 2024 states in future editions.
So, how did Trump flip Wisconsin? Well, the simple (if somewhat facetious sounding) explanation is that not that much had to change from 2020.
Wisconsin was the third-closest state by raw vote margin four years ago, only behind Arizona and Georgia. Trump’s 49.6%-48.7% victory over Harris in the state fits cleanly within the state’s recent electoral history: aside from the Obama elections, it is the only state that has been decided by less than a percentage point in every election since 2000 (it was also the only state that, during that same span, never gave its winner a majority of the vote).
Statewide, Wisconsin cast 3,422,918 votes in the 2024 presidential election, which was a roughly 125,000-vote increase over 2020. It was also the only Industrial North Toss-up state where both major-party nominees added votes to their side’s 2020 totals, although, importantly, the gains were not even: Trump added 87,442 votes to Harris’s 37,363. That 50,079-vote net gain for Trump enabled him to overcome his 20,682-vote deficit from four years ago.
Harris netted votes in 6 of the state’s 72 counties. Although the Democratic percentage margin was down slightly there, Harris’s biggest gain came in Madison’s deep blue Dane County, where she netted about 7,200 votes. Next, the red lean of the traditionally red “WOW” counties lessened somewhat this year, although probably not by as much as Democrats would have wanted. Trump’s aggregate percentage margin out of Waukesha, Ozaukee, and Washington counties fell from 23 points to 22 points, and Harris netted 2,705 votes out of the trio.
The two other counties where Harris gained were located outside of the state’s main population centers. In the northwest, she netted 393 votes in Eau Claire County. In the northeast, Door County staked out a position left of the state this year: as Harris added to Biden’s percentage margin there, she also netted 174 votes. Though we flagged Door County as a likely state bellwether back before the election, we did suggest that its touristy character made it somewhat unique, and that given its size (it cast just over 20,000 votes this year), statewide candidates may be right to chase larger counties.
Meanwhile, Sauk County, which sits just north of Madison’s vicinity, was a county that we floated as another possible bellwether—and it proved to be more typical of the state this year than Door County did. As Trump netted 1,241 votes there, he flipped it, making it the only county that voted with the state in all three elections since 2016 (down the ballot, it was also the only Trump-won county that voted for Democratic Sen. Tammy Baldwin).
Going down in to more detail, Map 1 considers the net change in raw vote margins by county subdivision (this is a catch-all term we are using to encompass the state’s cities, villages, and towns).
Map 1: Wisconsin net vote change, 2020 to 2024
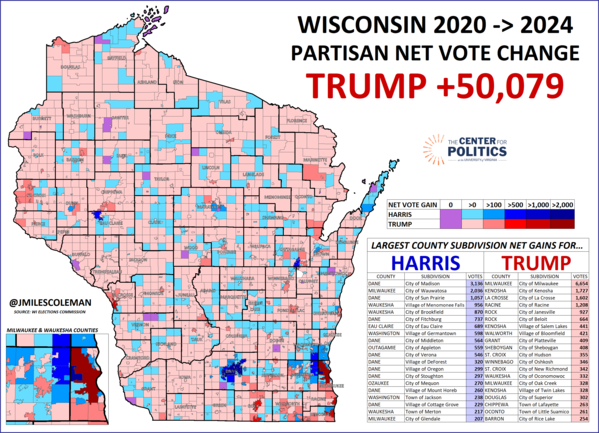
Something that Map 1 makes obvious is how Trump’s across-the-board gains in smaller county subdivisions added up. About 70% of the state’s county subdivisions that cast votes—1,327 out of almost 1,900—gave Trump a net gain of between 1 and 100 votes (these show up as the lightest shade of red on the map). Trump’s gains across those places, though they were small at the individual unit level, were more than enough to cancel out Harris’s gains from all the blue subdivisions on Map 1. Put somewhat differently, if Trump had only matched his 2020 performance across the 1,327 lightest red subdivisions, he would have still carried the state, although his total margin would have only been about 9,000 votes, as opposed to his actual 29,000-vote margin.
Moving to more populous areas, Trump’s strength in mid-sized cities across the state is also evident on Map 1. Trump netted more than 1,000 votes apiece out of Racine, Kenosha, and La Crosse, while other county-seat cities, such as Janesville, Oshkosh, and Sheboygan, each saw Trump’s advantage increase by at least several hundred votes compared to his 2020 showing. With the exception of Kenosha, Trump lost ground in all of those cities from 2016 to 2020.
Finally, Milwaukee County, the state’s largest county, also accounted for Harris’s heaviest net vote loss. Map 2 focuses solely on Milwaukee County.
Map 2: Milwaukee County, net vote change 2020 to 2024
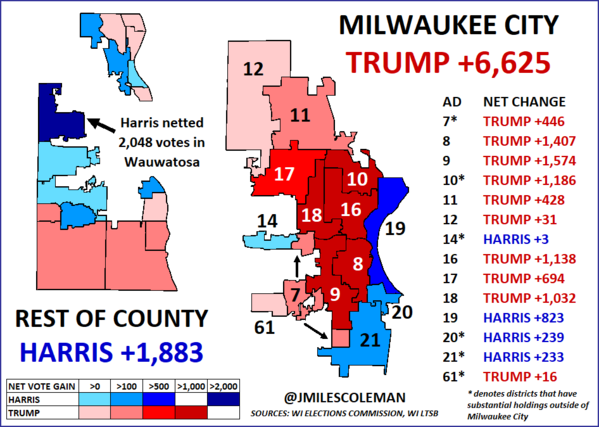
While Harris’s 68%-30% percentage margin there was down only marginally from Biden’s 69%-29%, her raw vote margin declined by close to 4,800 votes. Still, there were some diverging trends within Milwaukee County. Within the city of Milwaukee itself, which cast a small majority (53%) of the county’s vote, Harris’s net loss was 6,654 votes. But the rest of the county drifted slightly leftward from 2020: Harris added about half a percentage point to Biden’s margin, carrying it by 17.3%, while netting almost 1,900 votes.
We may note that Harris’s gain throughout the balance of the county was entirely due to Wauwatosa, which is in the northwestern part of the county and is one of its larger municipalities (although, of course, in terms of population, Milwaukee City is in a league of its own). Harris carried Wauwatosa by 2,048 more votes than Biden did, and upped the Democratic percentage margin from 66%-32% to 69%-29%. With that, 2024 represents the only presidential election that we can readily find data for where Wauwatosa voted more Democratic than Milwaukee County as a whole—we happened to have a 1964 map handy, and sure enough, showing how much the landscape has changed there, Barry Goldwater would have carried it comfortably.
Map 2 also breaks down Milwaukee City by state Assembly district—being the largest city in the state, a little extra detail seems fair. Overall, the city is split among 14 assembly districts, with 8 being entirely, or mostly, within its borders, while it contains fragments of 6 others. To be clear, our breakdowns here consider the court-approved districts that became operative this cycle.
Nearly half of Harris’s 6,654 net vote loss in the city came from the pair of Assembly Districts 8 and 9, which are both majority-Latino by composition. The movement over the past few cycles in AD-8 has been especially noticeable: in percentage terms, Harris’s 46-point margin there was down nearly 20 points from Hillary Clinton’s 65-point margin. Just across the Milwaukee River from AD-8, AD-19 was a relatively strong district for Harris. AD-19 hugs nearly all the city’s coastline on Lake Michigan and is almost 80% white—Harris netted 823 votes there. Districts 11, 12, 16, 17, and 18 are all at least mostly within the city and are majority Black. While their movement wasn’t as drastic as ADs 8 and 9, it probably wasn’t what Democrats were looking for, either: those 5 districts, collectively, swung 2 points to Trump and Harris had an average net loss of 665 votes per district.
While we’ve already talked about the WOW counties, the BOW counties are also an electorally critical region of the state. Beginning about 80 miles north of Milwaukee on Interstate 41, this group consists of Brown (Green Bay), Outagamie (Appleton), and Winnebago (Oshkosh) counties. In recent elections, this trio has combined to cast a little over 10% of the state’s total vote.
All three of the BOW counties lean Republican, although successful Democratic campaigns can usually hold the GOP percentage margin to within single digits in each. While Harris lost Outagamie, the reddest of the BOW counties, by 10.2%, the group’s topline result was almost unchanged from 2020: Harris took the same 45.4% share that Biden got, while Trump’s share inched up by less than half a point, from 52.6% to 53.0%. If the BOW counties’ swing was applied statewide, Harris would have carried Wisconsin, so she held up fairly well in this pocket of the state.
In terms of their raw vote movements on Map 1, while Trump netted about 2,300 votes out of the trio, the BOW counties offered a little “something for everyone.” While Green Bay is the most populous city in the area, Trump’s largest city-level net gain came in Oshkosh, where he picked up 346 votes—Oshkosh also anchors Winnebago County, which is typically the least red of the BOW counties. Meanwhile, Trump’s largest city-level net loss came in the reddest of the three counties: He lost 556 votes in Appleton, the seat of Outagamie County.
In Brown County, Green Bay was the state’s most static major city: from 2020 to 2024, it moved just 58 votes in Trump’s direction. While Green Bay is roughly two-thirds white by composition, 8 of its 51 wards have at least a 40% Latino population; though Harris still carried them, her 176-vote loss among those wards more than accounted for the citywide shift. Going forward, Green Bay’s closer-in suburbs will be places to watch in statewide races. A few miles south of Green Bay proper, De Pere was the most populous Trump-to-Harris county subdivision in the state (there were only 7 others in that category).
On the subject of the Latino vote, one of the results that prompted some head-scratching, at least at first glance, was in western Wisconsin. In Trempealeau County, which is firmly Obama-to-Trump territory, Harris netted votes in the city of Arcadia. That result could be notable enough on its own, but at 63% Latino, Arcadia is the state’s most heavily Latino city by composition. Since the 2000 census, its population has jumped from about 2,400 up to 3,740, although in recent presidential elections its vote count has been down from the early 2000s. What gives? Well, most of its Latino residents are likely non-citizens who work agricultural jobs, so the city’s actual electorate is probably much whiter. This is a dynamic that we often associate with places like California’s Central Valley and west Texas, though given western Wisconsin’s agricultural character, a result like Arcadia’s would make perfect sense.
Another notable result came in close-by Vernon County. According to Alex Chueh, a sharp observer who frequently finds valuable data nuggets from northern tier states, of the counties that are at least 95% white by composition, it was Harris’s best in the nation (although she still lost it by 8 points). Going forward, Republicans may have some room to grow in places like this, as Vernon County is probably bluer than its demographics would suggest.
Ending our tour of the state in the northwest, over the past decade, St. Croix County, which is in the Twin Cities media market, has been one of the state’s fastest-growing counties. Trump’s 2,658-vote net gain in the county was his fourth-largest in the state, and his largest outside of the Milwaukee metro area. A handful of county subdivisions in the western half of the county—several of which, according to Redistricter, have majorities that are not native to Wisconsin—gave Trump solid raw vote gains. This is the type of place where Democrats theoretically should have room to grow, but they fell back in 2024.
Looking forward to next year, Wisconsin will still be front-and-center for us (well, it always basically is, anyway): in a few months, it will be the scene of another state Supreme Court race. This is one of the key races to watch across the country in the 2025 calendar year, as it will have considerable implications for the court’s ideology—liberals, who just won a 4-3 majority last year, will be defending one of their own seats. So, we’ll very likely have more analysis and notes on the state coming down the line shortly.
In the meantime, perhaps for some holiday reading, we would suggest a recent Substack article from Chueh. After wrapping up a multi-state sweep through the Midwest, he compiled 40 observations from the region. While Alex’s ethnography does not touch too heavily on politics, we feel it provides some useful context and fits nicely with some of our writings (and it is also just an entertaining read).
J. Miles Coleman is an elections analyst for Decision Desk HQ and a political cartographer.
See Other Political Commentary by J. Miles Coleman.
See Other Political Commentary.
Views expressed in this column are those of the author, not those of Rasmussen Reports. Comments about this content should be directed to the author or syndicate.
Related Articles

Rasmussen Reports is a media company specializing in the collection, publication and distribution of public opinion information.
We conduct public opinion polls on a variety of topics to inform our audience on events in the news and other topics of interest. To ensure editorial control and independence, we pay for the polls ourselves and generate revenue through the sale of subscriptions, sponsorships, and advertising. Nightly polling on politics, business and lifestyle topics provides the content to update the Rasmussen Reports web site many times each day. If it's in the news, it's in our polls. Additionally, the data drives a daily update newsletter and various media outlets across the country.
Some information, including the Rasmussen Reports daily Presidential Tracking Poll and commentaries are available for free to the general public. Subscriptions are available for $4.95 a month or 34.95 a year that provide subscribers with exclusive access to more than 20 stories per week on upcoming elections, consumer confidence, and issues that affect us all. For those who are really into the numbers, Platinum Members can review demographic crosstabs and a full history of our data.
To learn more about our methodology, click here.