Redistricting in America, Part Six: The Great Lakes
A Commentary By Kyle Kondik and J. Miles Coleman
Democrats will try to wring a bit more out of Illinois, while divided government, judges, and new redistricting methods cloud the outlook elsewhere.
KEY POINTS FROM THIS ARTICLE
— This week, we’re looking at redistricting in seven Midwest/Great Lakes states: Illinois, Indiana, Michigan, Minnesota, Ohio, Pennsylvania, and Wisconsin.
— The highly competitive region was a collective nailbiter for president, and Republicans hold an overall House edge there, though not as large as earlier last decade.
— Illinois is really the only large state where Democrats clearly should have unfettered gerrymandering power, but with a 13-5 edge already and one seat needing to be eliminated, they don’t have a ton of room to grow. But Democrats also will try to solidify some of the seats they already have.
— Divided government in Minnesota, Pennsylvania, and Wisconsin could very well mean courts have to get involved, while Michigan and Ohio are implementing new redistricting systems.
Redistricting in the competitive Great Lakes
Let’s first start with an apology to Pennsylvania: yes, we know you are not actually part of the Midwest, as properly defined. The Keystone State is typically part of the Northeast.
However, for political purposes, Pennsylvania belongs in the same category as several other states that at least partially touch the Great Lakes and are considered part of the Midwest: Illinois, Indiana, Michigan, Minnesota, Ohio, and Wisconsin.
Together, these seven states still represent a great presidential battleground, particularly in recent years. In 2004, Ohio was the decisive state in reelecting George W. Bush, even as he lost five of these other states in the process (holding only the Buckeye State and Indiana, consistently the most Republican state in the competitive Midwest). Four years later, Barack Obama swept all seven states, including Indiana, in his impressive national victory. In 2012, Obama held all but the Hoosier State as part of a smaller win. In 2016, Donald Trump performed extremely well in the region, with a 78,000-vote combined margin in Michigan, Pennsylvania, and Wisconsin the key to his win. In 2020, Joe Biden recaptured that trio, albeit narrowly, which played a vital role in his victory. While Biden won five of the seven states, the collective vote in the region was just 49.9%-48.3% for Biden.
In a nation where the number of truly competitive states has been on the decline over the past several decades, the Great Lakes/Midwest states stand out for their vital swing role.
In the last decade, the seven states were almost all gerrymandered. Republicans won major 2010 victories in Indiana, Michigan, Ohio, Pennsylvania, and Wisconsin, creating new governing trifectas in all five states and giving themselves total control over redistricting. Minnesota, as it so often has been, was split, while Democrats narrowly maintained control over Illinois, giving them redistricting power there.
Republicans used this power largely to lock in their big 2010 gains, and while the Democratic gerrymander of Illinois proved effective, Republicans won 60% of the House seats in these seven states in 2012 (55 of 91 total) even as Obama won 53% of the regional two-party vote for president. Democrats have since netted an additional six seats in the region, cutting the GOP edge to 49-42, even as Trump outperformed Mitt Romney across the region. A major part of this was the unwinding of the Republican Pennsylvania gerrymander, forced by the Democratic-majority state Supreme Court, which contributed to the Democrats netting four seats during the 2018 cycle.
As we go state by state, it’s obvious that a lot has changed in redistricting from 10 years ago. Republicans no longer have an edge in control: While Democrats retain their gerrymandering power in Illinois, Republicans still hold it only in Indiana and possibly Ohio (we add the caveat there because of Ohio’s new, potentially less partisan redistricting system, which we’ll describe below). Michigan has a new commission system, while Minnesota, Pennsylvania, and Wisconsin have divided government. Courts are likely to be important players in several of these states.
Let’s start with Illinois, which is the only one of the 13 states with 10 or more congressional districts nationally where Democrats appear to hold unequivocal gerrymandering power.
ILLINOIS
Number of seats: 17 (-1 from 2010s)
Breakdown in 2012: 12-6 D
Current party breakdown: 13-5 D
Most overpopulated district: IL-7 (Downtown/West Side Chicago)
Most underpopulated district: IL-17 (Northwest Illinois)
Who controls redistricting: Democrats
2012 control: Democrats
With a 13-5 edge in the Illinois U.S. House delegation already, Democrats are not going to be able to squeeze a ton more out of the Land of Lincoln. But they should be able to do better than they are doing now and, just as importantly, they should be able to better protect some of the competitive districts they already hold.
As they draw the maps in Illinois, Democrats will be building off their gerrymander from a decade ago — one that worked out great for them in the long run of the decade, though not really as intended.
Republicans won 11 of Illinois’s 19 House seats in 2010, but Democratic control of the state legislature paired with then-Gov. Pat Quinn’s (D) narrow victory allowed Democrats to draw the state’s map. They designed a map that they hoped would elect 13 Democrats and five Republicans. Democrats came up one seat short in 2012, as now-Rep. Rodney Davis (R, IL-13) narrowly held a central Illinois seat that covers the state capital, Springfield, as well as Champaign-Urbana, home of the flagship University of Illinois campus. Davis was pushed hard again in 2018, but he remains in office. Republicans struck back in 2014, winning the affluent and highly educated northern Chicago suburban district IL-10 as well as the ancestrally Democratic but Republican-trending IL-12 in southwest Illinois. Democrats won IL-10 back in 2016, and now-Reps. Sean Casten (D, IL-6) and Lauren Underwood (D, IL-14) flipped two of the five seats “reserved” for Republicans at the start of the decade by the Democratic gerrymander. Democrats held all 13 of their seats in 2020, although Underwood only won by a little over a point. Meanwhile, Rep. Cheri Bustos (D, IL-17) won her gerrymandered district consistently throughout the decade, but she only won by four points last year in the Obama-to-Trump district. She is retiring, complicating Democratic efforts to hold her seat.
Illinois, one of the few states that actually lost population from 2010-2020, is once again losing a House seat. Two-thirds of Illinois’s population lives in either Chicago’s Cook County or one of its five surrounding “collar counties” (DuPage, Kane, Lake, McHenry, and Will). Democrats hold all 13 districts that cover these six counties with the exception of Rep. Adam Kinzinger’s (R) IL-16, which takes in a bit of the Chicago collar. Meanwhile, Republicans hold four of the five outstate districts, with IL-17 as the only exception.
So Democrats have several obvious goals in gerrymandering:
— Make sure that the eliminated district is one of the five current Republican seats.
— Protect Underwood in her exurban Chicago seat and, less pressingly, Casten, without endangering any of the other Democratic Chicagoland seats.
— Reconfigure the downstate districts to go after Davis in IL-13. This likely will be done in part by removing East St. Louis, a Democratic downstate bastion, from IL-12 and putting it in IL-13. This was once a Democratic vote center in IL-12, which Democrats held at the start of the decade, but now that Rep. Mike Bost (R, IL-12) has grabbed a strong hold on the district, there’s no sense, from a Democratic perspective, of “wasting” those Democratic votes in his district.
— Keep IL-17 blue.
Accomplishing all of these goals would result in a 14-3 Democratic map, an improvement on the current 13-5 advantage. Twitter mapmaker @UMichVoter showed how this could be done recently: IL-13 becomes a Biden +12 district by extending down to East St. Louis and continuing in a thin strip that takes in Springfield and Champaign. Chicagoland is reconfigured in such a way to put Underwood in a double-digit Biden seat, and IL-17 is changed into a Biden +9 seat. Democrats would be favored in those kinds of seats, although they could lose them under the right circumstances. Assuming the map worked as Democrats would want, they would confine Republicans to just three districts and quite possibly push out Kinzinger, a Trump critic who likely would have a hard time in a primary. Another Twitter mapmaker, Ryan Brune, suggests a more modest, 13-4 Democratic gerrymander.
The bottom line in Illinois is that Democrats are likely to come out of the state with at least a slightly bigger edge in the state than they hold now — indeed, they almost certainly have to if they are to retain the House, given their redistricting problems elsewhere.
One side note: Illinois Republicans may have been hoping to use the state courts to combat Democratic gerrymandering much as Democrats have used Democratic state courts in states such as North Carolina and Pennsylvania to combat Republican gerrymandering in those states. And they appeared to have an opening: One of the Democratic justices lost a retention election last November, setting up an open-seat election in 2022. The court is 4-3 Democratic, so winning that seat without any other changes would flip the court to Republicans. In response, Democrats re-drew the judicial districts, ostensibly to update the maps to better account for current population — they had been last drawn in 1964, although judicial districts are not subjected to the same equal population requirements as legislative districts — but also to improve their chances of maintaining control of the court.
INDIANA
Number of seats: 9 (no change from 2010s)
Breakdown in 2012: 7-2 R
Current party breakdown: 7-2 R
Most overpopulated district: IN-5 (Northern Indianapolis suburbs/exurbs)
Most underpopulated district: IN-8 (Southwest Indiana)
Who controls redistricting: Republicans
2012 control: Republicans
Despite being for decades the most clearly Republican state among the seven discussed here, Indiana once had a reputation for competitive House races. Democrats overcame a Republican gerrymander in the 1980s and ended up holding eight of the state’s 10 seats by the end of that decade. More recently, in the 2000s, Indiana featured perhaps the decade’s most intense congressional rivalry, as Mike Sodrel (R) and Baron Hill (D) battled for four straight elections over southern Indiana’s 9th District: the incumbent Hill fought off Sodrel in 2002 but then lost to him in 2004. Hill came back and beat Sodrel in 2006 and then beat him again in 2008.
But in 2010, Hill lost to Todd Young (R), who is now in the U.S. Senate. And Indiana’s famously competitive House elections became much less so. Part of that was because of Republican-controlled redistricting, but also because of political trends in the state, as traditional Democratic strength withered outside of the Indianapolis metro area. In 2012, Democrats only narrowly lost northern Indiana’s IN-2, which Joe Donnelly (D) left behind to successfully run for Senate after Republicans redrew the district, but Rep. Jackie Walorski (R, IN-2) has easily held the district since. Democrats also competed for IN-5, a highly-educated suburban/exurban district that runs north of Indianapolis, in 2020, but now-Rep. Victoria Spartz (R) held it in an open-seat race. That about sums up all of the major House-level competition in Indiana over the past decade, where Republicans have won a 7-2 edge in each election.
In redistricting, Republicans have a liability to address, and an opportunity to consider.
The liability is the aforementioned IN-5, where Mitt Romney’s 17-point edge in 2012 contracted to just a two-point margin for Donald Trump last year. Shoring up the fast-growing district likely will be a priority.
The opportunity is in northwest Indiana, where Democratic performance has softened in IN-1, held by first-term Rep. Frank Mrvan (D). Obama’s 2012 margin of 24 points fell to just nine for Biden in 2020. If Republicans got aggressive, they could try to slice up the district, although they may also just keep it intact with the hope that trends in the Gary/Hammond-based Chicago-area district continue to push it toward Republicans over the course of the decade — given its heavily blue collar character, this is a real possibility. So even without aggressive redistricting, Republicans could win an 8-1 edge in the state sometime this decade, although they have to be careful to stay ahead of Democratic trends in Greater Indianapolis.
MICHIGAN
Number of seats: 13 (-1 from 2010s)
Breakdown in 2012: 9-5 R
Current party breakdown: 7-7 Split
Most overpopulated district: MI-11 (Detroit suburbs/exurbs)
Most underpopulated district: MI-5 (Bay City/Flint/Saginaw)
Who controls redistricting: Commission
2012 control: Republicans
In both the 2000 and 2010 round of redistricting, Michigan Republicans, who controlled the process, drew maps that Democrats decried as partisan gerrymanders. Though the current map worked as intended for Republicans during much of the past decade, Democrats gained two suburban seats in 2018 to produce a tied 7-7 delegation, and they held them last year.
Aside from altering the composition of the congressional delegation in 2018, Michigan voters made another critical change: in a 61%-39% vote, they approved a referendum that established an independent commission for redistricting. The 13-member commission is made up of four Democrats, four Republicans, and five independents — the final maps need seven votes to pass, with two members of each group supporting the plan. Commissioners began the drafting process last week, and have been instructed to keep criteria such as compactness and minority representation in mind.
Because of the nature of the commission, it’s hard to tell what the final map may end up looking like, though we can make a few inferences. Earlier this month, commissioners put out a plan that divided the state into 10 regions (Map 1).
Map 1: Michigan commission-defined regions
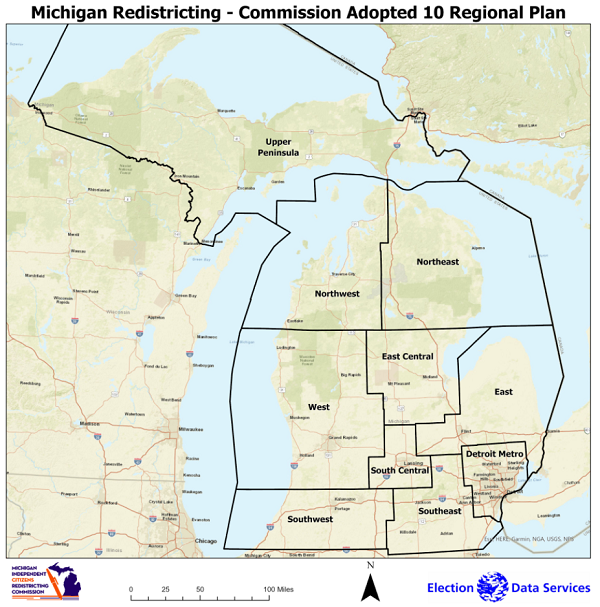
If the commission uses this plan to inform the congressional map — and this is a big if — it likely spells bad news for Rep. Dan Kildee (D, MI-5), as his Genesee County (Flint) home base is grouped with the heavily GOP thumb region: a Flint + Thumb district would have tracked closely with the state in 2008 and 2012, but would have supported Trump by double-digits twice. An ideal plan for Kildee would keep Flint with Bay City: such a district would lean Democratic, but not overwhelmingly. Conversely, two-term Rep. Elissa Slotkin (D, MI-8) may benefit if the commission sticks to its regional approach and separates heavily GOP Livingston County out from Ingham County (Lansing).
Elsewhere in the state, Kalamazoo County could continue to anchor a Republican-leaning district in the commission’s southwest region, as the counties that make up the region account for almost exactly a congressional district’s worth of population. MI-1, which includes the Upper Peninsula, will likely expand but remain heavily GOP — there are some pro-Democratic trends in the Grand Traverse region, but the seat is otherwise safe. Similarly, a Republican-leaning seat in the central part of the state seems likely (on the current map, MI-4 would be the closest thing to this).
Democrats have made major inroads in Grand Rapids area. A generation ago, heavily Dutch western Michigan was the most GOP area of the state. If the commission prioritizes compactness or preserving communities of interest, it seems likely that Kent County (which houses Grand Rapids and is the most populous county in the current MI-3), will continue to be the centerpiece of a district. Still, this would not constitute an automatic Democratic flip. Though Biden carried Kent County 52%-46%, presidential trends have not fully trickled down the ballot: Sen. Gary Peters (D-MI) narrowly lost it last year. Moreover, Kent County itself only accounts for 85% of the population of a congressional district: the successor to the current MI-3 will likely retain some of the red turf that surrounds the county. Still, if the commission aimed to create a map that prioritized partisan fairness, a district that links Grand Rapids with Kalamazoo would be possible. Rep. Peter Meijer (R, MI-3), a Trump critic, holds the district now, and while he could be vulnerable in a primary, he could very well be stronger than the average Republican in a general election.
The commission’s “Detroit Metro” region contains enough residents for almost exactly five congressional districts. As it is, districts 13 and 14, which contain parts of Detroit proper, are each 57% Black by composition — they are currently held by Democratic Reps. Rashida Tlaib (D, MI-13) and Brenda Lawrence (D, MI-14). Though Rep. Debbie Dingell’s (D, MI-12) current district is split between Ann Arbor and some working-class communities just south of Detroit, she is from the latter and will probably run in a Wayne County seat. North of Detroit, Reps. Andy Levin (D, MI-9) and Haley Stevens (MI-11) will probably run in districts that include suburban Oakland County.
Overall, there is a lot of uncertainty in Michigan. It will have 13 seats at the start of the next Congress, and could realistically elect anything from an 8-5 Republican to an 8-5 Democratic delegation.
MINNESOTA
Number of seats: 8 (no change from 2010s)
Breakdown in 2012: 5-3 D
Current party breakdown: 4-4 split
Most overpopulated district: MN-3 (Western Twin Cities suburbs)
Most underpopulated district: MN-7 (Western Minnesota)
Who controls redistricting: Split
2012 control: Split
The potential for drama in Minnesota redistricting was drastically reduced when the census apportionment preserved the state’s 8th U.S. House district. Many projections suggested the state would lose a seat, which would have necessitated a much more dramatic redistricting than is now required. As it was, Minnesota barely hung on by getting the 435th seat awarded in the reapportionment process (Minnesota also won the 435th seat a decade ago).
The Land of 10,000 Lakes illustrates as well as any other state the trends in House districts over the past decade.
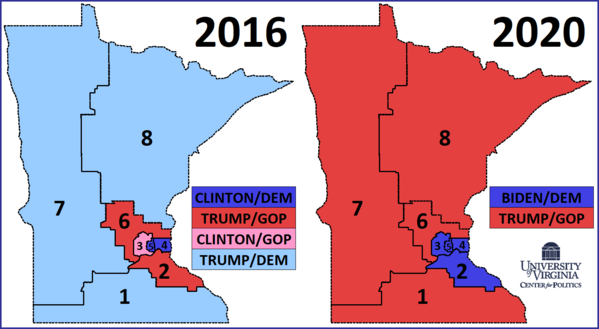
In the first election of the past decade, 2012, Democrats won a 5-3 edge in the state’s delegation by retaking MN-8, a geographically large district that covers the state’s Iron Range in the northeastern tip of the state. Rep. Jim Oberstar (D) first won the district in 1974, and he easily won reelection until losing in 2010 — a preview of the rightward turn the white working-class district would take in the years to come. In 2008, MN-8 voted for Barack Obama by eight points, basically the same as John Kerry’s victory there in 2004 — this despite Obama running about 10 points ahead of Kerry’s national margin in 2008. There are a lot of examples of places where Obama ran behind Kerry or did no better than Kerry that would later shift strongly to Donald Trump in 2016 and 2020. Democrats did rebound and win MN-8 in 2012, 2014, and 2016, but Republicans won it as an open seat in 2018 and easily held it last year.
Democrats also lost two other geographically large districts where Trump performed markedly better than Mitt Romney had in 2012, MN-1 in southern Minnesota and MN-7 in western Minnesota, in 2018 and 2020, respectively. Former Rep. Collin Peterson (D, MN-7) finally was washed away by the Republican tide in his district in 2020, as he lost by a double-digit margin while Trump was once again carrying his district by roughly 30 points. Peterson was a major outlier in the House prior to his loss: No other member held any district that the other party had won by even 20 points for president, let alone 30.
Meanwhile, in 2018, Democrats captured two Republican-held districts in the orbit of Minnesota’s Twin Cities: MN-3 in the western Minneapolis suburbs and MN-2, which extends south and east from St. Paul.
These results had the effect of sorting out Minnesota’s House districts along presidential lines. In 2016, Republicans held MN-3 despite it voting for Hillary Clinton, and they also held MN-2 as it narrowly backed Trump (the district would swing to Biden in 2020). Meanwhile, Democrats held MN-1, MN-7, and MN-8 even as Trump carried all three by double digits. By 2020, Republicans had captured all three districts. So after featuring four “crossover” House districts as recently as 2016, Minnesota now has none: Democrats hold the four Biden districts, and Republicans hold the four Trump districts. This transition is shown in Map 2.
Map 2: Minnesota House/presidential voting, 2016 vs. 2020
For the past several decades, redistricting in Minnesota has ended up in the courts, and that very well could be the case again. Republicans surprisingly retained control of the state Senate last year — one of a long list of Republican state legislative success stories across the country in 2020 — while Democrats hold the state House and the governorship. As is the case in many other parts of the country, Minnesota’s rural districts are growing more slowly than its districts closer to the Twin Cities: newly-Republican MN-1, MN-7, and MN-8 are all underpopulated and will need to take on additional turf, while the five districts closer to Minneapolis/St. Paul — Democratic seats MN-2, MN-3, MN-4, and MN-5 along with Republican-held MN-6 — all are overpopulated and therefore need to shed population. Assuming the two parties can’t agree on a map, we could see a court simply tweaking the lines to adjust for population disparities, which likely wouldn’t alter the underlying dynamics too much.
Barring major changes, the district to watch in Minnesota is MN-2, held by Rep. Angie Craig (D). It featured the closest race in the state in 2020, as Craig won by two points over veteran Tyler Kistner (R), who is running again in 2022. Biden won the district by seven points, but Craig ran behind Biden and also lost some votes to a deceased pro-marijuana candidate, the death of whom almost delayed the election for the seat. A few months ago, we sketched out a scenario in which Craig could get a better district while Rep. Jim Hagedorn (R, MN-1) could also be made safer (he only won by three points last year, running several points behind Trump in terms of margin). But we suspect Republicans might not want to make consequential trades between MN-1 and MN-2, as Hagedorn is likely less vulnerable in the context of 2022 than Craig is. See that article for more on the dynamics.
OHIO
Number of seats: 15 (-1 from 2010s)
Breakdown in 2012: 12-4 R
Current party breakdown: 12-4 R
Most overpopulated district: OH-3 (Columbus)
Most underpopulated district: OH-6 (Eastern border along Ohio River)
Who controls redistricting: Republicans
2012 control: Republicans
It’s difficult to find a big-state gerrymander that was as effective as Ohio’s Republican-drawn map was in the 2010s. It’s also difficult to find a big state with as many variables in its redistricting process for the 2020s. Let’s review the history first, and then explore the new system.
In 2008, Democrats won a narrow, 10-8 advantage in the state’s U.S. House delegation, breaking through on a Republican-drawn map. It’s the only time Democrats have won a majority of the state’s delegation since the Republican Revolution of 1994, when Republicans won the House for the first time in four decades. Another Republican wave, in 2010, restored the Republican gerrymander and then some: The GOP won 13 of 18 seats, a seat better than their high-water mark from earlier in the decade.
Controlling the process in advance of the 2012 election, Republicans had to deal with the slow-growing state’s loss of two congressional district. They axed one district from each party, with the goal of electing 12 Republicans and four Democrats. It worked — no seats changed hands throughout the decade — although that glosses over some of the change in the 16 districts over the course of the 2010s.
Few states performed better for Donald Trump in 2016 and 2020 compared to previous Republican presidential nominees than Ohio. Trump carried the state by eight points in each of his elections, pushing the one-time bellwether state further to the right compared to the nation as a whole than it had been since before the New Deal.
The pro-Republican shift was perhaps most notable in Eastern Ohio. OH-13, a district drawn by Republicans as a Democratic vote sink under the 2010s map and held by Rep. Tim Ryan (D), gave Barack Obama a nearly 30-point margin in 2012. Last year, OH-13 supported Joe Biden, but by just over three points — this placed the district slightly right of the national popular vote (Biden won that by about 4.5%). Map 3 compares the elections in the district.
Map 3: OH-13, 2012 vs. 2020
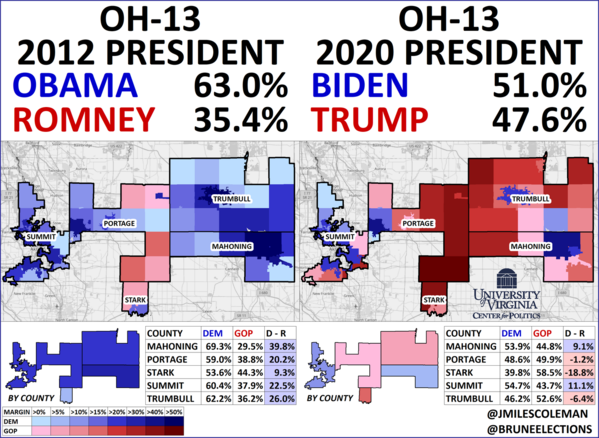
OH-13’s astonishing swing was dwarfed by that of OH-6’s, held by Rep. Bill Johnson (R), which shifted a remarkable 33 points toward the Republicans in presidential margin from 2012 to 2020 — this was the largest redshift of any district during that period. In fact, four of the five districts with the strongest pro-Republican presidential swing from 2012 to 2020 are in Ohio, per the calculations from Daily Kos Elections: the aforementioned OH-6 and OH-13, along with the districts held by Reps. Bob Gibbs (R, OH-7) and Jim Jordan (R, OH-4).
OH-13 is a prime candidate to be eliminated in redistricting, as Ryan is running for Senate: It is a Democratic vote sink that isn’t even that Democratic anymore. It would be easy for it to be absorbed by other districts. In the past, Republicans would not have wanted the one-time Democratic post-industrial powerhouse counties of Mahoning (Youngstown) and Trumbull (Warren) put together in a Republican district. But both of those counties voted for Trump in 2020, so surrounding Republicans can easily take them on.
Of the state’s other districts, only one — Rep. Troy Balderson’s (R) OH-12 in the northern Columbus suburbs/exurbs — exhibited a notable pro-Democratic shift from 2012, going from Romney by 10.5 to Trump by 5.9. Democrats came within a point of capturing the seat in an August 2018 special election, the only time they got very close to winning one of the state’s 12 Republican-held districts. Rep. Steve Chabot (R, OH-1) in the Cincinnati area also faced competitive races in 2018 and 2020 as Republican performance fell off a bit over the course of the decade.
So this is the landscape in Ohio — a state that has clearly shifted right in recent years. Republicans dominate the state legislature and control the governorship, so if they had complete gerrymandering power, they would almost certainly be able to improve upon their edge in the delegation as Ohio loses another seat in this cycle’s reapportionment. But the state’s new redistricting process could constrain that power.
In 2018, Ohio voters overwhelmingly approved a constitutional amendment creating a system that is not equivalent to the independent redistricting commissions that exist in several other states, but that also could hypothetically constrain egregious gerrymanders. The state’s 65 smallest counties cannot be split, the next 18 largest can only be split once, and the five largest can only be split twice (Democratic vote center Cuyahoga, home to Cleveland, is covered by four different congressional districts currently). Additionally, of the state’s major municipalities, only Columbus (which is too populous to fit in a single district and spills into multiple counties) can be split; the state’s other biggest cities must remain whole, including Cleveland and Cincinnati. This should have the effect of creating more regular district lines in Ohio.
The state legislature gets the first crack at drawing the lines, but a three-fifths majority must approve them and, crucially, that majority must include at least half the members of both parties. If this fails, a seven-member commission draws the lines, but that only succeeds if two of the minority party members vote in favor of the map. That commission, as currently composed, has a 5-2 Republican edge, but remember that the two Democrats would need to vote in favor of the map. Only if these two processes fail can the legislature pass a map with a simple majority, but that map would only be in place for four years instead of the customary 10. One other wrinkle here is the Ohio Supreme Court, which has a 4-3 Republican majority (justices are nominated in partisan primaries but do not have a party label on the general election ballot, which likely has been a boon to Democrats as they’ve flipped three seats in the last two cycles). It is possible that the high court could throw out a Republican-drawn map if the court found that the map did not comply with the new system/guidelines, although that would take at least one Republican voting with the Democrats. Chief Justice Maureen O’Connor (R) was in the minority in a case from 2012 that unsuccessfully challenged the GOP-drawn state legislative maps last time, for what it’s worth (possibly nothing, but possibly not).
It isn’t hard to find Republican-friendly Ohio gerrymanders from Twitter mapmakers that abide by the new rules but still produce a map that would likely result in a 13-2 Republican majority, with Democratic seats only in Cleveland and Columbus. At the same time, it’s also possible to draw a much worse map for Republicans, which likely would give them a clear majority of the seats but would allow Democrats to potentially win more seats than they hold now. One possible “compromise” would be to draw a third safe Democratic seat in Cincinnati, which perhaps would attract support from Black Democrats in the state legislature, as a Black Democrat would have a solid chance to win such a district.
Or, heaven forbid, perhaps there will actually be a competitive seat or two in the state from the get-go. For instance, Summit (Akron) and Stark (Canton) counties together have a bit more than 900,000 people, or a little more than 100,000 over the optimal size for a district. The two counties collectively voted for Donald Trump by less than two points, so it’s easy to see a swing district covering much of that territory, as well as competitive seats in other parts of the state.
Then perhaps Ohio could actually see changes to its House delegation based on campaign performance and the national environment — a foreign concept in the state in the 2010s. Regardless, Ohio is a major wild card in the national redistricting picture, with a number of possibilities ranging from a maximalist 13-2 Republican gerrymander to Democrats improving on their current 12-4 deficit.
PENNSYLVANIA
Number of seats: 17 (-1 from 2010s)
Breakdown in 2012: 13-5 R
Current party breakdown: 9-9 Split
Most overpopulated district: PA-10 (Harrisburg/York/Carlisle)
Most underpopulated district: PA-15 (Northwest-Central PA)
Who controls redistricting: Split
2012 control: Republicans
In some ways, Pennsylvania has mirrored Michigan over the last several redistricting cycles: during the 2000 and 2010 rounds, Democrats complained as Republicans drew partisan maps — but now, as neither party has a monopoly on the remapping process, each state has a tied delegation. To get to that tied delegation, though, Democrats were helped by a 2018 state Supreme Court ruling: after Democrats won a majority of the body’s seats, in 2015, they threw out the GOP-drawn congressional map and enacted a new plan. Between the 2016 and 2018 cycles, Democrats added four members.
If Gov. Tom Wolf (D-PA) and the GOP-controlled legislature cannot agree on a plan — something that seems likely — the state Supreme Court may get another chance to draw a map. Still, the court won’t be able to take an entirely minimal change approach this time, as the state is losing a seat. Though Democrats would face a sympathetic court, population trends simply may not be in their favor: on a map with one fewer seat, some vulnerable Democrats may see their seats pick up more Republicans.
In northeastern Pennsylvania, Rep. Matt Cartwright (D, PA-8) already holds a Trump seat. Aside from some blue turf currently in Democratic Rep. Susan Wild’s next-door PA-7, there is not much friendly territory for Cartwright to add. Wild, in turn, probably can’t afford to lose very many Democrats: her PA-7 overlaps with most of the Lehigh Valley, an area that usually mirrors the statewide vote — in other words, it’s swingy.
Moving into the Philadelphia area, the Bucks County-based PA-1 is a swing seat on paper but Rep. Brian Fitzpatrick (R) has garnered serious crossover support since he was first elected, in 2016. Fitzpatrick is from a political family in the area, and assuming he is renominated (he won his past two primaries with “only” about two-thirds of the vote), he’d start out favored in any Bucks-centric seat.
Philadelphia proper contains enough population for just over two congressional districts. Rep. Brendan Boyle (D, PA-2) hails from the working-class northeastern part of the city, while Rep. Dwight Evans (D, PA-3) represents a Black-majority district there — under a similar map, each would be fine.
In Philadelphia’s suburban collar counties, three Democratic women were initially elected in 2018, and all could end up with similar seats. Just to the city’s southwest, Rep. Mary Gay Scanlon (D, PA-5) represents all of Delaware County. Assuming Delaware County is kept whole (it makes up most of a district), she’ll have somewhere to run. Similarly, Rep. Madeleine Dean’s (D, PA-4) district is essentially coterminous with suburban Montgomery County — as long as the county is not splintered multiple ways, she’ll likely have a safe blue seat. Finally, Rep. Chrissy Houlahan (D, PA-6) has a district that includes all of blue-trending Chester County. Houlahan’s PA-6 also reaches up into Berks County, to grab the city of Reading — PA-6 could simply take in more of Berks County. In 2020, Houlahan had the closest race of the three, but she still won by a clear 56%-44% margin. In the Trump era, Bucks County, which has more of a working class contingent, has replaced the more upscale Chester County as the least Democratic county in the collar — this swap has probably benefited both Fitzpatrick and Houlahan.
Moving into south-central Pennsylvania, if the court keeps a similar configuration, PA-10 may still be competitive. The current PA-10 includes the state capital, Harrisburg, as well as its suburbs, in Cumberland County, and reaches down to the city of York. Rep. Scott Perry (R, PA-10) is one of the delegation’s most conservative members: initially elected to a safer seat in 2012, he held on by a 51%-49% margin when the new seat was drawn and by a more comfortable 53%-47% last year — his 2020 opponent, former state Auditor Eugene DePasquale (D), is seriously considering a rematch. Next door, in PA-11, Republican Rep. Lloyd Smucker seems likely to run in whichever seat Lancaster County ends up in — one of the most historically GOP counties in the state, it makes up the majority of a district.
In southwestern PA, Pittsburgh proper is in Democratic Rep. Mike Doyle’s PA-18 (though the “PA-18” designation will be eliminated for the next Congress), a district that is contained entirely within Allegheny County. Next door, Rep. Conor Lamb (D, PA-17) is running for Senate and is leaving open a Trump-to-Biden seat that could become redder. Biden and Lamb each took 51% in PA-17 last year: the bulk of it comes from Pittsburgh’s northern suburbs (which have trended blue, but were Republican until recently), while it also includes reddening Beaver County and a small part of Butler County. Democrats would favor a map that unpacks Doyle’s district (Biden carried it by 30 points) by moving it into Westmoreland County, thereby freeing up closer-in Pittsburgh suburbs for PA-17 (ironically, the GOP gerrymander that was scrapped for 2018 had Doyle representing a tiny part of Westmoreland County). Republicans would rather see the Pittsburgh seat stay entirely within Allegheny County — that way, PA-17 would have to expand its holdings in the adjacent, and redder, counties.
Aside from Perry, none of Pennsylvania’s Republicans had especially close races last year. Though one of the GOP-held seats may end up getting eliminated — geographically, they hold several districts in the depopulating middle of the state — Republicans may have some promising opportunities to flip new seats next year.
WISCONSIN
Number of seats: 8 (no change from 2010s)
Breakdown in 2012: 5-3 R
Current party breakdown: 5-3 R
Most overpopulated district: WI-2 (Madison)
Most underpopulated district: WI-4 (Milwaukee)
Who controls redistricting: Split
2012 control: Republicans
In 2011, Republicans in Wisconsin came up with what would become one of the decade’s most effective plans. In 2010, the Badger State congressional delegation flipped from 5-3 Democratic to 5-3 Republican — five cycles later, the balance has not changed.
Ten years ago, a key objective of Republican map drawers was to turn veteran Rep. Ron Kind’s (D, WI-3) western seat into a Democratic sink while protecting then-first-term Rep. Sean Duffy (R, WI-7), who had just flipped a rural seat to the north. Portage County, which contains the college town of Stevens Point, was shifted from WI-7 to WI-3, while WI-7 picked up some redder areas of WI-3.
As it turned out, Duffy didn’t need help: the 7th District has stayed comfortably in GOP hands since 2010, and even the older, more Democratic version would have stayed red. Kind’s district, though it was made bluer, still trended red anyway: it voted for Obama and Trump twice, while former Gov. Scott Walker (R-WI) carried it in his three successful gubernatorial runs, but not in his 2018 loss. In 2020, as Trump slightly improved his showing in WI-3, Kind was held to just a three-point margin — this was the closest race of his career (though he may have still won, he caught a lucky break in 2016, as Republicans did not field a challenger against him).
Given these larger-scale shifts, it was not too surprising when Kind announced his retirement earlier this month. With the redistricting process split between a Democratic governor and a Republican legislature, the configuration of WI-3, which is the only truly marginal seat on the map, will almost certainly be a point of contention. Republicans can take some comfort that the state Supreme Court, which could end up drawing the map if the process deadlocks, is controlled 4-3 by GOP-aligned judges, although Justice Brian Hagedorn has shown something of an independent streak.
Currently, about 40% of WI-3’s votes come from three “urban” counties: Eau Claire, La Crosse, and Portage. That trio gave Biden a 54%-44% margin last year, while the rest of the district gave Trump a 57%-41% vote — for perspective, in 2012, Obama carried its urban counties 57%-42% and the rest by 53%-45%. In an ideal arrangement for Democrats, WI-3 would take in some bluer turf in the orbit of Madison’s Dane County, such as Iowa County. Depending on what is added and/or subtracted, WI-3 could become a narrow Biden seat. Dane County makes up most of WI-2, and any version of the district containing it would be deep blue. Republicans would probably rather give the 3rd District more of northern Wisconsin, as WI-7 (now the reddest district in the state based on the 2020 presidential results) has GOP votes to spare.
In the Milwaukee area, WI-4 will have to pick up about 40,000 residents. It already contains all of Milwaukee proper, so it will probably have to pick up one of the whiter suburbs around it (WI-4 is majority-nonwhite by composition). WI-1 and WI-5 both take up substantial chunks of Milwaukee County, but they will not be hard to shore up, as heavily GOP Waukesha County is split between the two districts. Before 2002, WI-1 did not have much of Waukesha County, but, as a pro-incumbent plan was passed that cycle, more of it was added to strengthen then-Rep. Paul Ryan (R, WI-1), who would later be the vice presidential nominee on the 2012 GOP presidential ticket as well as Speaker of the House. The 2000 version of WI-1 actually favored Al Gore in the presidential race that year (though Ryan routinely overperformed). If WI-1 is taken out of Waukesha County, it may be competitive, but this doesn’t strike us as especially likely.
Going a bit north, WI-6 and WI-8 probably won’t see large partisan changes. WI-6 is based in east-central Wisconsin and, aside from a sliver of Milwaukee County that it contains, Trump carried every county in the district. WI-8 has long been a Green Bay-area seat, and Rep. Mike Gallagher (R, WI-8) has performed well in his three successful elections, though he has been mentioned as a potential Senate candidate if Sen. Ron Johnson (R-WI) retires.
Given the tense partisan atmosphere in Wisconsin, it seems more likely than not that the courts will have to get involved. If a status quo plan is adopted, Democrats would essentially be guaranteed to only hold districts 2 and 4, while WI-3, without Kind, would probably be a Toss-up, at best. So Republicans could end up getting to a 6-2 delegation in what is otherwise a very evenly divided state.
Conclusion
Speaking of the Midwest more broadly in his book on American political geography and electoral rules, Red Fighting Blue, the shrewd political scientist David A. Hopkins wrote that the Midwest was “the nation’s most politically representative — and competitive — region,” and that it continues to hold “an unmatched pivotal position” in American politics. That is true in presidential politics, and the region is just as vital in House elections.
Process changes and election results have muddied the gerrymandering power in the region. Judicial interventions could serve to effectively preserve the status quo in some of these states, while there are some major unknowns, such as how Michigan’s new commission operates and whether Republican gerrymandering power is constrained in Ohio.
Beyond that, there should still be a number of swing seats spread across these seven states, and Democrats cannot afford to lose the ones they currently control with such a slim majority in the House. They may be able to shore up some of those districts, particularly in Illinois, but they likely will still have several vulnerable seats dotted across the Great Lakes region next year.
Kyle Kondik is a Political Analyst at the Center for Politics at the University of Virginia and the Managing Editor of Sabato's Crystal Ball.
J. Miles Coleman is an elections analyst for Decision Desk HQ and a political cartographer. Follow him on Twitter @jmilescoleman.
See Other Political Commentary by Kyle Kondik.
See Other Political Commentary by J. Miles Coleman.
See Other Political Commentary.
Views expressed in this column are those of the author, not those of Rasmussen Reports. Comments about this content should be directed to the author or syndicate.
Related Articles

Rasmussen Reports is a media company specializing in the collection, publication and distribution of public opinion information.
We conduct public opinion polls on a variety of topics to inform our audience on events in the news and other topics of interest. To ensure editorial control and independence, we pay for the polls ourselves and generate revenue through the sale of subscriptions, sponsorships, and advertising. Nightly polling on politics, business and lifestyle topics provides the content to update the Rasmussen Reports web site many times each day. If it's in the news, it's in our polls. Additionally, the data drives a daily update newsletter and various media outlets across the country.
Some information, including the Rasmussen Reports daily Presidential Tracking Poll and commentaries are available for free to the general public. Subscriptions are available for $4.95 a month or 34.95 a year that provide subscribers with exclusive access to more than 20 stories per week on upcoming elections, consumer confidence, and issues that affect us all. For those who are really into the numbers, Platinum Members can review demographic crosstabs and a full history of our data.
To learn more about our methodology, click here.