Incumbent Reelection Rates Higher Than Average in 2016
A Commentary By Kyle Kondik and Geoffrey Skelley
With Republican Sen.-elect John Kennedy’s triumph in the Louisiana runoff last weekend, victories by two other Republicans in Louisiana House races, and Gov. Pat McCrory’s (R) concession last week to Gov.-elect Roy Cooper (D) in North Carolina, the winners of 2016’s House, Senate, and gubernatorial races are now set. This allows us to do a little housekeeping. Kennedy’s win confirms that this is the first cycle in the history of popular Senate elections that every state that held a Senate election in a presidential cycle voted for the same party for both president and for Senate (34 for 34 this year). Also, finalizing these results permits us to give a final assessment of our down-ballot Crystal Ball projections for 2016: We picked 32 of 34 Senate races correctly, along with 10 of 12 gubernatorial races and 428/435 House races.
Looking over the down-ballot outcome, there’s one inescapable conclusion in a year that was defined by a political outsider, Donald Trump, winning the presidency: It was still a really good year to run as an incumbent in 2016, all things considered.
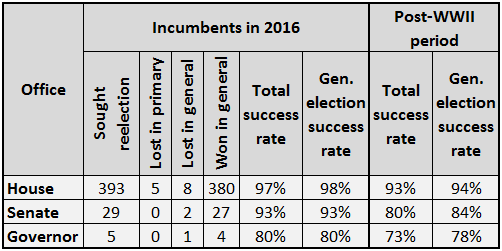
This election cycle, 393 of 435 House representatives, 29 of 34 senators, and five of 12 governors sought reelection (several of the governors were prohibited from seeking another term). Of those, 380 of 393 House members (97%), 27 of 29 senators (93%), and four of five governors (80%) won another term. These members of Congress and governors not only won renomination, but also won in November.
Those reelection rates are all a little bit better than the already impressive post-World War II averages, as shown in Table 1.
Table 1: Incumbent reelection rates in 2016 compared with post-World War II historical averages
Sources: Crystal Ball research; Vital Statistics on Congress
This year’s incumbent reelection rates could easily have been even higher. The aforementioned Pat McCrory only lost his reelection bid by two-tenths of a percentage point, and outgoing Sen. Kelly Ayotte (R-NH) only lost by 0.14 points to Sen.-elect Maggie Hassan (D), who did not seek reelection as governor of the Granite State. Additionally, mid-decade, court-ordered redistricting in Florida, North Carolina, and Virginia all contributed to some incumbent losses. New maps played a big role in the primary defeats of outgoing Reps. Corrine Brown (D, FL-5), Renee Ellmers (R, NC-2), and Randy Forbes (R, VA-4 — he actually ran for reelection in VA-2, though, because of redistricting), and also contributed to the general election losses of outgoing Reps. David Jolly (R, FL-13) and John Mica (R, FL-7). Had redistricting not occurred, the small number of losing incumbents (13) almost certainly would have been smaller.
That’s not to say there isn’t a good deal of turnover in these high-level offices. Most states have term limits for governor, and because of incumbent defeats, retirements, and other factors, about an eighth of the U.S. House will be new in 2016 (and several more new members will be elected in special elections next year to replace some House members who are likely to be confirmed for positions in the Trump Administration). Seven of 100 senators will be new members come January, and that number eventually will rise if Sen. Jeff Sessions (R-AL) is confirmed as attorney general and replaced by a gubernatorial appointee or if other members, such as Sen. Heidi Heitkamp (D-ND), are nominated and confirmed for a Cabinet post.
However, despite the fact that there is some churn in Congress and in the statehouses, the reality is that if an incumbent is on the ballot, he or she typically has good odds of winning. That’s been true for much of recent American history, and it was still true in 2016.
Kyle Kondik is a Political Analyst at the Center for Politics at the University of Virginia.
Geoffrey Skelley is the Associate Editor at the Center for Politics at the University of Virginia.
See Other Political Commentary by Kyle Kondik.
See Other Political Commentary by Geoffrey Skelley.
See Other Political Commentary.
Rasmussen Reports is a media company specializing in the collection, publication and distribution of public opinion information.
We conduct public opinion polls on a variety of topics to inform our audience on events in the news and other topics of interest. To ensure editorial control and independence, we pay for the polls ourselves and generate revenue through the sale of subscriptions, sponsorships, and advertising. Nightly polling on politics, business and lifestyle topics provides the content to update the Rasmussen Reports web site many times each day. If it's in the news, it's in our polls. Additionally, the data drives a daily update newsletter and various media outlets across the country.
Some information, including the Rasmussen Reports daily Presidential Tracking Poll and commentaries are available for free to the general public. Subscriptions are available for $4.95 a month or 34.95 a year that provide subscribers with exclusive access to more than 20 stories per week on upcoming elections, consumer confidence, and issues that affect us all. For those who are really into the numbers, Platinum Members can review demographic crosstabs and a full history of our data.
To learn more about our methodology, click here.

