The Atlas of Post-Dobbs Abortion Ballot Measures: Part Two
A Commentary By J. Miles Coleman
Comparing ballot issues to partisan races in VT, CA, MT, KY, and state halves.
KEY POINTS FROM THIS ARTICLE
— Vermont and California were two blue states where the pro-abortion rights sides of 2022 ballot measures ran considerably ahead of Democratic nominees for statewide office.
— Also in 2022, voters in Kentucky and Montana defeated GOP-backed abortion-related ballot questions; the results of those votes may provide something of an electoral roadmap for Gov. Andy Beshear (D-KY) and Sen. Jon Tester (D-MT).
— The pro-abortion rights side has generally run ahead of Democratic candidate performance recently, although there are now examples from several states of Democratic candidates doing better than the ballot issues in a variety of heavily minority areas.
— In each of the seven states that have held abortion-related ballot measures since the Supreme Court’s Dobbs ruling, the pro-abortion rights side has outperformed Biden more In the counties that make up lesser-populated “bottom half” counties in these states.
Abortion ballot issues vs partisan races (continued)
Last week, we began our look at the states that have held abortion-related ballot measures since the Supreme Court’s Dobbs ruling last year. We considered results in Kansas and Ohio (the earliest and most recent referendums, respectively), as well as Michigan’s Proposal 3. Today, we’ll turn our attention to two blue states (Vermont and California) and a pair of red ones (Montana and Kentucky). All four of those elections were held concurrently with last November’s midterm.
Vermont
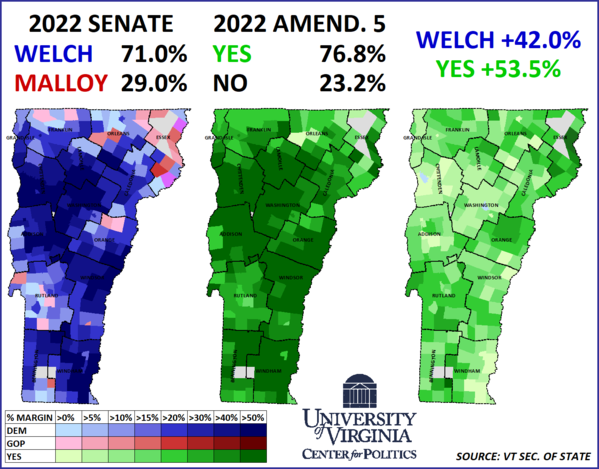
In Vermont, now-Sen. Peter Welch (D) was elected last year to replace the long-serving Pat Leahy, who was, at the time, President Pro Tempore of the Senate. Welch’s 42-point showing (using the two-party vote, which will be used for partisan races throughout this article) over Gerald Malloy (R), a pro-Trump conservative, was a slight improvement on Joe Biden’s 2020 showing in Vermont. At the same time, voters in the Green Mountain State approved Amendment 5, which added language to the state constitution ensuring personal reproductive autonomy, by a better-than 3-to-1 margin (54 points) — in fact, all of the state’s voting municipalities supported it. Of the 7 states that have weighed in on abortion-related ballot measures since 2022, the result of Vermont’s Amendment 5 represented the most lopsided showing in favor of the pro-abortion rights side — not really a surprise in a socially liberal state that also was Biden’s strongest state of that group. Map 1 compares the Senate result to the Amendment 5 vote.
Map 1: 2022 Vermont Senate race vs Amendment 5
Welch outran “Yes” in only 2 of the state’s nearly 250 municipalities, although they were significant ones. He outpaced Yes by just over a point in Burlington, the state’s most populous city, and he did nearly four points better in Montpelier, the state capital. Four of Yes’s five top performances, compared to Welch, came in the Northeast Kingdom’s Essex County, which is usually the state’s most pro-Republican county in partisan elections.
California
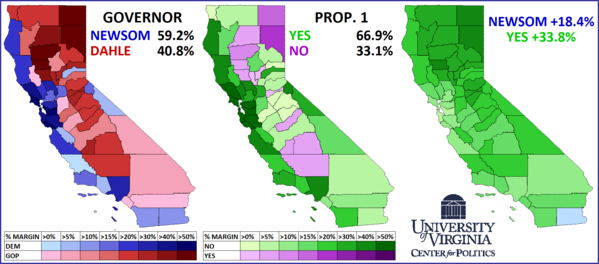
Gov. Gavin Newsom (D-CA) was reelected by a somewhat underwhelming 59%-41% margin in his deep blue state. Like virtually all major state Democrats, Newsom supported and campaigned for Proposition 1, a measure that ensured that the state would not “deny or interfere with an individual’s reproductive freedom.” As Map 2 shows, Proposition 1 was broadly popular — its 34-point margin of approval was nearly double Newsom’s margin of victory.
Map 2: 2022 California gubernatorial race vs Prop. 1
As the second image on Map 2 shows, only some of the most GOP-leaning counties went against Proposition 1. Kern and Tulare counties, which make up much of Speaker Kevin McCarthy’s (R, CA-20) dark red Bakersfield-centric district, were among them. In the northeast, Newsom and Proposition 1 fared worst in Lassen and Modoc counties. Perhaps not surprisingly, given how different their politics is from what prevails statewide, local officials in both counties have come out in support of leaving California to join the proposed State of Jefferson. But, with that region still being part of the state, northeastern California is the home base of state Sen. Brian Dahle, who was Newsom’s GOP opponent. As the third image shows, Yes ran significantly ahead of Newsom in the north, likely speaking to Dahle’s regional appeal.
On the opposite end of the state, the sole county where Newsom ran ahead of Yes was Imperial County, which borders Mexico. The most heavily Hispanic county in the state (it is nearly 90% Hispanic by composition), Imperial County usually supports Democrats in partisan elections, but it has something of a socially conservative streak when it comes to ballot measures: in 2016, it was one of two Hillary Clinton-won counties that voted against legalizing marijuana in the state (the other was the Central Valley’s Fresno County, which was more marginal in both elections). Clinton won Imperial by 42 points, but Biden’s margin was only 24 — this was the biggest swing against Biden in California compared to 2016 (statewide, Clinton won by 30 points while Biden won by 29).
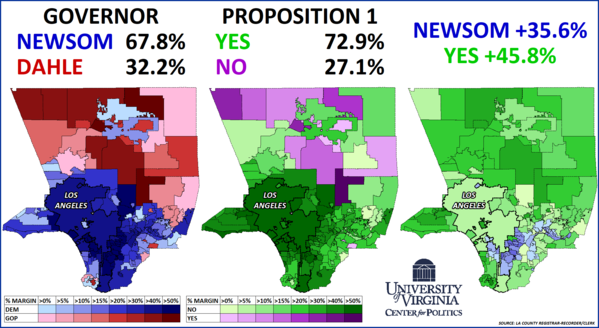
Backtracking a bit back north, Map 3 takes more of a granular look at Los Angeles County. Overall, Proposition 1 performed 10 percentage points better than Newsom, as it passed by 46 points while he carried the mega county by 36.
Map 3: Newsom vs Proposition 1 in 2022 in Los Angeles County
For those of our readers who remember our coverage of the 2021 recall election, that blue streak of cities just east of Los Angeles proper may look familiar. Two years ago, many of those same cities went against the topline result by giving Newsom a bigger margin (by voting to keep him as governor) than Joe Biden a year earlier. In 2022, the more “status quo” option again overperformed in many of those communities. As we saw in our detailed breakdown of Wayne County, Michigan in the initial installment of this series, the pro-abortion rights ballot position fared (relatively) poorly in minority communities compared to how actual Democratic candidates performed. In the context of Los Angeles, heavily Hispanic cities like Compton, El Monte, and South Gate all gave Newsom a better margin than the Yes position. Meanwhile, Yes ran double-digits ahead of Newsom in some of the whiter, and economically better-off, neighborhoods closer to Long Beach, Manhattan Beach, and Malibu.
Montana
Like Ohio, which we covered last week, Montana is probably not going to be a top-tier presidential battleground state, but it is set to see another competitive Senate race featuring a Democratic incumbent, Sen. Jon Tester. Last year Montanans defeated Legislative Referendum 131: Though its scope was narrower than what we’ve covered in other states, if passed, it would have conferred personhood status to infants born prematurely and would have established penalties for medical workers that denied care to prematurely-born infants.
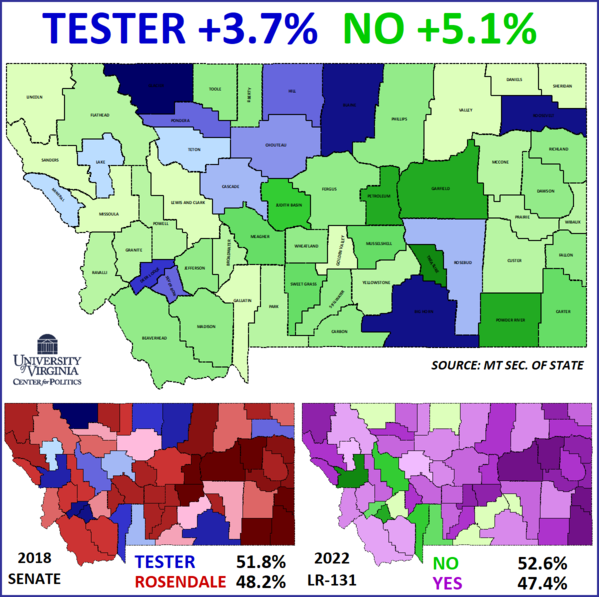
LR-131 failed, although its 5-point margin of defeat represented one of the closer results that we’ve surveyed. Map 4 compares Tester’s 2018 performance, a roughly four-point margin of victory, to LR-131’s slightly larger margin of defeat.
Map 4: 2018 Montana Senate race vs 2022 LR-131
The map of Tester’s overperformance (blue on the large image) lines up nicely with the map of the state’s American Indian reservations. Over the years, Tester’s campaigns have worked to mobilize the Native vote, something that has helped put him over the top. But in 2022, Montana lacked a top-tier statewide race, which led to different turnout dynamics. Additionally, most of the state’s reservations are located in the deep red 2nd District, which was never viewed as competitive (although it evolved into a three-way race that GOP Rep. Matt Rosendale, who was also Tester’s 2018 opponent, won easily).
Although Tester did not carry his north-centrally located home county, Chouteau, in 2018, he outran “No” there, as well as in several counties bordering it. Other relatively strong Tester performances came in the pair of Deer Lodge and Silver Bow counties, two historically Democratic, working-class counties in the southwest where Donald Trump performed better than past Republican presidential nominees. Lake County, just north of Missoula, is typically the bellwether county in partisan elections. Lake County supported LR-131, although by just three votes, while Tester overperformed enough there to carry it in 2018 (the county also contains much of the Flathead Reservation).
With 2024 on the radar, we still view the Senate race as a Toss-up. Just as Sen. Sherrod Brown (D-OH) is probably looking to replicate the anti-Issue 1 showing in some of Ohio’s suburban counties, LR-131’s defeat in Yellowstone County — Montana’s most populous county, which is firmly Republican at the presidential level but has been marginal in Tester’s races — may provide the Tester campaign some encouragement.
Kentucky
Finally, the most Republican-leaning state where voters weighed in on an abortion-related ballot measure in the post-Roe era was Kentucky. In 2022, Republicans supported Amendment 2, which, if passed, would have affirmed that the state constitution did not guarantee a right to abortion. Amendment 2 was defeated by about 5 points.
Earlier this year, Matthew Isbell, a Florida-based Democratic mapper, wrote up a detailed post-mortem on Amendment 2, and compared it to some recent partisan elections in the state. Not surprisingly, “No” ran considerably ahead of Democratic Senate nominee Charles Booker, who lost to GOP Sen. Rand Paul in 2022. Booker, though, still outpaced “No” in some minority-heavy precincts of Louisville and Lexington (he is Black himself), as well as some historically Yellow Dog Democratic eastern precincts.
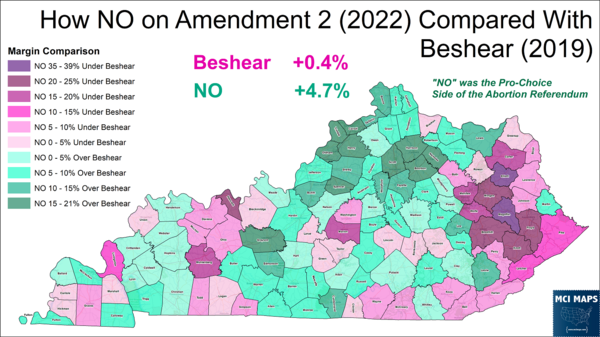
Isbell also compared Amendment 2 to Gov. Andy Beshear’s (D) 2019 race, when he narrowly ousted then-Gov. Matt Bevin — we are borrowing this for Map 5.
Map 5: 2019 Kentucky gubernatorial result vs 2022 Amendment 2
Beshear fared best relative to Amendment 2’s No vote in the eastern coalfields — though this culturally conservative area has reddened considerably after it spent decades as a Democratic stronghold following the New Deal, Beshear’s family name may have carried some weight there — as well as some coal-producing western counties. In the middle of the state, Marion County is a rural county that is home to a large Catholic population — it was one of Beshear’s strongest non-coal counties. Given that the 2019 race happened almost four years ago, while Amendment 2 was just last year, Beshear’s relatively better performance in eastern Kentucky could also be a sign of the further weakening of the broader Democratic position in that area — this is something to watch for in Beshear’s reelection bid in November.
In what has become a familiar dynamic by this point, “No” ran farthest ahead of Beshear in the counties surrounding the commonwealth’s two major metro centers, Louisville and Lexington.
Looking back to 2020 (and forward to 2024)
For each of the seven states that we’ve looked at over the past two weeks, we’ve compared abortion-related ballot measures to state-level races. Now, to tie things together, we’ll aim to “standardize” things by comparing the recent ballot measures to Biden’s 2020 performance. Earlier this year, Crystal Ball Managing Editor Kyle Kondik pioneered a useful way to analyze state-level trends over time — by dividing the states in half. Using this method, he started adding up the most populous counties in a state until he got to roughly half the statewide vote. Those most populous counties made up the “top half,” while the balance of a state constituted its “bottom half.”
Table 1 considers how the halves of each state that we’ve surveyed voted in the 2020 election compared to their respective ballot measures.
Table 1: Biden 2020 vs pro-abortion rights position in state halves
Biden underperformed the pro-abortion rights ballot position in each of the 14 halves on Table 1, although he came closest in California’s top half, which is one of the bluest halves overall and includes Los Angeles County. In each state, the change between the elections was more pronounced in the bottom half — top halves are generally more Democratic overall, so there may have just been less room for bigger shifts.
Other than Vermont, which we partitioned by municipality instead of county (it was easier to achieve a 50/50 split of population that way), the biggest movement from 2020 came in Kansas, underscoring why its 2022 Value Them Both vote came as such a shock to the political system.
For 2024, Maryland and New York will have abortion-related questions on their general election ballots, while such ballot measures are possibilities in more than a half dozen other states. Later this year, Ohio, fresh off of voting down Issue 1, which was seen as a proxy fight in the abortion rights wars, will vote on a state constitutional amendment that more directly addresses the subject — we discussed that in detail a few weeks ago.
J. Miles Coleman is an elections analyst for Decision Desk HQ and a political cartographer. Follow him on Twitter @jmilescoleman.
See Other Political Commentary by J. Miles Coleman.
See Other Political Commentary.
Views expressed in this column are those of the author, not those of Rasmussen Reports. Comments about this content should be directed to the author or syndicate.
Rasmussen Reports is a media company specializing in the collection, publication and distribution of public opinion information.
We conduct public opinion polls on a variety of topics to inform our audience on events in the news and other topics of interest. To ensure editorial control and independence, we pay for the polls ourselves and generate revenue through the sale of subscriptions, sponsorships, and advertising. Nightly polling on politics, business and lifestyle topics provides the content to update the Rasmussen Reports web site many times each day. If it's in the news, it's in our polls. Additionally, the data drives a daily update newsletter and various media outlets across the country.
Some information, including the Rasmussen Reports daily Presidential Tracking Poll and commentaries are available for free to the general public. Subscriptions are available for $4.95 a month or 34.95 a year that provide subscribers with exclusive access to more than 20 stories per week on upcoming elections, consumer confidence, and issues that affect us all. For those who are really into the numbers, Platinum Members can review demographic crosstabs and a full history of our data.
To learn more about our methodology, click here.
