Notes on the State of Politics: The Mamdani Upset and a Deeper Look at Virginia
A Commentary By J. Miles Coleman
KEY POINTS FROM THIS ARTICLE
— In New York City, state Assemblyman Zohran Mamdani pulled off an upset in the Democratic primary for mayor, defeating former Gov. Andrew Cuomo.
— One of the things that probably worked against Cuomo was the fact that some of his key constituencies are less likely to be registered to vote in Democratic primaries.
— Turnout in Virginia’s primary last week was slightly higher than what 2021’s primary saw, though there were some important locality-level changes.
— In winning the Democratic primary for lieutenant governor, state Sen. Ghazala Hashmi (D) won most of the state’s congressional districts.
— The close Democratic primary for Attorney General helped illustrate how primary turnout patterns differ from that of general elections.
An upset in NYC
Though we typically stick to statewide and federal level politics, it would have been hard to publish an election-related article today without getting into New York City’s Democratic mayoral primary.
While about a dozen candidates showed up on the Democratic ballot, the contest basically evolved into a two-way fight between three-term state Assemblyman Zohran Mamdani and former Gov. Andrew Cuomo.
Although this is the second mayoral cycle where the city has used a ranked-choice format—final tabulations are set to be run next week—Mamdani, a 33-year-old democratic socialist who has vowed to lower the cost of living in the city, will be the Democratic nominee. As of this writing, Mamdani leads the field with 43.5% of the vote, while Cuomo is at just over 36%. The third-place finisher, City Comptroller Brad Lander, took about 11% of the vote. During the closing weeks of the race, Lander and Mamdani ran as, essentially, a ticket: Lander told his supporters to rank Mamdani as their second choice, and vice-versa. So we can reasonably expect Mamdani to receive much of Lander’s voters once ranked-choice tabulations kick in. Cuomo has already conceded the primary.
While Mamdani was clearly gaining steam throughout the primary campaign, the outcome is still a surprise. Though Cuomo, to say the least, did not leave office in 2021 under ideal circumstances, his name recognition, track record in Democratic politics, and financial advantage gave his candidacy something of an “inevitability” factor. In some years, that may have played to his advantage. But the Democratic electorate, which seems frustrated with national leadership that it perceives as too risk-averse, did not seem willing to simply stick with the devil they knew.
With the primary season for the midterms not too far out on the horizon, we have been thinking of the 2018 Democratic primary in NY-14, when a then-upstart Alexandria Ocasio-Cortez shocked the system by ousting then-Rep. Joe Crowley, a veteran of the House. Given the current sentiment of grassroots Democrats, our expectation going into the 2026 cycle was that we’d see one, if not several, similar upsets. As it turned out, we didn’t even have to wait until 2026, albeit in a mayoral race as opposed to a congressional contest.
Map 1, provided by Sage of Time, who is a veritable mapping machine on X/Twitter, shows the breakdown of yesterday’s vote.
Map 1: New York City Democratic mayoral primary, initial vote
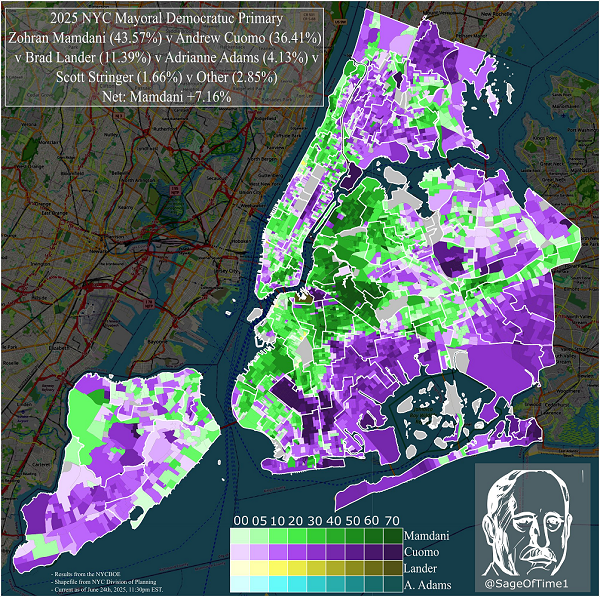
Mamdani, in green, ran especially well in his home area of Astoria, which is across Roosevelt Island from Manhattan’s Upper East side. Astoria is part of what city analyst Michael Lange refers to as the “Commie Corridor.” Broadly speaking, this section of the city, which is filling up with progressive gentrifiers, starts with Astoria and runs south along the East River into Brooklyn. One trend that showed up consistently in polls was Mamdani’s strength with college educated voters—as the dark shades of green show, that manifested in spades along this left-wing epicenter. This area also stands out quite nicely on another map from Sage of the 2018 Democratic primary for governor, as progressive actress Cynthia Nixon carried the area despite losing handily to Cuomo, who was then the incumbent governor.
But Mamdani didn’t only win with college educated progressives. In Lower Manhattan, Mamdani took most precincts that cover Chinatown. Going back near the “Commie Corridor,” Mamdani got some of his largest margins in the city in the Latino-majority precincts of Bushwick, an area that makes up the heart of New York’s 7th District. During the campaign, one of his visible supporters was Rep. Nydia Velázquez (D, NY-7)—according to calculations by Split Ticket’s Armin Thomas, NY-7 was Mamdani’s best congressional district in the city, giving him 65% yesterday.
Cuomo’s base was a coalition of Black voters in the neighborhoods near Jamaica Bay, Orthodox Jews in Brooklyn, Latinos in the Bronx, wealthy penthouse-dwellers on either side of Central Park, and working class whites on Staten Island. While Cuomo seemed to hold up well with some of those groups—as the dark purple on the map shows, his majorities in Borough Park, with its large Orthodox Jewish population, were crushing—some softness was obvious. For instance, NY-8, which is plurality Black by composition and is held by House Minority Leader Hakeem Jeffries, seemed like prime Cuomo turf (Jeffries was one the big-name state Democrats who stayed neutral in the primary). But according to Thomas’s numbers, Cuomo actually finished barely behind Mamdani in the district.
Staten Island was another somewhat wobbly part of the Cuomo coalition. This borough has traditionally been favorable to his family: with the exception of the 1994 general election, when the elder was defeated for reelection, Cuomo and his father, the late Gov. Mario Cuomo (D), carried it in every election they contested. While it is also, by far, the city’s least populous borough, Cuomo would have wanted to come out of it with much more than the 46%-37% advantage that he actually took. Michael Baharaeen of the Liberal Patriot pointed out that Staten Island profiles as one of the working class parts of the city where Democrats have bled registered voters since Cuomo’s time in office.
On a bigger picture note, though Mamdani was behind in several polls heading into Election Day, there were signs he was closing in on Cuomo. The difference—or, lack thereof—between voting methods also offers some support for the idea that late deciders broke to Mamdani. During the early voting period, which took place last week, it was clear that many of the aforementioned pro-Mamdani areas were punching above their weight. So, if Mamdani was racking up a lead with early voters, surely Cuomo would do better with voters who waited until Election Day, or so the conventional wisdom went. As it happened, Mamdani’s 43%-34% lead in the initial batch of results from the night—votes that were, likely, cast early—was not much different from the ultimate result.
So, what’s next in the race? As many of our readers probably know, under New York’s fusion voting system, non-major parties have their own “lines” in the general election, although they can also endorse major-party nominees. In the case of this race, the Working Families Party (WFP), which typically aligns itself with Democratic nominees, endorsed Mamdani last month. Had Mamdani lost the Democratic primary, he could have still appeared in the general election as the WFP candidate. Meanwhile, Cuomo established his own party, Fight and Deliver, in advance of the primary, which gives him a line in the general election. As a bit of a historical aside, Mario Cuomo was similarly denied the Democratic nomination for mayor in 1977 and ran in the general election as the Liberal Party’s candidate, although he still lost to then-Rep. Ed Koch (D). While the younger Cuomo could theoretically continue to campaign under the Fight and Deliver banner, the apparently decisive margin that he lost the Democratic primary by may give him some pause (while Cuomo conceded the Democratic nomination last night, he did not rule out staying in the race).
Aside from Mamdani, and possibly Cuomo, the general election will, to a degree, be a rematch of 2021. Incumbent Mayor Eric Adams, who was elected four years ago, exited the Democratic primary to run as an independent—although, in part because of a litany of scandals, his approval ratings are generally low. Curtis Sliwa, founder of the anti-crime Guardian Angels group, was the GOP’s 2021 nominee and was unopposed for the nomination this year. There may still be some twists and turns in the general election if the anti-Mamdani forces are able to coalesce, although their options for doing so are not great right now.
For now, Mamdani’s apparent victory could represent a watershed election in New York’s political history. At a national level, while Democrats nominated center-left candidates earlier this month for the key gubernatorial contests in New Jersey and Virginia, Mamdani’s win this week gives Democrats a much different and much more left-wing candidate than they are fielding in those other significant 2025 races.
Virginia Primary Odds and Ends
A week after the primary, results from Virginia’s 2025 Democratic primary are nearly finalized. While we gave some initial observations on the statewide races last week, we are digging a little deeper into the Virginia results now that the dust has basically all settled.
At the top of the 2025 Democratic primary ticket was the crowded contest for lieutenant governor, in which state Sen. Ghazala Hashmi (27.5%) narrowly beat out former Richmond Mayor Levar Stoney (26.5%) and fellow state Sen. Aaron Rouse (26.25%).
Last week, we noted that, even as this month’s primary lacked a gubernatorial race at the top of the ticket, turnout in the primary for the lieutenant governor contest was approaching what 2021’s gubernatorial primary saw. Well, as more votes have trickled in since Election Day, 2025 has apparently surpassed the turnout from four years ago: as of Tuesday, just over 497,000 votes had been cast in last week’s lieutenant gubernatorial race, while 2021’s gubernatorial primary saw about 495,000. While that result probably speaks to the combination of a more enthusiastic Democratic electorate and the popularity of early voting taking hold, there were some important geographical patterns at play. Map 2 compares turnout in the two primaries.
Map 2: Raw vote comparison, 2021 vs. 2025 Democratic primaries
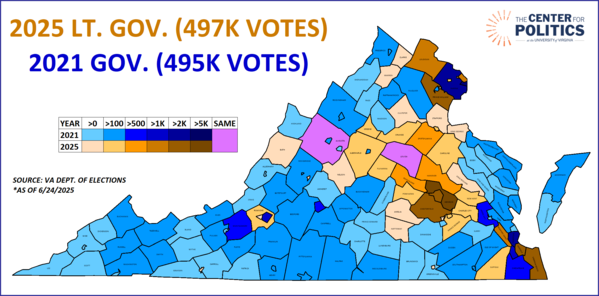
Even as turnout was up a few thousand votes this year, almost 90 of the 133 localities cast more votes in 2021. Obviously, the larger localities saw the biggest raw vote changes, though the Richmond area saw consistently higher turnout this year, while Northern Virginia and the Hampton Roads regions were mixed bags. Henrico County led the way, with an increase of 5,100 votes, while Chesterfield County was not far behind, with a 4,900-vote gain—Richmond, which was in third place, itself cast 4,400 more votes than it did in 2021. The two biggest losers, meanwhile, were both in Northern Virginia: Alexandria City saw a loss of nearly 7,000 votes, while Fairfax County dropped by 4,200 votes. Hampton, in the southeast, saw the third most-pronounced loss, casting 4,000 fewer votes than this time four years ago.[1] With these numbers, the Richmond area seemed to set the tone for the state last week.
Getting into actual candidate-specific results, Map 3 breaks down the primary for Lieutenant Governor by congressional district.
Map 3: 2025 Virginia Lt. Governor Democratic primary by Congressional District
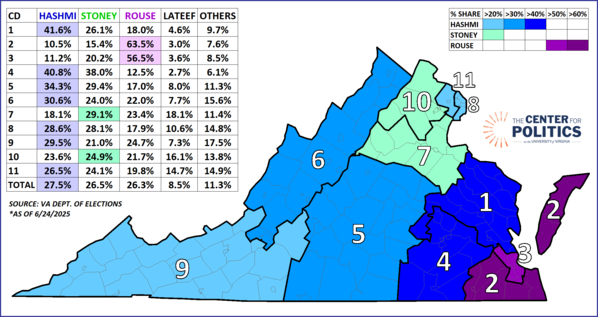
In any case, last week we highlighted Rouse’s strength in the Norfolk media market, which clearly carried over to the congressional district level. Rouse carried his populous home locality, Virginia Beach, with nearly 70% of the vote. This ended up being only a few notches better than his overall showing in VA-2, which gave him 63.5%. Rouse’s 56.5% in the heavily Black VA-3 basically matched his result in the Norfolk media market.
Moving west, the three aforementioned Richmond-area counties are divided between districts 1 and 4, and Hashmi cleared 40% in both. District 5, which includes Charlottesville and runs south to the North Carolina border, was Hashmi’s third-best district, probably in part because during the last round of redistricting, it took in some counties that are in Richmond’s orbit.
Geographically, Stoney was hurt because Southside—where he showed the most consistent strength—is split between districts 4 and 5. While Stoney ran relatively well in the rural localities in both districts, the urban areas, which were friendlier to Hashmi, outvoted them.
Though a Richmond-based candidate, Stoney became the choice of the Northern Virginia exurbs. In general elections, VA-7 is the district that usually tracks closest to the state, but in the context of this Democratic primary, it could be considered the most “contrarian” district. Stoney, who carried the Fredericksburg area, won VA-7 by a fairly clear 29%-23% over Rouse. District 7 also represented Hashmi’s only fourth-place finish, as she finished a few votes behind Prince William County School Board Chair Babur Lateef, who is from the district.
Districts 8 and 11, which make up the core of Northern Virginia, along with 6 and 9, in Appalachia, all lacked a home area candidate in the top three. With that, all four districts went with the winner, giving Hashmi pluralities of about 30% or less.
Virginia’s other statewide Democratic primary was the contest for state Attorney General, which produced another close race. In his second run for the nomination, former Del. Jay Jones defeated Henrico County Commonwealth’s Attorney Shannon Taylor by a 51%-49% vote. As with Rouse in the lieutenant gubernatorial primary, Jones was a candidate based in the southeastern part of the state and got a strong showing from his home region—he carried districts 2 and 3 with a little more than 60% of the vote. Outside of those districts, though, the map was quite depolarized: though Taylor carried more districts overall, neither candidate took more than 54% of the vote in the remaining 9 districts. Jones’s margins at home, in other words, accounted for his statewide margin.
Map 4 considers the Attorney General primary and gives the winner of each district. In part because of the depolarization mentioned above, this two-way race is not as visually intriguing as the lieutenant governor map, although in this case, we’ve highlighted one district in particular—more on that below the map.
Map 4: 2025 Virginia Attorney General Democratic primary by Congressional District
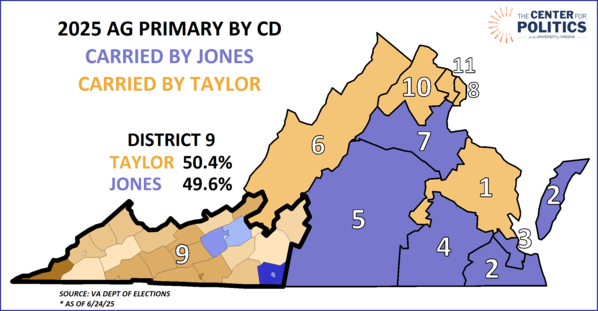
So, why does District 9 get a little extra attention in this map? After all, it’s hard to see what this 70% Trump district could tell us about the Democratic primary, right?
True, this conservative district tends to punch below its weight in Democratic primaries—in last week’s election, it cast just 3% of the statewide vote—but we thought it offered some insight into the turnout patterns that drove Jones’s win.
In our initial district-level calculations, we had Jones very narrowly carrying this overwhelmingly Trumpy district. Though we eventually found Taylor up by less than a percentage point there as late ballots came in, the close result in southwestern Virginia caught our attention because Jones only carried a few localities there.
Specifically, Jones got nearly 50% of the vote in VA-9 with only 5 of the 28 localities it contains. However, the types of localities that Jones carried were key. In the eastern part of the district, Jones carried Montgomery County and Radford City, both of which backed Kamala Harris—the former includes Virginia Tech, while the latter is also essentially a college town, containing the duly named Radford University. Along the North Carolina border, Jones also carried Martinsville and the surrounding Henry County—the two localities combined have a nearly 30% Black population, which is considerably higher than the rest of the district. Pulaski County, which is just west of Radford, stands out as the only heavily white rural locality Jones won. So, in other words, the few localities that he carried were also the ones that had the most naturally “Democratic” constituencies—while they make up 24% of the district by registration, they cast 42% of the primary vote.
The Virginia Public Access Project, which regularly puts out useful data visuals, published a map of overall voter turnout in the primary. According to their data, statewide, 7.7% of voters cast ballots. When we apply this type of analysis to VA-9, we can also see how Taylor managed just a small majority there: among her 23 counties, which are deep red in general elections, only about 2% of active voters turned out, while more like 5% did so in Jones’s localities. This may actually be a way to connect the Virginia primary with the New York City primary: Cuomo’s performance on Staten Island was loosely analogous to Taylor’s in VA-9: both carried their areas by only small margins, perhaps because fewer of their voters are voting in Democratic primaries.
[1]Note: The text under Map 2 originally incorrectly referred to Norfolk as a locality that cast fewer votes in 2025.
J. Miles Coleman is an elections analyst for Decision Desk HQ and a political cartographer. Follow him on Twitter @jmilescoleman.
See Other Political Commentary by J. Miles Coleman.
See Other Political Commentary.
Views expressed in this column are those of the author, not those of Rasmussen Reports. Comments about this content should be directed to the author or syndicate.
Related Articles

Rasmussen Reports is a media company specializing in the collection, publication and distribution of public opinion information.
We conduct public opinion polls on a variety of topics to inform our audience on events in the news and other topics of interest. To ensure editorial control and independence, we pay for the polls ourselves and generate revenue through the sale of subscriptions, sponsorships, and advertising. Nightly polling on politics, business and lifestyle topics provides the content to update the Rasmussen Reports web site many times each day. If it's in the news, it's in our polls. Additionally, the data drives a daily update newsletter and various media outlets across the country.
Some information, including the Rasmussen Reports daily Presidential Tracking Poll and commentaries are available for free to the general public. Subscriptions are available for $4.95 a month or 34.95 a year that provide subscribers with exclusive access to more than 20 stories per week on upcoming elections, consumer confidence, and issues that affect us all. For those who are really into the numbers, Platinum Members can review demographic crosstabs and a full history of our data.
To learn more about our methodology, click here.