Leaning Into State Trends: The Midwest and Interior West
A Commentary By J. Miles Coleman
The two regions have four Biden-won states that will be key in 2024
KEY POINTS FROM THIS ARTICLE
— Both the Midwest and Interior West have states that Joe Biden carried by less than his popular vote margin in 2020.
— In the Midwest, Michigan and Wisconsin will likely be prime battlegrounds states next year, although Michigan seems a harder lift for Republicans.
— In the Interior West, Arizona’s Republican lean has been eroding in elections since 2008 — this allowed Biden to carry it in 2020, but Democrats will also have to work to keep neighboring Nevada in their column.
Presidential trends in the Midwest and Interior West
This week, we’ll continue our look at how each state has leaned in presidential elections since 2000. A couple of weeks ago, we started with the Northeast and Greater South. Today, we’ll consider the Midwest and Interior West. In our final installment, which will be out within the next few weeks, we’ll conclude with the West Coast, as well as some larger observations.
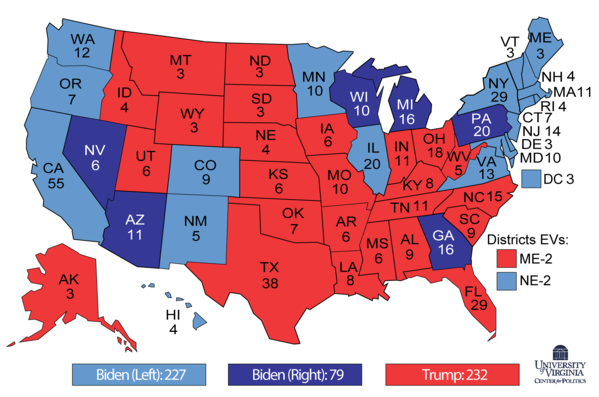
As a refresher, when we mention how a state “leans,” we are referring to its deviation from the national popular vote in a given election. In 2020, for example, Joe Biden carried 6 states by less than his popular vote margin — those 6 are the dark blue states shown in Map 1.
Map 1: 2020 presidential election showing the lean of Biden-won states
Additionally, for this series of articles, we’ve been using the regions of the country that Managing Editor Kyle Kondik established when looking at changes in the House over the last several decades.
THE MIDWEST
Table 1: 2000-2020 Democratic presidential lean of Midwest states
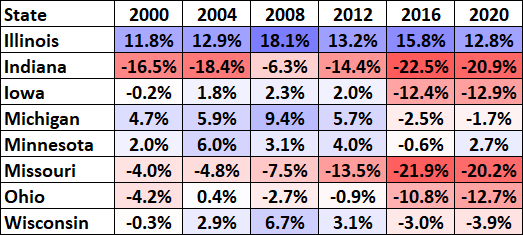
Note: The table considers the 2-party vote each year
Source: Dave Leip’s Atlas of U.S. Presidential Elections
Of the 5 regions we’ll examine in this series, the Midwest is the most marginal in presidential elections. The 8 states that make up this region were evenly split in the 2020 election, although Biden carried 2 of his 4, Michigan and Wisconsin, by margins smaller than his national popular vote margin.
Illinois, where Chicago’s Cook County makes up close to 40% of the statewide vote, is easily the most Democratic state in the region. Though Illinois has seen its share of internal shifts — as Democrats have turned some of its historically red suburbs blue, they are now considerably less competitive in downstate counties — its topline lean since 2000 has basically been stagnant over the longer term. In 2000, Al Gore’s margin was about 12 percentage points better than his national margin. Two decades later, Joe Biden took that up slightly, to 13%. Not surprisingly, in between those years, Illinois was at its most Democratic in 2008, when its then-senator, Barack Obama, captured the White House.
Joining Illinois as the only other Midwest state that leaned left of the national vote in 2020 was Minnesota. Though Minnesota has the longest streak of voting for Democratic presidential nominees — it last voted Republican in 1972 — the 2016 election represented the first instance since 1952 that it leaned right of the national vote. Though Minnesota only barely tracked right of the nation in 2016, it seemed to give Republicans hope of flipping it, as Donald Trump held several rallies there. But as the core counties in Greater Minneapolis all moved at least 5 points to Biden in 2020, Minnesota regained its marginal Democratic lean. As with Pennsylvania, Minnesota was a peripheral Great Lakes state that gave John Kerry the best showing of all recent Democrats. As with Pennsylvania, Kerry seemed to have the best balance of coalitions: he about matched Obama’s performances in the ancestrally Democratic Iron Range but still dominated in the core Twin Cities counties.
Aside from Pennsylvania, which we grouped in the Northeast region, 2 of the Democratic “Blue Wall” states that Trump flipped in 2016 are in the Midwest: Michigan and Wisconsin. In 2000, Wisconsin matched the national popular vote almost perfectly, while Michigan leaned nearly 5 points left of the nation. In 2008, Obama, as a Midwesterner himself, pushed both states to their bluest points of the last two decades — Michigan, which was hit especially hard during the onset of the Great Recession, was nearly 10 points bluer than the national vote. In 2012, both states reassumed their 2004 bearings. In retrospect, this may speak to Kerry’s strength in the Upper Midwest, as he essentially matched Obama’s 2012 relative showing despite not being from the region (the Midwest historically has dovish tendencies, so the Iraq War’s salience may have also worked against Bush there).
Michigan and Wisconsin took on similarly mild GOP leans in 2016. Biden carried both states in 2020. He brought Michigan closer to the national vote, but, importantly, Wisconsin continued to trend rightward. Table 1 is why, despite some recent pro-Democratic developments in the Badger State (namely last month’s state Supreme Court race), we would probably start it off as a Toss-up in the Electoral College.
Iowa and Ohio, on either side of the Midwest region, were the 2 Obama-to-Trump states in the region. Though they both leaned 13 points right of the nation by 2020, they took somewhat divergent paths. In 2000, Iowa, like Wisconsin, matched the national vote almost perfectly. It retained a small Democratic lean until taking a hard rightward shift in 2016. In fact, Iowa’s 14.4-point redshift from 2012 to 2016 represented the largest cycle-to-cycle shift on Table 1. Ohio, as Managing Editor Kyle Kondik has documented, was a historical bellwether, albeit one that leaned slightly rightward: its only 2 misses in the modern era prior to 2020 were against Democrats (in 1944 and 1960). During the first 4 elections of Table 1, Ohio was true to its historic form — aside from giving Kerry a relatively strong showing in 2004, it had a light red lean. But in the Trump era, it became a firmly GOP-leaning state.
Also on opposite sides of the region, Indiana and Missouri have moved eerily in tandem in recent elections. Indiana has long been the most conservative state in the region, as was on display in 2000 and 2004, while Missouri had been a presidential bellwether since 1956. Then, the 2008 election upset the applecart. As Indiana narrowly voted for Obama, it moved less Republican than Missouri for the first time in decades (Missouri barely voted for John McCain). For 2012, the Obama campaign did not contest the pair as seriously as it did in 2008; their red lean was most pronounced in 2016, although there was some minor regression in 2020.
THE INTERIOR WEST
Table 2: 2000-2020 Democratic presidential lean of Interior West states
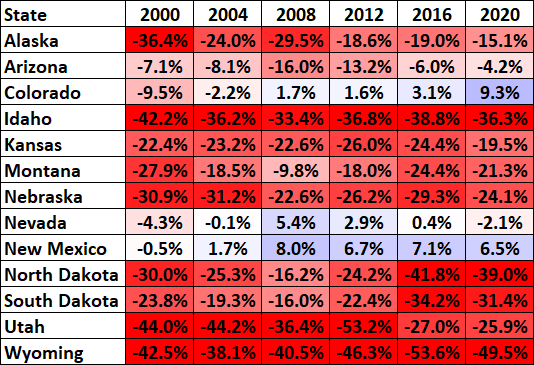
Note: The table considers the 2-party vote each year.
Source: Dave Leip’s Atlas of U.S. Presidential Elections
Though each has a Biden-won congressional district anchored in their respective largest metro areas, Kansas and Nebraska have been 2 of the most consistently Republican-leaning states in the nation. Until it dipped to 19.5% in 2020, Kansas has typically had a Republican lean in the low-20s. Nebraska was at its reddest during the George W. Bush era. Though blue trends in Omaha and Lincoln have helped nudge the state leftward — and may continually provide Democratic nominees an extra electoral vote, or even 2 — Republicans should have little trouble winning statewide there. (Nebraska, along with Maine, awards some of its electoral votes by congressional district).
One of the biggest Republican success stories, at least from the standpoint of electoral trends, has been the reddening of the Dakotas. One of the largest shifts on Table 2 was North Dakota from 2012 to 2016: it moved nearly 18 points rightward, while South Dakota saw a lesser, but still notable, 12-point shift. Both Dakotas got somewhat less red in 2020, but Biden’s performance was still significantly down from any of the pre-Hillary Clinton Democratic nominees.
Moving into the Rocky Mountain states, Idaho, Wyoming, and Utah are all red states that are unlikely to see any serious presidential politicking in 2024. Of the trio, Utah has had the most volatile movements. In the first 3 elections on Table 2, Utah looked a lot like Idaho and Wyoming. From 2012 to 2016, Republicans went from nominating a candidate who fit Utah perfectly to one, who, well, didn’t. With that, Utah’s GOP lean was halved, going from 53 points to 27 points, where it basically stayed in 2020.
One red-leaning Rocky Mountain state that is set to see a competitive statewide race in 2024 is Montana, albeit at the senatorial, not presidential level. The only year in Table 2 where Montana even came within 10 points of the national popular vote was 2008, and just barely so. In 2012, Democratic Sen. Jon Tester was reelected by 4 points as Obama did 18 points worse than his national showing. If Biden could get Montana to lean, say, within 20 points of the national vote, that may make Tester’s path somewhat less daunting.
In the 2000 election, New Mexico was easily the most marginal of the Interior West states. In 2000, as Gore carried it, it leaned half a point right of the national popular vote. But 2004 represented something of a reversal: as Bush narrowly carried it, he did almost 2 points worse there than he did nationally. Since 2008, though, New Mexico has kept a mild, but consistent, Democratic lean.
Colorado’s change from 2000 to 2020 was satisfyingly symmetric, at least from a numerical perspective: it moved from just over 9 points right of the nation to just over 9 points to the left. We should note, though, that in 2000 Ralph Nader took 5% statewide there (in the liberal bastion of Boulder County, he pulled 12%). The tables in this series don’t consider third parties, so assuming most of Nader’s support would have gone to Gore, Colorado probably would have registered as less red in 2000. From 2008 to 2016, Colorado was a swing state that stayed a few ticks left of the nation. In 2020 it moved 6 points leftward, supplanting New Mexico as the bluest state in the region.
Arizona and Nevada are the Interior West states that will likely see the most attention from presidential campaigns next year. John McCain’s performance in 2008 represented the worst national showing for a Republican this century, but Table 2 suggests that McCain actually had some pull at home. In 2008, Arizona leaned 16 points right of the national vote, clearly its largest deviation. Romney came within a few points of matching McCain, but with Trump on the ballot in 2016, Arizona’s red lean was cut in half, and it whittled down to just 4.2 points in 2020, allowing Biden to carry it in his 4.5-point national win.
No state has come within 5 points of the national popular vote in all 6 presidential elections, but Nevada is among the states that comes closest. As with Michigan, the economy in Nevada was especially tough in the early days on the Great Recession, likely helping Obama to translate dissatisfaction with the Bush administration into votes. Nevada leaned 5.4 points left of the nation in 2008, but otherwise was within a few points either way. As Biden improved on Hillary Clinton’s national margin, he basically matched her margin in Nevada — meaning it trended rightward in 2020.
Finally, we grouped Alaska into the Interior West category, given its political and economic similarities to the Interior West states as opposed to the West Coast ones. It started the century as one of the more conservative states in the region. Its 36-point Republican lean in 2000 was close to being on par with other deep red Rocky Mountain states like Idaho or Wyoming — although, as with Colorado, Ralph Nader took a large share of the vote there, likely driving the Democratic share of the two-party vote down. Perhaps if Nader had been off the ballot, 2000 in Alaska would have looked more like 2004, where it was 24 points right of the nation. Alaska’s red lean ebbed back upward in 2008, when then-Gov. Sarah Palin was on the Republican ticket, but it has dropped to within 20 points of the national vote in the last 3 presidential elections. Indeed, in 2020, Alaska was the least Republican-leaning Trump-won state in the region.
CONCLUSION
Both the Midwest and the Interior West have several states that will be seen as top-tier battlegrounds next year. In the Midwest, we would probably start Biden off as a narrow favorite in Michigan, but Wisconsin’s slide to the (relative) right in 2020 means that it will probably be a harder state to secure. If the Biden campaign’s early spending selections are any indication, Iowa and Ohio have exited the presidential battleground category stage right — as Table 1 shows. In the Interior West, Arizona and Nevada — which, like Michigan and Wisconsin, will feature key Senate races next year — should continue to be high priorities for both parties.
J. Miles Coleman is an elections analyst for Decision Desk HQ and a political cartographer. Follow him on Twitter @jmilescoleman.
See Other Political Commentary by J. Miles Coleman.
See Other Political Commentary.
Views expressed in this column are those of the author, not those of Rasmussen Reports. Comments about this content should be directed to the author or syndicate.
Related Articles

Rasmussen Reports is a media company specializing in the collection, publication and distribution of public opinion information.
We conduct public opinion polls on a variety of topics to inform our audience on events in the news and other topics of interest. To ensure editorial control and independence, we pay for the polls ourselves and generate revenue through the sale of subscriptions, sponsorships, and advertising. Nightly polling on politics, business and lifestyle topics provides the content to update the Rasmussen Reports web site many times each day. If it's in the news, it's in our polls. Additionally, the data drives a daily update newsletter and various media outlets across the country.
Some information, including the Rasmussen Reports daily Presidential Tracking Poll and commentaries are available for free to the general public. Subscriptions are available for $4.95 a month or 34.95 a year that provide subscribers with exclusive access to more than 20 stories per week on upcoming elections, consumer confidence, and issues that affect us all. For those who are really into the numbers, Platinum Members can review demographic crosstabs and a full history of our data.
To learn more about our methodology, click here.