Checking Back on Key 2024 Counties, Part Two: The Sun Belt
A Commentary By J. Miles Coleman
KEY POINTS FROM THIS ARTICLE
— In North Carolina and Georgia, Kamala Harris gained in some fast-growing suburban counties, but it was not enough to cancel out the drift to Donald Trump elsewhere in those states.
— Arizona was Trump’s strongest of the presidential Toss-up states in part because its border counties continued to shift strongly in his direction.
— Trump carried Nevada because he was the best-performing Republican in Clark County (Las Vegas) in decades, although Washoe County (Reno) narrowly stuck with Harris.
How pivotal Sun Belt counties voted in 2024
Last week, we began looking back at several of the key counties in Toss-up states that we flagged before the 2024 election to see what, if anything, they told us about the election overall. Our first installment covered the three Industrial North states. This week, we turn south to the Sun Belt states—our original article outlining key counties in those states is here.
North Carolina
In the Charlotte area, Cabarrus County saw the most pro-Democratic swing between the 2016 and 2020 presidential elections. Though Kamala Harris did better across the board there than Joe Biden did four years ago, its swing was smaller than Democrats would have probably liked: She cut Donald Trump’s margin in the county to 7.7 points, down from the 9.5 points that he won it by in 2020. Harris’s overall improvement in the county came most from precincts that either bumped up against Charlotte’s Mecklenburg County or were situated along Interstate 85.
In our pre-election article, we mentioned that, aside from the presidential race, Cabarrus County seemed likelier than not to flip to then-state Attorney General Josh Stein (D) in the gubernatorial race. Sure enough, Stein carried Cabarrus County by just over 10 points against a very damaged opponent, then-Lt. Gov. Mark Robinson (R). Stein won statewide by nearly 15 points while Trump did so by just over 3 points—so Cabarrus County, like most places in the state, was much bluer in the gubernatorial race.
Though Stein was the only Democrat who actually carried Cabarrus County in a partisan statewide election (North Carolina elects the 10 members of its Council of State on a statewide basis), Republican margins there are, broadly, not what they used to be. Only two statewide Republicans carried Cabarrus County by more than 10 points—as late as 2016, even losing GOP candidates would routinely carry it by double-digits.
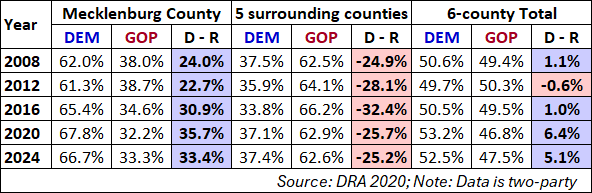
At a broader level, Cabarrus County is one of five relatively large counties that encircle Charlotte’s Mecklenburg County—the others are Gaston, Lincoln, Iredell, and Union, and they are all at least a few notches redder. Collectively, those five counties typically give Republicans just over 60% of the vote. In 2008, the last time that the state voted blue at the presidential level, Barack Obama lost the quintet by just under 25 points. In 2024, the five suburban counties, aggregately, swung about half a percentage point to Harris, which actually made her the best-performing Democratic presidential nominee there since Obama in 2008. Ironically though, Harris underperformed Biden in the metro area overall because she slipped by just over 2 points in Mecklenburg County. Table 1 shows this area’s vote since 2008.
Table 1: Presidential elections since 2008 in the Charlotte, NC area
In northeastern North Carolina, we were watching Wilson County as a proxy for the Black Belt’s vote. With a population close to 80,000, Wilson County is about 40% Black by composition. In 2020, Biden’s 51%-48% margin was down several points from Hillary Clinton’s 52%-46%. Wilson City, in the middle of the county, contains much of the county’s Black population, where a handful of precincts are Black majority. If you had shown us Harris’s numbers in those precincts, we would have assumed she lost the county: as they gave Trump the same 1,200 votes that he got in 2020, Harris got more than 700 fewer raw votes than Biden (about 6,300 instead of 7,000).
Instead, Harris held the county by about half a percentage point. She held up relatively well throughout the balance of the county, in part, it seems, because of educational realignment. Wilson County has two precincts with college attainment rates of over 40%; Trump carried those precincts but did so by 106 fewer votes than he did in 2020, a change that accounted for much of his 159-vote countywide deficit.
In 2022, now-Rep. Don Davis (D, NC-1) won his first term in the House representing a traditionally blue but red-trending seat; as part of his win, he only carried Wilson County by a few tenths of a point. With a tougher district, we noted that he’d likely want to expand his margin there in 2024—as he won a second term in a hard-fought race, he upped his margin there to 51%-46%. At the legislative level, North Carolina Democrats broke the GOP’s supermajority because they reclaimed HD-24, which is basically coterminous with Wilson County, by a 51%-49% vote. So, while the longer-term trends there may be better for Republicans, Wilson County should still be very competitive up and down the ballot.
Georgia
In Georgia, the counties that we chose ahead of the election were Fayette, which is just south of Atlanta, and Sumter, a rural county that is even further south. As with North Carolina, Fayette and Cabarrus counties continued to swing blue but ultimately stuck with Trump, while Sumter and Wilson counties shifted slightly red but still narrowly backed Harris.
On the national 2020 to 2024 swing map, the suburban counties around Atlanta account for one of the brighter spots for Democrats on a map that looks like a sea of red overall. According to Dave Leip’s rankings, 4 of the 10 counties that saw the largest swings to Harris nationally were located around Atlanta. As with 2020, south Atlanta’s Henry County saw the biggest blue swing in the nation—as the Black share of the electorate has grown there, Henry County went from a closely-divided county a decade ago to 65%-35% Democratic in 2024.
Though nearby Fayette did not see movement as extreme as some of its neighbors, its GOP margin continued to trend downwards: Over his three general election campaigns, Trump’s margins there have dropped from 19 points then to 7 points and then to just 3 last year. On Map 1, it was one of just 10 counties in the state where Harris outperformed Biden both in terms of her percentage margin and raw votes.
Map 1: 2020 to 2024 change in Georgia
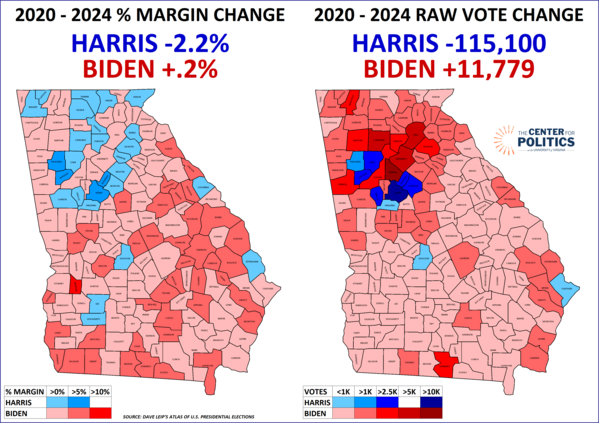
Overall, Harris performed about a percentage point worse than Biden in the greater Atlanta metro area, mostly because she lagged behind him in its core counties. But the sustained blue movement in the counties that are a bit further out accounts for why Georgia was the Sun Belt Toss-up state that gave Trump his weakest margin (he carried it by just over 2 points).
Before he died at 100 in the closing days of 2024, former President Jimmy Carter lived long enough to achieve his goal of casting a vote for Harris. Though the election obviously did not pan out as Carter wanted, Harris at least held Sumter County by a couple of points, which includes the Carter family’s home of Plains. Though our pre-election expectation was that Sumter County would redden to some degree, it ended up as one of the state’s best directional bellwethers: Trump improved 2.6% there while doing 2.4% better than what he got in 2020 statewide.
Arizona
Of the seven states that the Crystal Ball considered Toss-up states during much of the fall presidential campaign, Arizona wound up as Trump’s best. In 2020, Arizona was the closest state in the nation by raw vote margin, backing Biden by just over 10,000 votes. But in 2024, Trump netted almost 200,000 votes to carry the state by 5.5 points.
Considering the statewide picture, it was not too surprising that Harris underperformed Biden’s 2020 margins in all 15 counties. Before the election, we were watching Santa Cruz (Nogales) and Yuma counties, which are both situated on the border and are heavily Latino by composition. Though the state flipped against him in 2020, Santa Cruz County swung a dozen points to Trump, making it his best county relative to his 2016 showing. Last year Santa Cruz was again Arizona’s most redshifting county: Trump improved 16 percentage points there, losing it by 19 points—in 2020, he lost it by 35 points and did so by 47 in 2016. It is telling to compare Santa Cruz County to its northern neighbor, Pima County (Tucson), which is considerably larger and is more demographically reflective of the state overall. In 2016, Pima County began the Trump era by voting about 33 points right of Santa Cruz County—Clinton carried the former 53%-40% and the latter 71%-24%. But by 2024, Harris’s 57%-42% margin in Pima County was only slightly worse than her 59%-40% in Santa Cruz County—if trends continue, Pima County may soon be the bluer of the two.
Elsewhere along the border, Yuma County saw the state’s third-sharpest swing to Trump. As an aside, the second-most pro-Trump swing came in Apache County, which is in the northern part of the state, and showed that Democratic enthusiasm among Native Americans was clearly not up to its 2020 levels. As Trump upped his percentage margin in Yuma County from 52%-46% to 60%-39%, he netted about 9,600 raw votes—a gain which, by itself, would have been almost enough to erase his 10,457-vote statewide deficit from 2020. Yuma County also shows that Trump’s gains along the southern border were not limited to Arizona: It shares a media market with Imperial County, California, which saw one of 2024’s most surprising results. After he lost it by 42 points in 2016 and 24 points in 2020, Trump flipped Imperial County 49%-48% last year.
In 2020, Arizona saw, directionally, a distinction between Latino-majority precincts along the border and those in the urban counties. As Latino precincts in Santa Cruz and Yuma, collectively, saw double-digit percentage swings against Biden, he only slightly underran Clinton’s margins in Latino-majority precincts in Maricopa (Phoenix) and Pima counties. But in 2024, Arizona’s Latino-majority precincts were more in sync, regardless of their geography. According to our calculations using data from Redistricter, Harris ran 18 points behind Biden in border-area Latino precincts and 13 points behind him in their urban counterparts. That swing was so broad that even as now-Sen. Ruben Gallego (D) won the state’s open-seat Senate contest by a larger margin than Biden achieved when he carried the state, Gallego’s numbers in Latino precincts were still slightly down from what Biden got in 2020.
Nevada
Before the 2024 election, Nevada was the only one of the seven presidential Toss-up states that Trump had never carried—but after losing it twice by just over 2 points, it backed him by 3 points.
Typically, the pair of Clark (Las Vegas) and Washoe (Reno) counties dominate the state—they combined to cast nearly 90% of the statewide vote in 2020—so we were looking at the margins in those two counties. Essentially, Harris was going to need enough of a buffer from those two counties to offset losses in the balance of the state, which is much redder.
While recent elections have shown that Democrats don’t need to win Clark County by double-digits, there was a clear “danger” zone. Using 2022 as a template, Sen. Catherine Cortez Masto (D) was reelected with a 7.8% margin in Clark County while then-Gov. Steve Sisolak’s (D) 5.7% margin there was not good enough for him to secure a second term. In 2024, Trump held Harris to less than a 3-point win in Clark County—with 70% of the statewide vote coming from there, that type of swing was essentially the whole ballgame. In 2004, the last time before 2024 that Nevada voted Republican for president, then-Sen. John Kerry (D) carried Clark County by almost 5 points.
If Clark County has reddened since 2004, some of the most pro-Democratic trends have come in Washoe County—in fact, this marginal county is now a must-win county for Democrats. While Harris held it, her 1-point margin there was more on par with Clinton’s 2016 margin (1.3%) than Biden’s from 2020 (4.5%). So, simply put, there was virtually no way Harris could have overcome Trump’s margins in the rural parts of the state with sub-Kerry numbers in Clark County and sub-Clinton numbers in Washoe County.
Though Trump’s gains in Clark County were strong across the board—he improved over his 2020 showing in the vast majority of precincts—as with Arizona, he continued to perform especially well in Latino-heavy precincts. For some perspective, we’ll go back to a cycle that (very) longtime Crystal Ball readers would remember: 2010. While the late Senate Majority Leader Harry Reid’s (D) win was one of the brightest spots nationally for Democrats, Nevada’s gubernatorial race that year was a different story. Brian Sandoval, a Republican who was viewed as a potential national figure, defeated Rory Reid, the senator’s son and a member of the Clark County Commission, by a 53%-41% vote to become governor. Sandoval’s sweep of the state included a 49%-47% margin in Clark County. Fourteen years later, Trump won the state by a much smaller margin but the trajectory in Clark County’s Latino precincts stands out: among precincts there that are supermajority Latino (we are defining that as 60% of residents or more), Trump outperformed Sandoval by 12 points, as he lost them by 29 points instead of 41. Map 2 isolates those precincts, most of which are located in the eastern Las Vegas area.
Map 2: 2010 gubernatorial vs. 2024 presidential races in Clark County’s supermajority Latino precincts
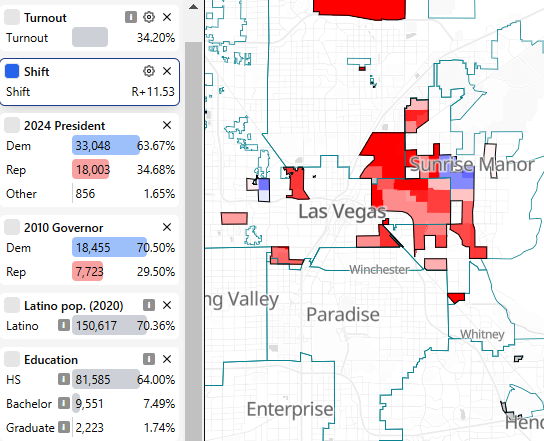
Source: Redistricter
Aside from the state’s two large counties, its only remotely competitive locality is the state capital, Carson City. Though Trump still held it by just over 11 points, he performed a tenth of a point worse there than he did in 2020.
Conclusion
Across the presidential battleground states, suburban and touristy counties that we flagged across the Toss-ups states generally continued to drift left but just not to the degree Harris would have wanted. Meanwhile, the counties that we were watching that had large Latino or white working-class populations—think the Arizona border counties we covered this week for the former category and Lackawanna County, Pennsylvania for the latter—saw some considerably stronger shifts that powered Trump to victory.
Though it wasn’t in a swing state, going into 2024, the longest-running national bellwether county was Clallam County, Washington. After picking the winner in every presidential election since 1980, Clallam County voted decisively for Harris, as Washington State’s Olympic Peninsula stood out as one of 2024’s most left-trending areas. The Clallam County example shows that some counties are predictive…until they’re not. With that, while some counties that we covered this year may stay on our pre-2028 “counties to watch” list, we’ll almost certainly have some new additions in four years.
J. Miles Coleman is an elections analyst for Decision Desk HQ and a political cartographer.
See Other Political Commentary by J. Miles Coleman.
See Other Political Commentary.
Views expressed in this column are those of the author, not those of Rasmussen Reports. Comments about this content should be directed to the author or syndicate.
Related Articles

Rasmussen Reports is a media company specializing in the collection, publication and distribution of public opinion information.
We conduct public opinion polls on a variety of topics to inform our audience on events in the news and other topics of interest. To ensure editorial control and independence, we pay for the polls ourselves and generate revenue through the sale of subscriptions, sponsorships, and advertising. Nightly polling on politics, business and lifestyle topics provides the content to update the Rasmussen Reports web site many times each day. If it's in the news, it's in our polls. Additionally, the data drives a daily update newsletter and various media outlets across the country.
Some information, including the Rasmussen Reports daily Presidential Tracking Poll and commentaries are available for free to the general public. Subscriptions are available for $4.95 a month or 34.95 a year that provide subscribers with exclusive access to more than 20 stories per week on upcoming elections, consumer confidence, and issues that affect us all. For those who are really into the numbers, Platinum Members can review demographic crosstabs and a full history of our data.
To learn more about our methodology, click here.