16 For ’16
A Commentary By Larry J. Sabato, Kyle Kondik, and Geoffrey Skelley
Bite-sized observations on a wild election
Now that we’ve had a week to digest the results of the 2016 election, here are some observations about what happened and what the results might tell us about the future:
1. Electoral map tilts to the GOP
In close elections, the Electoral College will probably continue to tilt to the GOP. Twice in 16 years, we’ve had a “misfire,” where the popular vote went to one major-party candidate while the other candidate secured a majority of the electoral vote. This is because Democrats secure large, sometimes enormous, majorities in mega-states such as California, New York, and Illinois, while Republicans have just Texas, where Donald Trump’s margin of victory was nearly 450,000 votes fewer than Mitt Romney’s. (You should never join “just” with Texas, but we trust you’ll see what we mean.) Other sizable states, such as Florida, North Carolina, and Virginia, are closely divided and add only small pluralities to the candidate that wins them.
While the cumulative popular vote means nothing under the Constitution, it is not a good thing for a president to have lost it. The powers of the office are the same for every chief executive, yet it is almost impossible for a president to claim a mandate when many more people voted for the opponent. Democratic candidate Al Gore secured a national plurality of 547,000 votes in 2000; as of Wednesday afternoon, Hillary Clinton has 1.2 million more votes than Donald Trump, and that gap is very likely to grow.
Most Americans have long favored abolition of the Electoral College, designed for the 1790s rather than the 21st century. However, no one expects to see the Electoral College go the way of the horse and buggy anytime soon. It is also fair to note that if there were no Electoral College, the campaigns would have been run differently, so we can’t automatically assume that Hillary Clinton would have beaten Donald Trump under a popular vote system.
2. The map gets more competitive
Because the 2016 contest was far closer than either 2008 and 2012, the number of states decided by five points or less increased from four in 2012 (Florida, North Carolina, Ohio, and Virginia) to 11 in 2016 (shown in the map below). But the nation’s polarization is still obvious, and only six states flipped from Democratic to Republican (Florida, Iowa, Ohio, Pennsylvania, Wisconsin and probably Michigan) — and none in the opposite direction. At least we can say that the playing field was more broadly competitive, and especially so until the final GOP consolidation behind Trump in late October and early November. For a while in the fall, Arizona, Georgia, Utah, and a few other states appeared to be tightly contested, and even on Election Day Arizona and Georgia ended up being less Republican than Iowa and Ohio. We may be at a time of transition in the Electoral College where the whiter Midwest gets redder and the more diverse Sun Belt gets bluer.
Map 1: Electoral College results and margins of victory
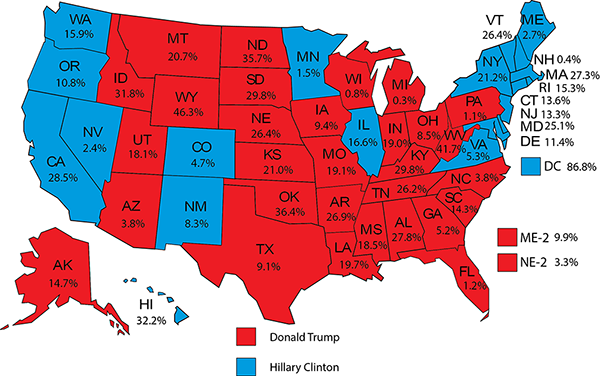
Source: Data from Dave Leip’s Atlas of U.S. Presidential Elections
3. Projections miss the mark
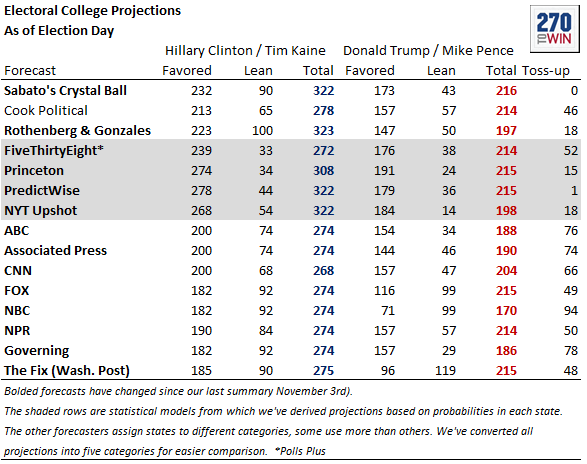
With credit to 270toWin.com, here is the final Election Day forecast for a range of sites and news organizations. No one was even close to the final Electoral College results. The Crystal Ball actually had the largest allocation of electors to Trump (216) but we were in a three-way tie for the second-most electors assigned to Clinton (322). This will be a year pundits and predictors will want to forget, yet none of us should. There are many lessons to learn, and we all need to do much, much better in the future.
Table 1: 2016 Electoral College projections as compiled by 270toWin.com
4. Many polls were off, but some provided clues in the key states days before the election
By the time all the votes are counted, the RealClearPolitics average of national polls that showed Clinton winning the national popular vote by about three points probably won’t be all that far off — Clinton may win it by a point or two or somewhere in between. But many of the state-level polls missed the mark, and missed badly, particularly in the Rust Belt. Hardly any polls showed Trump leading in several of these states the whole election, and yet Trump’s one-point wins in Pennsylvania and Wisconsin and even narrower lead in Michigan, which the Associated Press has yet to officially call, ended up being the difference in the race: had Clinton carried these three states, she would have won with 278 electoral votes (as it stands now, if Trump carries Michigan he’ll end up with 306).
But there were some signs. A Republican pollster, the Trafalgar Group, released polls of Michigan and Pennsylvania showing Trump with tiny leads. Another Republican pollster, Harper, showed the race tied in Pennsylvania. It’s hard to believe partisan polls before Election Day, but they are sometimes correct when a contest is breaking their party’s way late, as appears to have been the case in 2016.
Additionally, Ann Selzer, the respected nonpartisan Des Moines Register pollster, had Trump up seven points in Iowa in a poll released the Saturday before the election. Trump ended up winning Iowa by nine points, and it looked like a Trump state for much of the fall, but Selzer’s poll could or should have been a warning about other Midwest states. If Iowa were truly going for Trump by that large margin, it probably meant that states like Michigan and Wisconsin — states filled with many of the same working-class white voters who would power Trump to victories across the Heartland — were going to be very close, which they were.
5. Michigan: Poor urban turnout tells the tale
Despite doing significantly worse outside of Wayne County (Detroit) than Barack Obama, if Hillary Clinton had replicated the margin the county provided any of the last three Democratic presidential nominees (342,000, 441,000, and 382,000 in 2004, 2008, and 2012, respectively), she would have carried the state. As of the most recent count, Clinton is losing Michigan by about 13,000 votes, with only about a 289,000-vote margin in Wayne, about 53,000 votes worse than John Kerry’s.
6. But not necessarily in Pennsylvania
A vital part of the Democratic formula in Pennsylvania is getting a huge margin out of Philadelphia County, particularly in recent years when some typically reliable Democratic counties in Appalachian western Pennsylvania have deserted the party. Unlike in Detroit, where Clinton’s sagging margin was likely decisive, Clinton did acceptably in Philadelphia. Her margin in Philadelphia was about 457,000 votes, down from Obama’s 479,000 and 492,000 in 2008 and 2012, respectively, but a decent win, and markedly better than John Kerry’s 412,000-vote margin in 2004 (Kerry won Pennsylvania).
Clinton also outperformed Obama in Allegheny County (Pittsburgh), adding about 15,000 votes to Obama’s 2012 margin. So why did she lose the state by about 66,000 votes? Because outside of Greater Philadelphia and Pittsburgh and its closest suburbs, she lost by huge margins.
Leaving aside Allegheny and Philadelphia counties, Barack Obama lost the rest of Pennsylvania by about 273,000 votes. Clinton lost the rest of the state by…wait for it…629,000.
A great example of Clinton’s struggles outside of Pittsburgh and Philadelphia is Lackawanna County, a white, working class enclave that contains Scranton. Obama won the county by slightly more than 25 points in each of his elections, but Clinton won it by only three percentage points. Clinton also lost Erie County in the northwestern corner of the state — it swung from Obama +16 to Trump +2. There are similar eye-popping swings across the state. Brandon Finnigan of the election results-reporting site Decision Desk HQ has argued for years that Republicans had a path in Pennsylvania, and he was proven correct thanks to the giant shift that the Trump candidacy effected in the Keystone State.
7. Or Wisconsin
The Wisconsin story is similar. Clinton lost the state by about 24,000 votes, but her combined margins from the state’s two Democratic powerhouse counties — Milwaukee and Dane (Madison) counties — were almost identical to Obama’s margins in 2012. Clinton’s margin dipped a bit in Milwaukee from Obama but she did better in Dane than Obama, and she only lost about 800 net votes from Obama in those two counties combined, effectively a wash. Outside Milwaukee and Dane, Obama lost Wisconsin by 97,000 votes. Clinton lost outside of Milwaukee and Dane by 333,000 votes.
To win Pennsylvania and Wisconsin in 2020, Democrats are going to have to work to reverse some of the transformation outside of Philadelphia, Pittsburgh, Milwaukee, and Madison. Both states have what should be highly competitive Senate and gubernatorial races in 2018, and the performance of the small cities and rural counties that swung hard from Obama to Trump will be interesting: Will they stay Republican without Trump on the ballot, or will they revert to their Democratic roots?
8. Ohio: Bellwether no more?
Ohio voted for the presidential winner for the 29th time in 31 elections. That’s the best of any state in that timeframe, which the Crystal Ball’s Kyle Kondik explored in his book on Ohio, The Bellwether. Additionally, Ohio built its lead over its other competitors for the “bellwether” title in this election because the states with the records closest to Ohio’s — New Mexico, Illinois, and Nevada — all voted for the Electoral College loser (Clinton) in this election.
However, Ohio may be trending Republican and away from being the nation’s top bellwether. Trump won the state by 8.5 points at the most recent count, while Clinton was winning by at least one point nationally. Ohio will be further from the national average in this election than it has been in any election since before the New Deal. Part of being a bellwether state is not just voting for the winner, but also voting close to the national average — something that Ohio has done consistently for decades but did not do in this election.
As we observed before Nov. 8, if the changes Trump made to the electorate this year are durable, Ohio may be the new Missouri: a longstanding bellwether state that in recent years has clearly trended Republican. (Speaking of Missouri, which voted for the presidential loser only once between 1904 and 2004, the state had its biggest Republican lean relative to the national result in this election since the Civil War.)
9. Why Colorado, Nevada, and Virginia didn’t flip
While the Rust Belt largely abandoned the Democrats in 2016, albeit by very small margins in some of the aforementioned states, states with newer Democratic leans like Colorado, Nevada, and Virginia held fast for Clinton. There are two demographic factors that likely help explain why this occurred, particularly in comparison to the three Rust Belt States that crucially flipped for Trump: nonwhites, especially Latinos in Colorado and Nevada, and college-educated white voters. Helpfully for Trump, the exit polls found that white voters without a college degree made up pluralities of the electorates in Michigan and Wisconsin and were about even with white college-educated voters in Pennsylvania. Although Colorado had a smaller nonwhite share than Michigan, its electorate had a large plurality of white college-educated voters. Virginia also had a plurality of whites with college degrees and a sizable nonwhite share of the electorate. And Nevada had a plurality nonwhite electorate, the largest nonwhite share of the states in question, helping Clinton overcome the slightly larger share of voters who were white without a college degree in the Silver State.
As of the most recent count, Clinton won Colorado by a little under five points, Virginia by a little over five, and Nevada by about 2.5 points.
Table 2: Exit poll data for shares of electorates in Rust Belt trio and Sun Belt trio
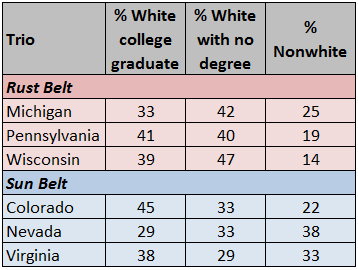
Source: CNN
10. The increasing urban-rural divide
The political split between more urban and more rural areas only grew in 2016. In 2012 Mitt Romney carried just four of today’s 50 most populous counties. Donald Trump carried the same number of localities, but with four changes. Romney carried Salt Lake County, UT — not shocking given his Mormon faith — and Orange County, CA. Trump lost both places — notably, Orange County had not voted for a Democrat for president since Franklin Roosevelt in 1936. But unlike Romney, Trump carried battleground Pinellas County, FL along the important I-4 corridor in the Sunshine State, as well as Suffolk County, NY, at the eastern edge of Long Island.
Table 3: 2016 and 2012 presidential vote in the 50 most populous counties as of July 1, 2015
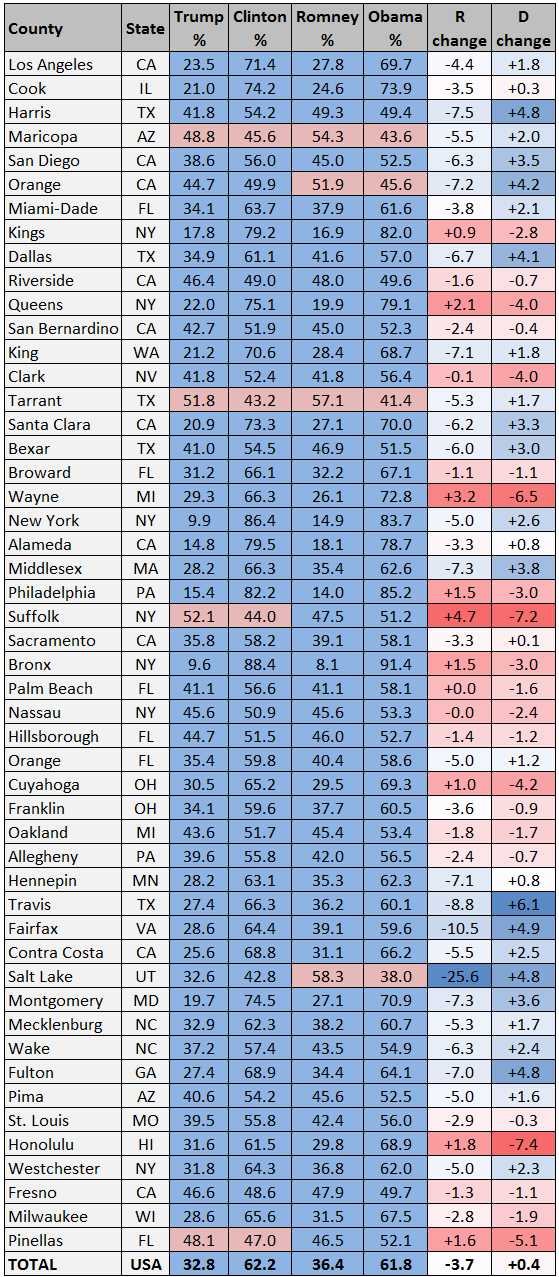
Note: 2016 election data as of Nov. 16, 2016
Source: Dave Leip’s Atlas of U.S. Presidential Elections, Associated Press (IL, MA, ME, MS)
Among the largest localities in the country, Trump did worse overall than Romney while making up ground in places with smaller populations. Clinton performed about 0.5 points better (California still has many votes left to be counted) in the 50 counties in Table 3 than Obama did in 2012, but Trump performed about four points worse that Romney in the same group. However, in counties around the country with populations below 200,000 people, Trump improved about 4.5 points on Romney’s 2012 performance while Clinton did 7.5 points worse than Obama.
11. Appalachia continues to trend away from the Democrats
Democrats have been losing ground in Appalachia, a working-class and overwhelmingly white region that stretches from western New York to northern Alabama and Mississippi, for years. The most obvious early sign was George W. Bush’s victory in West Virginia in 2000. In 1988, West Virginia was just one of a handful of states to vote for Democrat Michael Dukakis, but by Bush’s first election it had become more Republican than the nation, and its GOP lean has only grown. Trump’s pro-coal, anti-internationalist, “America First” campaign seemed optimally suited for Appalachia, and the results bore that out: Trump won West Virginia, the only state which is fully contained in Appalachia, by nearly 42 points (his second-best state margin, behind only GOP stalwart Wyoming).
Clinton won only 6% of all the Appalachian counties, down from the paltry 8% that Obama won in 2012. As is clear from Table 4, Democrats used to do quite well in the region, but now their support in the area is largely confined to places like Allegheny County (Pittsburgh), some majority-minority counties in Alabama and Mississippi, and liberal college enclaves like Athens County, OH (home to Ohio University) and Tompkins County, NY (home to Cornell University and Ithaca College).
Table 4: Selected Democratic presidential performance in Appalachia 1976-2016
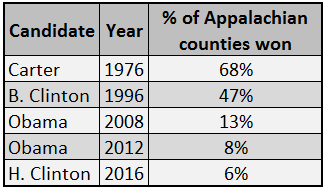
Note: Counties included are the 428 counties and independent cities classified as part of Appalachia by the Appalachian Regional Commission. Appalachia, as defined by the commission, covers all of West Virginia and parts of Alabama, Georgia, Kentucky, Maryland, Mississippi, New York, North Carolina, Ohio, Pennsylvania, South Carolina, Tennessee, and Virginia.
Meanwhile, some of the swings in these counties were stunning. In Ohio, Obama lost Pike County, a small, historically Democratic county that in recent years has voted Republican by small margins for president, by a single vote. Clinton lost it by 36 points. Monroe County, another tiny Ohio county that has been so Democratic for so long that the Whigs (the precursor to the Republicans) called it “Dark Monroe” because they had such trouble winning it, was one of only two counties to vote for beleaguered Democratic gubernatorial nominee Ed FitzGerald in 2014 (although it did vote for Romney). Clinton lost it by 46.5 points.
Clinton’s collapse in the region not only helps explain her very poor showing in Ohio, but also her surprising loss in Pennsylvania. Here’s another way of looking at the Keystone State: 52 of the state’s 67 counties are classified as Appalachian, and these counties cast 44% of the state’s total votes in both 2012 and 2016. Obama lost the Appalachian counties by about 175,000 votes. Clinton lost them by about 492,000.
Overall, Trump won Appalachia by an astounding 63%-33%, improving on Romney’s 60%-39% edge in 2012.
12. Democrats more dependent on nonwhite voters
Considering Clinton’s struggles among white working-class voters, seen most clearly in the results in many parts of the Rust Belt, it should be no surprise that the election results suggest that Clinton’s coalition showed greater reliance on nonwhite voters than even Obama’s did. Just consider a simple correlation between Democratic percentage and the nonwhite citizen-voting-age population of U.S. counties. In 2012, that correlation was .48, which is moderate but not remarkably strong. Fast forward to 2016 and the correlation grew to a stronger .61. These data indicate that larger nonwhite populations corresponded to better Democratic performance in 2016 than in 2012. Below is a scatterplot of the 2016 data.
Chart 1: Scatterplot of county nonwhite CVAP share compared to 2016 Democratic vote percentage
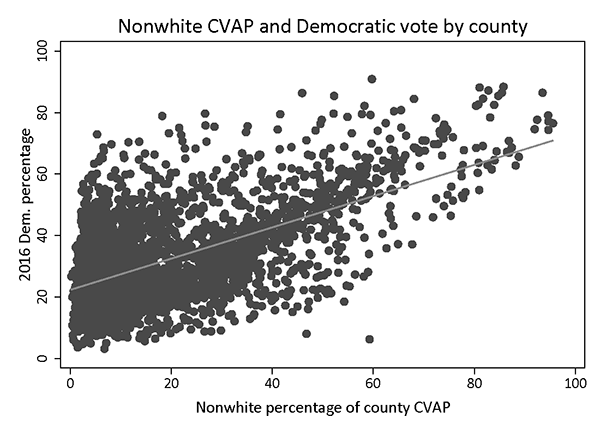
While the exit poll suggested that Trump did better among black and Latino voters than Romney, other data have called those findings into question, including this stronger correlation. Furthermore, the reverse is also true for non-Hispanic white areas, with a slightly stronger correlation between the share of non-Hispanic white population and support for Trump compared to Romney (.54 in 2016 versus .46 in 2012). Additionally, counties with large Latino populations saw Republican vote support drop two-to-three points while Democratic vote performance stayed closer to 2012 or even improved by a point or so. (We will return in a future Crystal Ball to the dimensions of Latino backing for Trump. It is very probable that the exit poll overestimated Trump’s strength with Latinos.)
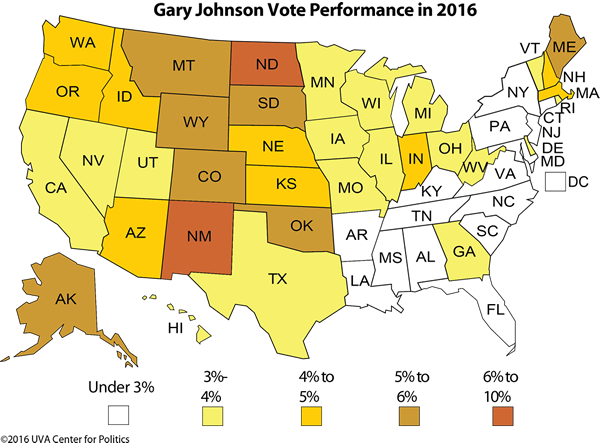
13. The third party fizzle
Ultimately, what happened to Gary Johnson of the Libertarian Party and Jill Stein of the Green Party is what happens to most third-party candidates: They fade at the end. Johnson flirted with 10% national support for much of the race but ended up with just 3.3% of the national vote, while Stein got 1% despite reaching nearly 5% in the RealClearPolitics average in early summer.
Map 2 shows Johnson’s level of support by state. As is common for Libertarians, he did better west of the Mississippi than east of it, and his best state, unsurprisingly, was his own state of New Mexico, where he got 9%.
Map 2: Gary Johnson’s level of support by state
Stein’s best states weren’t surprising either. She did best in the liberal states of Hawaii (where she got nearly 3%) as well as Oregon and Vermont. Stein’s total votes in Michigan and Wisconsin were greater than the margin Clinton lost each state, so had the Stein backers in those states voted as a bloc for Clinton instead, she would have carried each state (although Clinton still would have lost the Electoral College).
Map 3: Jill Stein’s level of support by state
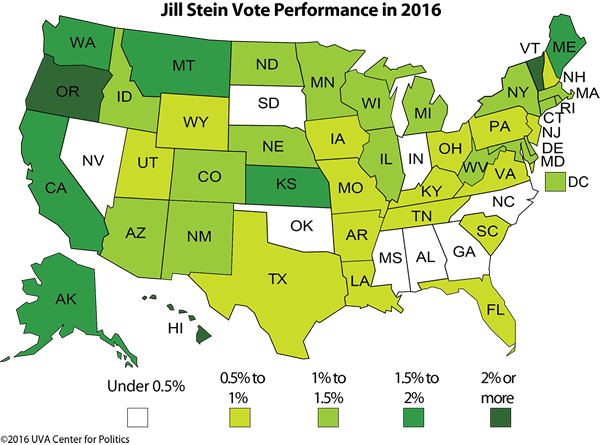
Note: Stein was not listed on the ballot in Georgia, Indiana, Nevada, North Carolina, Oklahoma, and South Dakota.
14. Straight tickets for Senate
The 2016 election saw the largest wave of straight-ticket results for president and Senate since the ratification of the 17th Amendment established popular election of senators across the country in 1913. All 33 states with Senate elections decided on Nov. 8 backed the same party for president and Senate. Although Louisiana’s final outcome won’t be determined until it completes a Dec. 10 runoff election, Republicans are heavily favored to retain it; should state Treasurer John Kennedy (R) win, that would mean 34 of 34 states voted for the same party in presidential and Senate races.
The 100% straight-ticket mark for 2016 is the highest ever, narrowly outdoing 1920’s 97% mark, and it comes on the heels of three presidential cycles (2004-2012) where the straight-ticket percentage had been about 80%. The closest any state came to having a split-ticket result was in New Hampshire, where Sen. Kelly Ayotte (R) lost by about 1,000 votes (less than 0.2 percentage points) to Sen.-elect Maggie Hassan (D), the state’s outgoing governor.
Chart 2: Percentage of straight-ticket vs. split-ticket presidential-Senate outcomes, 1916-2016
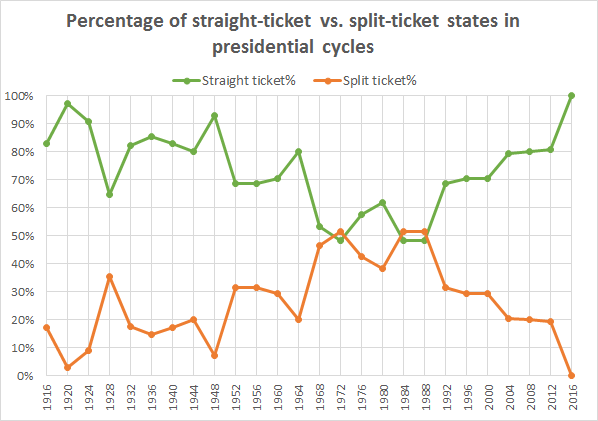
Note: Includes all states where both the presidential and Senate races were won by major-party candidates
15. Do the Republicans have new targets in the House?
Before the election, we speculated about the possibility of some white, working-class House districts with Democratic incumbents potentially producing a massive House upset because of their swings to Trump. While there were no upsets, there were a few close calls. Reps. Tim Walz (D, MN-1) and Collin Peterson (D, MN-7) had closer-than-expected races as their districts swung hard to Trump, as did Rep. Matt Cartwright (D, PA-17). As the National Republican Congressional Committee plots its targets for 2018, some of these districts might get special attention. On the flip side, Democrats will be looking to 2018 as an opportunity to make gains in the House, and at this early date, as unlikely as it may seem today, we would not rule out the possibility of Democrats grabbing the roughly 25 net seats they would need to take control. Simply put, midterm elections are often a backlash vote against the president’s party, and with Trump in the White House, history suggests the opportunity is there for the Democrats, even on a national House map that has given them headaches in recent years thanks at least in part to Republican control of redistricting in many swing states following the 2010 census.
16. Democratic losses in the Age of Obama
As we pointed out after the 2014 midterm election, the Democratic bench has taken an unprecedented hit during President Obama’s time in office. The numbers have worsened slightly following Obama’s final election as a part of the political environment. With most 2016 results in (adding projections for some uncalled races based on who is ahead at this point), the damage is as follows: a net loss of 13 governorships, nine Senate seats, 63 House seats, 949 seats in state legislatures, and 29 state legislative chambers. Some other modern presidents lost more governorships, Senate seats, and state legislative chambers, but none has lost more net House seats and — especially — state legislative seats. Having lost close to 1,000 (!) seats in legislatures around the country, the Democratic Party has a weak bench from which to groom future party stars for higher office. Table 5 lays out the comparable losses — and in some cases victories — of other modern presidents compared to the outgoing one.
Table 5: Down-ballot wins and losses for modern presidents
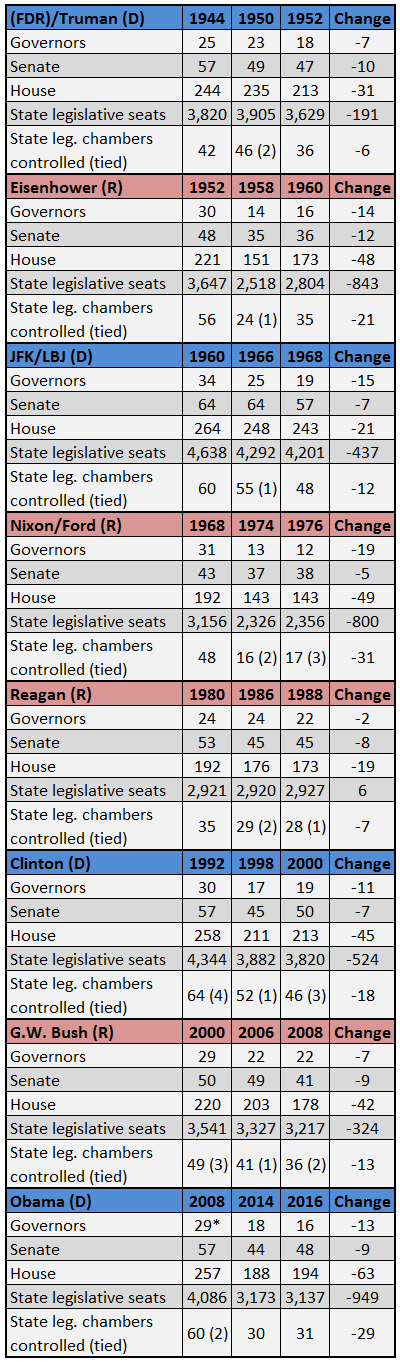
Notes: *Obama’s gubernatorial starting point includes Gov. Janet Napolitano (D-AZ), who was appointed secretary of homeland security in January 2009. Lt. Gov. Jan Brewer (R) became governor. The 2016 data includes results based on current vote counts for some contests that have not been called. Senate data do not include independents or members of third parties caucusing with president’s party. Having become states in 1959, Alaska and Hawaii’s data are not included prior to John Kennedy. Until Minnesota changed its law in 1973, Minnesota and Nebraska had technically nonpartisan legislatures (Nebraska still has one today). Therefore, Minnesota’s state legislative data are not included prior to Ronald Reagan, and Nebraska’s data are excluded throughout.
Larry J. Sabato is the director of the Center for Politics at the University of Virginia.
Kyle Kondik is a Political Analyst at the Center for Politics at the University of Virginia.
Geoffrey Skelley is the Associate Editor at the Center for Politics at the University of Virginia.
See Other Political Commentary by Larry J. Sabato.
See Other Political Commentary by Kyle Kondik.
See Other Political Commentary by Geoffrey Skelley.
See Other Political Commentary.
Related Articles


Rasmussen Reports is a media company specializing in the collection, publication and distribution of public opinion information.
We conduct public opinion polls on a variety of topics to inform our audience on events in the news and other topics of interest. To ensure editorial control and independence, we pay for the polls ourselves and generate revenue through the sale of subscriptions, sponsorships, and advertising. Nightly polling on politics, business and lifestyle topics provides the content to update the Rasmussen Reports web site many times each day. If it's in the news, it's in our polls. Additionally, the data drives a daily update newsletter and various media outlets across the country.
Some information, including the Rasmussen Reports daily Presidential Tracking Poll and commentaries are available for free to the general public. Subscriptions are available for $4.95 a month or 34.95 a year that provide subscribers with exclusive access to more than 20 stories per week on upcoming elections, consumer confidence, and issues that affect us all. For those who are really into the numbers, Platinum Members can review demographic crosstabs and a full history of our data.
To learn more about our methodology, click here.