If it's in the News, it's in our Polls. Public opinion polling since 2003.

General Politics

Most Recent Releases

May 11, 2015

Illegal or Not, Voters Are More Supportive Than Ever of NSA

Following a federal appeals court ruling that the National Security Agency’s mass collection of Americans’ phone records is illegal, voters are actually more supportive of the agency’s actions and put even more emphasis on preventing a terrorist attack over protecting privacy.

White letter R on blue background
May 8, 2015

When is More Defense Spending Enough?

Congress and the president are battling over a federal budget that spends more on the military, but voters are less gung-ho about increasing defense spending than they were three months ago. Still, support for more spending on defense remains higher than it has been in several years.   

White letter R on blue background
May 6, 2015

Americans See Bigger Domestic Terror Threat

Following the abortive terrorist attack in Texas this weekend, most Americans agree that Islamic terrorism is now a bigger threat inside the United States.

May 5, 2015

Voters Strongly Favor Body Cameras for Cops

Voters overwhelmingly favor requiring cops to wear uniform cameras, but will it make us all safer?

May 4, 2015

Voters Want Spending Cuts But Are More Doubtful They'll Happen

Most voters continue to favor across-the-board spending cuts by the federal government, but more than ever don’t expect the government to oblige.

May 4, 2015

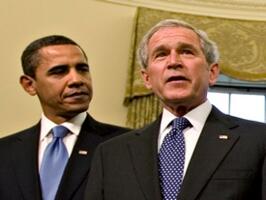
Obama, George W. Bush Are Boost in Primaries Only

Message to presidential hopefuls: Comparing yourself to President Obama or his predecessor, George W. Bush, is a much better idea during primary season than it is during the general election.

White letter R on blue background
May 1, 2015

Voters Remain Cautious About Prison Reform

Hillary Clinton this week joined the chorus of Democrats and Republicans calling for ways to reduce the number of Americans in prison, and voters still tend to be cautiously supportive of that overall goal.

May 1, 2015

National Security Concerns Are Growing

Concern about national security was mostly in the low- to mid-teens from November 2008 through 2010. This concern began trending down slightly in 2010 and dropped to the low single-digits after the killing of Osama bin Laden in May 2011. It did not reach double-digits again until mid-2013.

White letter R on blue background
April 30, 2015

Voter Suspicion Grows Over Hillary’s E-Mails

As Obama administration officials wrestle with the news media and congressional investigators over releasing Hillary Clinton’s e-mail from her days as secretary of State, voters are growing more suspicious that Clinton has something to hide.

April 30, 2015

Most See Baltimore Riots As Criminal, Not Protest

Americans view the recent rioting in Baltimore as criminal behavior, not legitimate protest, and think it will only worsen the criminal justice situation in the city.

White letter R on blue background
April 29, 2015

63% Think Hillary Clinton May Have Helped Foreign Donors As Secretary of State

Just over half of voters do not trust Hillary Clinton, but even more think she used her position as secretary of State to benefit some of those who gave money to her Clinton Foundation.

April 29, 2015

73% Think Newcomers Should Adopt America's Culture, Language

Most voters still consider America an equitable place to live and feel strongly that newcomers to this country should adopt our way of life.

White letter R on blue background
April 27, 2015

Most Favor Increased Use of Drones Against Terrorists

Despite President Obama’s acknowledgement last week that a U.S. drone attack on an al-Qaeda camp killed two hostages, including an American, voters remain strongly supportive of using the armed unmanned aircraft. Most also still believe the United States should use them even more. (To see survey question wording, click here.)

(Want a free daily e-mail update? If it's in the news, it's in our polls).  Rasmussen Reports updates are also available on Twitter or Facebook.

The survey of 1,000 Likely Voters was conducted on April 23 and 26, 2015 by Rasmussen Reports. The margin of sampling error is +/- 3 percentage points with a 95% level of confidence. Field work for all Rasmussen Reports surveys is conducted by Pulse Opinion Research, LLC. See methodology.

April 24, 2015

62% Say Government Has Too Much Power in America Today

Nearly two-out-of-three Americans believe the government has too much power in this country and that too many of their fellow countrymen are dependent on the government for financial support.

A new Rasmussen Reports national telephone survey finds that 62% of American Adults believe there is too much government power and too little individual freedom in the United States today. Just 10% think the opposite, that there is too much individual freedom and too little government power. Sixteen percent (16%) think the balance is about right, while 12% are not sure. (To see survey question wording, click here.)

(Want a free daily e-mail update? If it's in the news, it's in our polls). Rasmussen Reports updates are also available on Twitter or Facebook.

The national survey of 800 Adults was conducted on April 14-15, 2015 by Rasmussen Reports. The margin of sampling error is +/- 3.5 percentage points with a 95% level of confidence. Field work for all Rasmussen Reports surveys is conducted by Pulse Opinion Research, LLC. See methodology.

Additional information from this survey and a full demographic breakdown are available to Platinum Members only.
White letter R on blue background
April 23, 2015

Most Complain of Unresolved Problems at the VA

Most voters think there are still serious problems at the U.S. Department of Veterans Affairs and that the federal government needs to do more for those who have served in the military.

The latest Rasmussen Reports national telephone survey finds that just 12% of Likely U.S. Voters believe most of the problems with the VA have been cleaned up. Sixty-five percent (65%) think those problems still remain. Twenty-three percent (23%) are not sure. (To see survey question wording, click here.)

(Want a free daily e-mail update? If it's in the news, it's in our polls).  Rasmussen Reports updates are also available on Twitter or Facebook.

The national survey of 1,000 Likely Voters was conducted on April 21-22, 2015 by Rasmussen Reports. The margin of sampling error is +/- 3 percentage points with a 95% level of confidence. Field work for all Rasmussen Reports surveys is conducted by Pulse Opinion Research, LLC. See methodology.

Additional information from this survey and a full demographic breakdown are available to Platinum Members only.
April 23, 2015

Voters Vote No on Online Voting

Americans rely on the Internet for more and more things in their daily lives, but most want to keep voting offline. (To see survey question wording, click here.)

(Want a free daily e-mail update? If it's in the news, it's in our polls).   Rasmussen Reports updates are also available on Twitter or Facebook.

The survey of 1,000 Likely Voters was conducted on April 19-20, 2015 by Rasmussen Reports. The margin of sampling error is +/- 3.5 percentage points with a 95% level of confidence. Field work for all Rasmussen Reports surveys is conducted by Pulse Opinion Research, LLC. See methodology.

April 16, 2015

Voters Rate Obama, GOP Congress As Harmful to Presidential Nominees

A lot can happen in the nearly 19 months between now and Election Day, but right now voters agree President Obama and the Republican-led Congress are problems for the presidential candidates of their respective political parties.

A new Rasmussen Reports national telephone survey finds that just 23% of Likely U.S. Voters think the president’s record in office will help the next Democratic presidential candidate. A plurality (47%) believes Obama’s record in the White House since 2009 will hurt his party’s nominee instead, while 22% say it will have no impact. (To see survey question wording, click here.)

(Want a free daily e-mail update? If it's in the news, it's in our polls). Rasmussen Reports updates are also available on Twitter or Facebook.

The survey of 1,000 Likely Voters was conducted on April 5-6, 2015 by Rasmussen Reports. The margin of sampling error is +/- 3 percentage points with a 95% level of confidence. Field work for all Rasmussen Reports surveys is conducted by Pulse Opinion Research, LLC. See methodology.

Additional information from this survey and a full demographic breakdown are available to Platinum Members only.

April 10, 2015

Most Voters Expect Both Parties to Pick Presidential Candidates They Don’t Agree With

Looking ahead to next year’s presidential contest, most voters expect more of the same: two candidates with whom they have very little in common.

This marks little or no change from how voters looked at the major party presidential candidates in past elections. (To see survey question wording, click here.)

[Have we heard from you yet? The 2015 Rasmussen Reports reader survey is the most important poll we’ll take all year. Take the survey now--there are only a few days left!]

(Want a free daily e-mail update? If it's in the news, it's in our polls). Rasmussen Reports updates are also available on Twitter or Facebook.

The survey of 1,000 Likely Voters was conducted on April 5-6, 2015 by Rasmussen Reports. The margin of sampling error is +/- 3 percentage points with a 95% level of confidence. Field work for all Rasmussen Reports surveys is conducted by Pulse Opinion Research, LLC. See methodology.

April 1, 2015

Do You Want A Religious Freedom Law In Your State?

Most voters still oppose a religious freedom law in their state like the one adopted in Indiana. Yet despite concerns that such laws may lead to discrimination against gays and lesbians, voters also continue to strongly defend the right of a Christian photographer to turn down a same-sex wedding. Many also believe the media portray religious freedom laws unfairly.

Arkansas this week came a step closer to joining the 20 states that have laws prohibiting the government from forcing businesses to provide services they find objectionable on religious grounds, but 53% of Likely U.S. Voters oppose such a law in their state. The latest Rasmussen Reports national telephone survey finds that 35% favor a law that would allow businesses to refuse service to customers for religious reasons. Twelve percent (12%) are undecided. (To see survey question wording, click here.)

(Want a free daily e-mail update? If it's in the news, it's in our polls). Rasmussen Reports updates are also available on Twitter or Facebook.

The national telephone survey of 1,000 Likely Voters was conducted by Rasmussen Reports on March 30-31, 2015. The margin of sampling error for the survey is +/- 3 percentage points with a 95% level of confidence. Fieldwork for all Rasmussen Reports surveys is conducted by Pulse Opinion Research, LLC. See methodology.

Additional information from this survey and a full demographic breakdown are available to Platinum Members only.

March 31, 2015

Voters Say Big Government Is Back

Bill Clinton made news when he declared nearly 20 years ago that the era of big government is over. Voters still prefer smaller, cheaper government but clearly recognize that Barack Obama, the next Democrat after Clinton to be in the White House, has reversed that trend.

A new Rasmussen Reports national telephone survey finds that just 12% of Likely U.S. Voters now agree that “the era of big government is over.” That’s down from 18% last October and ties the lowest finding last measured in February of last year. Most voters (55%) disagree with that assessment, but a sizable 32% are not sure. (To see survey question wording, click here.)

(Want a free daily e-mail update? If it's in the news, it's in our polls). Rasmussen Reports updates are also available on Twitter or Facebook. 

The survey of 1,000 Likely Voters nationwide was conducted on March 22-23, 2015 by Rasmussen Reports. The margin of sampling error is +/- 3 percentage points with a 95% level of confidence. Field work for all Rasmussen Reports surveys is conducted by Pulse Opinion Research, LLC. See methodology.

Additional information from this survey and a full demographic breakdown are available to Platinum Members only.