Why Pollsters Disagree
A Commentary by Fran Coombs
The ultimate outsider is challenging the ultimate insider, and it’s driving the pollsters crazy.
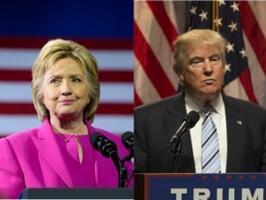
Democrat Hillary Clinton – first lady of both the state of Arkansas and the United States, U.S. senator from New York, secretary of State and a regular in the global halls of power for more than 20 years. She knows what to say and how to say it. While many question what she has accomplished in any of those positions, there’s no doubt that she’s been there and done things. She represents the status quo, and for many Americans, there is comfort in that.
Republican Donald Trump – brash, brusque billionaire businessman from New York City, used to having his way and paying for it. He says what’s on his mind, often to the despair of his political advisors but to the delight of a usually hostile media. Trump thinks America’s going to hell and is ready to upset the applecart to turn things around. His outbursts – indeed, his entire candidacy – defy conventional political wisdom and have put him at odds with the leadership of his own party who question what he really has in mind. But he has millions of loyal followers across party lines that he has dubbed “a movement.”
Throw in allegations that Clinton is a liar and has mishandled classified information and charges that Trump, too, is a liar and a sexual harasser, and you have the most volatile presidential election in decades.
The polling industry is already struggling with the death of the landline telephone and trying to find new ways to compensate for that loss to achieve demographically balanced voter samples. Along comes the craziest election most of us have ever seen.
Consider that just a month ago, many pollsters were saying the election was already over and that Clinton had won. The three daily tracking polls – the Los Angeles Times, IBD/TIPP and Rasmussen Reports – consistently have shown a much tighter race. We’re the ones who add new voters to the existing mix every day and don’t just swoop in for a two- or three-day sample. But many in the media – perhaps most prominently the New York Times – began preparing for a second Clinton administration as if the voters had already spoken.
Yet despite the release of a damning 11-year-old video showing Trump making uncomfortably graphic comments about women, the race began tightening again, even among the pollsters who had previously declared it over. Then in mid-October, the FBI announced it was reopening the investigation of Clinton’s handling of classified information while secretary of State, and the race really began to close. One major pollster went from showing Clinton with a 12-point lead to a two-point race in just over a week. [The FBI on Sunday closed that case again, choosing to bring no charges against Clinton.]
At the same time, polling in the so-called battleground states was and continues to be all over the place. It’s not uncommon to see Clinton up by seven in a state in one poll, while another pollster shows Trump up by four in the same state. The Real Clear Politics averages meld all this together, but unlike in so many other years, there hasn’t been any consistent pattern among pollsters in most states for weeks.
What makes pollsters come up with different results? We can’t explain the formulas they use, but at Rasmussen Reports our demographics are based on historical trends in previous presidential elections, analysis of the new data we collect (we hear from 10,000 new likely U.S. voters every month) and our own political intuition.
With these factors, Rasmussen Reports’ final White House Watch daily tracking poll released yesterday showed Clinton with a 45% to 43% lead, with a +/- 2.5% margin of error.
Just a slight difference in any of these factors, though, explains the differences in polls. Using the same numbers, for example, if we create a model that shows slightly more GOP turnout among men and older voters, with two percent more whites voting Republican, it’s Trump 45%, Clinton 44%.
Those same numbers crunched through a model that shows a few more younger voters and more women turning out for the Democrats despite slightly less white turnout for Clinton still pushes her to a four-point lead.
Same numbers, slightly different formula, different results. It also highlights why turnout of their key demographic groups is so important to both major parties.
Then there’s the potential silent factor: Are voters even telling pollsters the truth? Seventeen percent (17%) of Likely Republican Voters are less likely this year to let others know how they intend to vote compared to previous presidential campaigns. Ten percent (10%) of Likely Democratic Voters say they are less likely to tell.
Make America Great Again vs. stay the course that President Obama has set. Today’s the showdown.
Fran Coombs is the managing editor of Rasmussen Reports.
See Other Political Commentaries.
See Other Commentaries by Fran Coombs.
Views expressed in this column are those of the author, not those of Rasmussen Reports. Comments about this content should be directed to the author at fran.coombs@rasmussenreports.com.
Related Articles


Rasmussen Reports is a media company specializing in the collection, publication and distribution of public opinion information.
We conduct public opinion polls on a variety of topics to inform our audience on events in the news and other topics of interest. To ensure editorial control and independence, we pay for the polls ourselves and generate revenue through the sale of subscriptions, sponsorships, and advertising. Nightly polling on politics, business and lifestyle topics provides the content to update the Rasmussen Reports web site many times each day. If it's in the news, it's in our polls. Additionally, the data drives a daily update newsletter and various media outlets across the country.
Some information, including the Rasmussen Reports daily Presidential Tracking Poll and commentaries are available for free to the general public. Subscriptions are available for $4.95 a month or 34.95 a year that provide subscribers with exclusive access to more than 20 stories per week on upcoming elections, consumer confidence, and issues that affect us all. For those who are really into the numbers, Platinum Members can review demographic crosstabs and a full history of our data.
To learn more about our methodology, click here.