Tight National Race Freezes Electoral College Map
A Commentary By Kyle Kondik and Larry J. Sabato
While no one enjoys dissecting the presidential swing states more than we do, we also recognize that swings in the states are oftentimes uniform -- as in, changes in the national polls will trickle down to the states.
And there just hasn't been much movement in the national polls in months: for instance, on April 14 -- right around when Rick Santorum's exit from the GOP presidential race effectively gave Mitt Romney the nomination -- President Obama was up 2.4 percentage points on Romney in RealClearPolitics' national poll average. Now he's up two points -- so the race was basically a tie in April, and it's basically a tie now. Like Bill Clinton and George W. Bush, Obama is a polarizing president -- perhaps because we have a polarized nation -- and his half-a-nation ying has almost automatically created Romney's half-a-nation yang.
Neither millions of dollars in television advertising nor three weak monthly job reports in a row (with perhaps another one to come Friday morning) have moved the needle very much, and the supposed gaffes that dominate the daily news cycle have even less effect. The vast majority of presidential voters cannot be pushed or pulled by the little ups and downs of the news cycle.
Because there has been so little movement in the national polls since Mitt Romney effectively clinched the presidential nomination, we also haven't seen much reason to make any major changes to our Electoral College map since then.
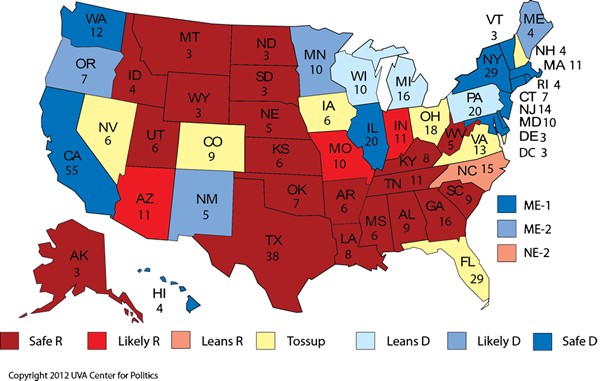
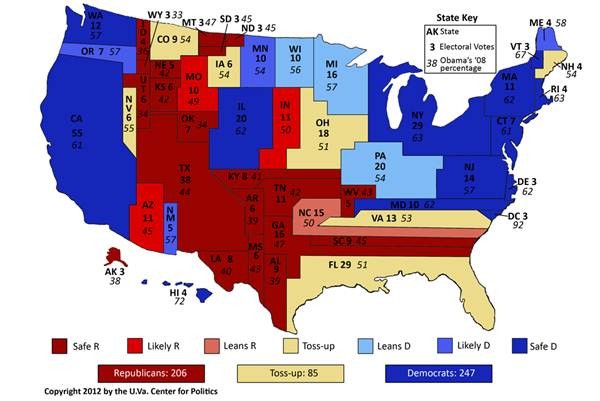
Our only changes in this update do not alter our longstanding Electoral College projection: 247 for President Obama, 206 for Romney with 85 toss-ups. Rather, they simply solidify some states for either side.
Tweaking the map
We have believed for almost a year that North Carolina, a narrow Obama state in 2008 that is demographically favorable to the president, is a leans Republican state. But it is certainly more competitive than two other narrow 2008 states: Missouri (which John McCain won by 0.13 percentage points) and Indiana (which Obama won by a point). The Obama campaign is unlikely to contest either, so we're now putting both in the "likely Republican" column, an upgrade from the leans column. That makes North Carolina our sole leaning-Republican state.
Likewise, while New Mexico narrowly went for George W. Bush in 2004, its status as one of the most Hispanic states in the country -- more than two of every five voters were Hispanic in 2008, a proportion that was far higher than any other state in the country -- makes it a relatively strong bet to go to Obama, and it appears that the Romney campaign will do little to contest it.
Chart 1: Crystal Ball Electoral College rating changes
These tweaks leave only four "leaning" states -- Michigan, Pennsylvania and Wisconsin to Obama, and North Carolina to Romney -- along with the seven toss-ups noted in yellow on the maps below. Barring some major shifts in the polls, that means that 39 of the 50 states are basically not competitive in the general election.
Map 1: Revised 2012 Crystal Ball Electoral College ratings
Map 2: Revised 2012 Crystal Ball Electoral College ratings, Political Map of the United States
Notes: The Political Map of the United States sizes the states based on their population. Click on maps for larger images.
Remember the Maine (Second, and Nebraska Second)
Regular readers might notice a change to our Electoral College map, as we've included three new boxes to denote the two states where electoral votes must be monitored by congressional district: Nebraska and Maine. Nebraska is a solidly Republican state, but President Obama narrowly won Nebraska's Omaha-centered Second Congressional District in 2008 (the state's other four electoral votes went to John McCain).
Obama won the district just 50% to 49%, and there are indications he will try for it again. Both campaigns can advertise on Omaha television and also reach the western part of toss-up Iowa, providing more bang for the campaign buck. The Omaha Second became slightly more Republican in redistricting, although Obama still would have won it under the new lines.
Meanwhile, Romney could conceivably target Maine's northern Second Congressional District -- Obama won it with 55% of the vote in 2008, and it didn't significantly change after redistricting (he won 61% of the state's other congressional district, the First). If Obama really falls apart, perhaps Romney could win the state -- which is why we rate the state as a whole as likely Democratic -- but even then, Romney might only get three of the state's four electoral votes, because the First would probably remain in Obama's camp. In any event, the likeliest outcome is that Obama gets all four of the state's electoral votes.
So, as is now reflected on our map, Nebraska's Second District leans to Romney, while Maine's Second District is likely Democratic and its First District is safe Democratic.
Tilting the toss-ups
Of the seven toss-up states, two seem to be the closest to tilting one way or the other.
Mitt Romney cannot win this election without winning Florida (29 electoral votes). Of the nation's six largest states, three are automatically going to Obama -- California (55), New York (29) and Illinois (20) -- while one is assuredly going to Romney -- Texas (38). The two others are Pennsylvania (20), which is competitive but leans to Obama, and Florida. In a world in which Florida is going to Obama, Pennsylvania is staying in the Obama camp too, unless there is a total realignment of the electorate. That would give Obama five of the nation's six most-populated states, and an almost-certain second term.
Given how close the race is nationally, it's hard right now to see Obama actually winning Florida, which appears to have a slight Republican lean in presidential elections. Of all the states Obama won in 2008, he only did worse in North Carolina and Indiana than he did in the Sunshine State.
Historically, the Democratic nominee for president has done worse in Florida than he did nationally in 11 of the 13 elections held since 1960: The exceptions were 2000, when Al Gore did .46 percentage points better in Florida than he did nationally, but he needed to do .48 percentage points better to win the state; and 1976, when Jimmy Carter of neighboring Georgia swept the entire South except for Virginia.
On the Obama side of the ledger, his best toss-up state is Nevada, with six electoral votes. Despite its unemployment rate -- highest in the nation at 11.7% -- Obama has maintained a decent polling lead in the Silver State. As Senate Majority Leader Harry Reid's (D) reelection upset showed in 2010, Democrats have strong organizational advantages there as well, and they are rebuilding their edge in voter registration.
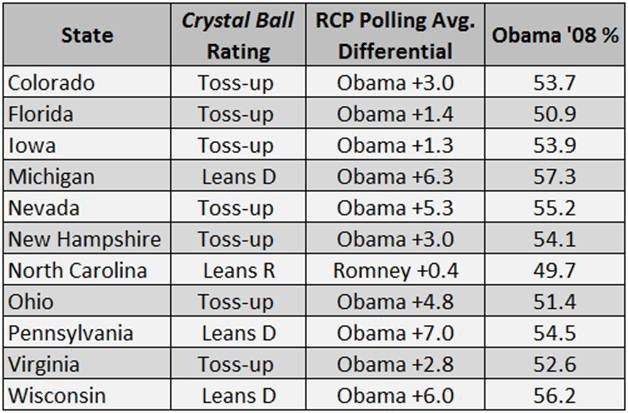
Our suspicion that Florida might tilt toward Romney, and that Nevada might tilt toward Obama, is backed up by state-level polling data; of the toss-ups, Obama's lead is biggest in Nevada and second smallest in Florida (behind Iowa). (Note, though, Obama's relatively solid lead in Ohio, which is slightly bigger than his 2008 victory margin; history tells us that will change if the national race remains close.)
Chart 2: RealClearPolitics' state-level polling average of presidential battleground states
Source: RealClearPolitics for state-level polling data from mid-day Wednesday, Aug. 1; Dave Leip's Atlas of U.S. Presidential Elections for 2008 results
Since we rolled out our first iteration of this Electoral College map in April 2011, we've moved only two states out of the toss-up column -- in September 2011, we shifted Indiana and North Carolina into the Republican camp. Otherwise, the map -- just like the race -- has been relatively static. The dominoes will start to fall as the campaign enters its last 100 days, but if there's a nudge that will push them one way or the other, it has not happened yet.
Larry J. Sabato is the director of the Center for Politics at the University of Virginia.
See Other Commentary by Larry Sabato
Kyle Kondik is the House Editor at the Center for Politics at the University of Virginia.
See Other Political Commentary by Kyle Kondik
See Other Political Commentary
Views expressed in this column are those of the author, not those of Rasmussen Reports. Comments about this content should be directed to the author.
Rasmussen Reports is a media company specializing in the collection, publication and distribution of public opinion information.
We conduct public opinion polls on a variety of topics to inform our audience on events in the news and other topics of interest. To ensure editorial control and independence, we pay for the polls ourselves and generate revenue through the sale of subscriptions, sponsorships, and advertising. Nightly polling on politics, business and lifestyle topics provides the content to update the Rasmussen Reports web site many times each day. If it's in the news, it's in our polls. Additionally, the data drives a daily update newsletter and various media outlets across the country.
Some information, including the Rasmussen Reports daily Presidential Tracking Poll and commentaries are available for free to the general public. Subscriptions are available for $4.95 a month or 34.95 a year that provide subscribers with exclusive access to more than 20 stories per week on upcoming elections, consumer confidence, and issues that affect us all. For those who are really into the numbers, Platinum Members can review demographic crosstabs and a full history of our data.
To learn more about our methodology, click here.


