Plan of Attack: Obama, Romney & The Electoral College
A Commentary By Kyle Kondik, Larry J. Sabato and Geoffrey Skelley
The presidential election could very well come down to one state -- which one? We offer our thoughts on the Electoral College, plus answer questions on House, Senate and gubernatorial races, in our latest Crystal Ball video.
The London Olympics isn't the only venue for world-class sport this year. Political gold is waiting to be won in November, and the only way to grab the top U.S.A. medal is to master Electoral College math. It is both deceptively easy and maddeningly complex. A candidate has to accumulate 270 votes in a tiny universe of 538, but those 538 will be generated by 130 million votes cast in 51 separate entities. A game that looks like checkers is really multi-dimensional chess.
Still, the deep polarization of party politics has simplified the process somewhat. Remarkably, about 40 states -- and maybe more -- have almost no chance of flipping from one party to the other in the 2012 Electoral College. If President Obama gets his way, the electoral map will look very close to the way it did four years ago; on the other hand, Mitt Romney needs to flip a relative handful of states to take up residence at 1600 Pennsylvania Ave.
Obama's 2008 performance was close to the high-water mark for a modern Democrat: 365 electoral votes (359 under the new 2010 census apportionment). Obama did the seemingly impossible by very narrowly pulling two long-time Republican states, Indiana and North Carolina, to his column and even winning an electoral vote in Nebraska's Second Congressional District, while narrowly losing Missouri and Montana. Those latter two states are widely believed to have moved out of his reach for 2012.
It is a little-known Electoral College tidbit that a president reelected to a second term has always added a state to his coalition that he did not win during his first successful run. Sometimes, in the early days of the Republic, it was a state that didn't exist during a president's first bid. But it appears that Obama, if reelected, will break this trend. The only state John McCain won that Obama appears to have a chance of flipping is Arizona, but that is a long shot that would require a massive turnout effort by the Obama campaign among Hispanic voters.
To compare 2012 politics to war for a moment, the current electoral map is akin to World War I's Western Front trench warfare: Massive amounts of manpower and resources will be needed to move the frontlines even a smidgen. And the less the lines move, the better it is for Obama.
At the starting block
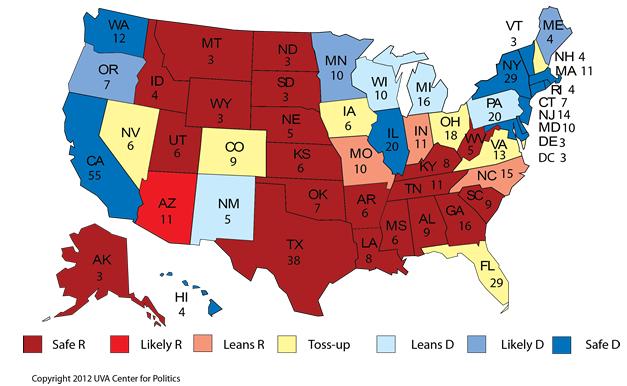
Based on our analysis, Obama starts with a presumed base of 247 electoral votes, just 23 short of the magic number of 270 -- but not all of them are truly secure. Romney starts with a much firmer but not ironclad 206. The election will be decided mainly in seven states with 85 toss-up votes.
To show how little the presidential campaign turf has changed since 2008, all seven of the toss-ups are states that Obama won in 2008. Obama captured 28 states then (plus the District of Columbia), and in only eight of those did he win by less than 10 percentage points. Given Obama's middling approval ratings this year and the uncertainty in the economy, the two states where his 2008 triumphs were closest -- Indiana and North Carolina -- are now favored to go to Romney, and the other six states where Obama won by less than 10 points are toss-ups. Obama won the seventh toss-up, Nevada, by about 12.5 percentage points.
Map 1: Updated Crystal Ball Electoral College ratings
How the states fall
The states are generally stable enough in their political leanings that we can roughly rank them in order of how Democratic or Republican they are. Keeping this in mind will provide clues as to who the winner might be as the election gets closer. For instance, if Mitt Romney is spending a lot of time and money in Minnesota in the last few months of the election, then either he's probably going to win, or he is looking for a post-election lake house. That's because, perhaps surprisingly, Midwestern Minnesota has the longest streak of voting for a Democratic presidential candidate, dating back to 1976. Minnesota and Illinois should be slam dunks for President Obama in the Midwest. If Minnesota is competitive, then Wisconsin, Michigan, and Pennsylvania, all heartland states that have gone Democratic in the past five presidential elections, are surely competitive too. That would be bad news for Obama.
Chart 1 shows the percentage of the two-party vote the Democratic presidential candidate won in all 50 states (and DC) over the past five elections. We have subtracted out all third-party votes, which can have a distorting effect. Generally speaking, the states that have been the closest over the past five elections are the ones that will be competitive this time, although there are a few states that backed Bill Clinton -- most notably his home state of Arkansas as well as West Virginia -- that do not like Barack Obama at all. The Democratic candidate for president has done, on average, better in those states over the past five elections than in Virginia. However, Virginia is very competitive in this election, whereas Razorback and Mountaineer land is clearly Romney country. (A related trivia question: which four states supported Democrats Jimmy Carter in 1980 and Michael Dukakis in 1988? The answer is at the bottom of this article.)
Chart 1: Percentage of the two-party vote won by Democratic candidates in presidential elections by state, 1992-2008
Source: Calculated from Dave Leip's Atlas of U.S. Presidential Elections, http://uselectionatlas.org/RESULTS/
These numbers will give us a sense of how Obama is faring come fall. If Obama is polling poorly in, say, Pennsylvania or Wisconsin before the election, than he probably isn't going to win Ohio, given that over the past five elections the Badger and Keystone states have been consistently a few points more Democratic than Ohio. Likewise, if Pennsylvania is coming in big for Obama on Election Night, then Ohio might lean toward Team Blue. Of course, these trends are not ironclad -- Ohio has gone Democratic when Pennsylvania has gone Republican before, such as in 1916 and 1948 -- but the more recent trend is for Ohio to be one of the least Democratic states in the Midwest. Only Indiana and Missouri in the Midwest performed worse for Democrats during the past five presidential elections.
In the South, Obama will be heavily targeting both Virginia and North Carolina. But as the chart shows, even though Virginia and North Carolina have supported the same candidates in each of the past five elections -- Republicans from 1992 to 2004, and Democrat Obama in 2008 -- the numbers tell us that Virginia has been friendlier to Democratic candidates than North Carolina in that time frame. It's one of the reasons why we call the Old Dominion a toss-up, while we have the Tar Heel State leaning Republican.
In the West, Obama will try to keep three crucial states in his column: Colorado, Nevada and New Mexico. We have New Mexico in the "leans Democratic" column, and Colorado and Nevada as toss-ups, in part because New Mexico has been a few points more Democratic than other Western states, and Al Gore (barely) carried it in 2000, while George W. Bush carried Nevada and Colorado twice (and New Mexico in 2004). Another factor: in 2008, New Mexico's electorate was 41% Hispanic; Nevada (15%) and Colorado (13%) had much lower Hispanic participation, so given that Hispanics supported Obama by about a two-to-one margin in 2008, Obama has a bigger base of support in the Land of Enchantment.
Now, if New Mexico is heavily in play in late fall -- as it was in both of Bush's contests -- Romney is probably winning Colorado and Nevada, if history is a guide. Similarly, if Arizona truly is competitive as the election is winding up -- some recent polling shows Obama might have an opening there -- one would expect Obama to be doing well in the other competitive Western states. Remember, though, that Arizona is historically very Red territory: since 1952, Arizona went Democratic only once, a close win for Bill Clinton in 1996, aided by a three-way race that included Ross Perot. Were it not for that surprise, Arizona would have the longest ongoing streak of voting Republican in the country. As it stands now, nine states have gone Republican in every presidential election since 1968: Alaska, Idaho, Kansas, Nebraska, North Dakota, Oklahoma, South Dakota, Utah and Wyoming.
Some other considerations as we evaluate the Electoral College:
- Is Michigan competitive? One of the big surprises of the 1976 election was not only that President Gerald Ford ended up making the race so close against Jimmy Carter, but also that, in the end, Ford's home state of Michigan went for its favorite son, the former congressman from Grand Rapids. Obviously, Romney is not going to win his current home state of Massachusetts, but might he do well in the state where he grew up and his father was governor? Probably not, given Michigan's presidential Democratic leanings and Romney's full-throated opposition to the auto industry bailout. But home state pride is a difficult thing to measure, and a Romney win in Michigan would blow a big hole in Obama's Midwestern firewall. It's one to watch, and Pennsylvania isn't necessarily a slam dunk for Obama either.
- Speaking of home state pride, would picking Sen. Rob Portman (R-OH) as his running mate give Romney a leg up in Ohio? The Buckeye State, as frequently noted here, has gone for the winning candidate in 27 of the last 29 presidential elections, and no Republican has won the White House without it. But on Nov. 7, 1944 -- exactly 35 months after the day (Dec. 7, 1941) that President Franklin D. Roosevelt said would "live in infamy," and 39 days before the Nazis would launch their last-gasp attack on the Western Allies in Europe (Dec. 16, 1944, the first day of the Battle of the Bulge) -- voters in Ohio narrowly voted to throw Commander-in-Chief Roosevelt out of the White House, bucking the nation as a whole. Why? Probably because Ohio Gov. John W. Bricker was Republican nominee Thomas E. Dewey's running mate. The potential effect of Portman on the ticket is difficult to quantify at this point, and perhaps he would mean little. But he also might be the difference between victory and defeat for Romney in a state he must win to secure the presidency.
- Would winning Ohio guarantee the presidency for Romney? Not necessarily. Richard Nixon won Ohio in 1960 but lost the presidency (just like Dewey in 1944). When Nixon in 1968 won his first presidential victory, his winning coalition was built on three big-state pillars: California (40 electoral votes) and Ohio and Illinois (both with 26 electoral votes). Ohio is now down to 18 electoral votes as its population growth has sagged. It remains a prize, but Obama has paths to victory without it.
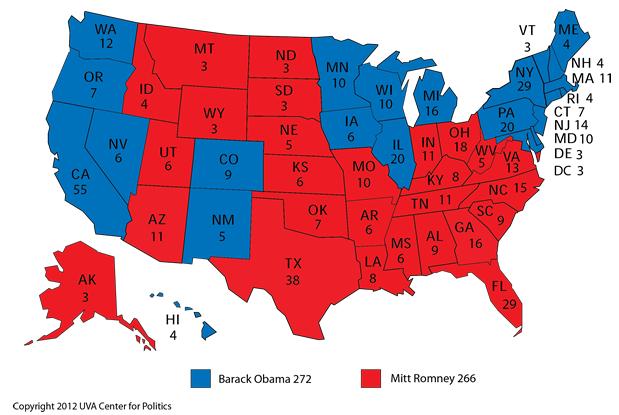
- One way of looking at this election is this: Obama took 52.87% of the popular vote in 2008, which was the best performance in the popular vote by a Democrat since 1964. In 23 of the 28 states he won (plus DC), Obama won a greater percentage of the vote than he did nationally. Conveniently for Obama, if he simply retains the states where he ran better than he did nationally, he will take 272 electoral votes -- two more than necessary. This scenario assumes that Romney garners all 22 of John McCain's states, plus Florida, Indiana, North Carolina, Ohio and Virginia.
Map 2: How Obama wins in 2012 by holding the states where he outperformed his 2008 national average
- Of all the states in 2008, Virginia (52.63% for Obama) came closest to matching the president's national average. If one assumes that Obama can keep all of his overperforming states from 2008 minus New Hampshire -- the fickle state next door to the one where Romney was governor -- then the election comes down to Virginia, not to Ohio. Indeed, it's not hard at this early point to imagine Romney winning Florida and/or Ohio but still losing the election. It is also easy to imagine Obama losing overall if he can't win the Old Dominion, which gave Obama a considerably larger share of its 2008 votes than did Florida or Ohio.
Conclusion: Solid Red and Blue Foundations
Somewhat predictable trench warfare in presidential elections has defined the past five cycles in a large majority of the 50 states, but it hasn't always been this way. As friend of the Crystal Ball Richard Skinner, a political science professor at the New College of Florida, pointed out to us, only two states from 1964 to 1976 -- Massachusetts (D) and Arizona (R) -- voted for the same party in all four presidential elections.
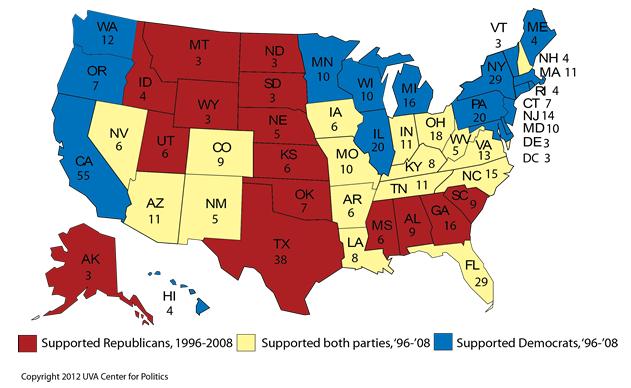
Meanwhile, in the four most recent elections -- 1996 through 2008 -- 33 states voted for the same party in all elections, as shown in Map 3. And that number would increase to 40 if we only counted the 2000, 2004 and 2008 elections.
Map 3: Predictable America: The 33 states that backed the same presidential party from 1996-2008
The American electoral map will surely change in future elections: perhaps the Southwest will become more Democratic as minority populations grow, while the Midwest becomes more Republican because of a larger group of white seniors and working class voters. Or maybe minority groups will become less Democratic, or whites will become less Republican, which would jumble the map massively. It's hard to foresee exactly what will happen in the long term, but in the short term, the nation's basic regional partisan split -- Republican in the Southeast and interior West, Democratic in the Northeast, West Coast and parts of the Midwest -- appears likely to persist.
-- Crystal Ball interns Douglas Colby, Saeid Kian and Chris Monioudis contributed to this article.
*Trivia Answer: The four states that supported Carter in 1980 and Dukakis in 1988 were Hawaii, Minnesota, Rhode Island and, perhaps surprisingly, West Virginia. West Virginia was once heavily Democratic at the presidential level, and it still is at the state level -- though that may be changing, too. But the Mountain State has moved firmly into the Republican column in presidential contests.
Larry J. Sabato is the director of the Center for Politics at the University of Virginia.
See Other Commentary by Larry Sabato
Kyle Kondik is the House Editor at the Center for Politics at the University of Virginia.
See other Political Commentary by Kyle Kondik .
See Other Political Commentary
Views expressed in this column are those of the author, not those of Rasmussen Reports. Comments about this content should be directed to the author.
Rasmussen Reports is a media company specializing in the collection, publication and distribution of public opinion information.
We conduct public opinion polls on a variety of topics to inform our audience on events in the news and other topics of interest. To ensure editorial control and independence, we pay for the polls ourselves and generate revenue through the sale of subscriptions, sponsorships, and advertising. Nightly polling on politics, business and lifestyle topics provides the content to update the Rasmussen Reports web site many times each day. If it's in the news, it's in our polls. Additionally, the data drives a daily update newsletter and various media outlets across the country.
Some information, including the Rasmussen Reports daily Presidential Tracking Poll and commentaries are available for free to the general public. Subscriptions are available for $4.95 a month or 34.95 a year that provide subscribers with exclusive access to more than 20 stories per week on upcoming elections, consumer confidence, and issues that affect us all. For those who are really into the numbers, Platinum Members can review demographic crosstabs and a full history of our data.
To learn more about our methodology, click here.


