Trump-District House Democrats Could Become Extinct This November
A Commentary By Kyle Kondik
How redistricting has altered the number of “crossover” districts.
KEY POINTS FROM THIS ARTICLE
— The number of “crossover” districts — those won by different parties for president and House — has generally been declining over time.
— Under the current congressional district lines, there were only 16 crossover districts in 2020, with Republicans winning 9 Biden-won seats and Democrats winning 7 Trump-won seats.
— Based on the new district lines, and with a few states still outstanding, there are currently 16 incumbents running in districts that their party did not win for president: 11 Republicans in Biden seats and 5 Democrats in Trump seats.
— The Democrats may not hold a single Trump district next year, and the Republicans very well could hold many more Biden-won seats.
The new “crossover” districts
One growing trend in American politics is that fewer and fewer members of the U.S. House hold districts that the other party won for president.
There were only 16 districts in 2020 that voted for different parties for president and for U.S. House. There were 9 Republicans who won districts that Joe Biden carried, and there were 7 Democrats that carried districts that Donald Trump carried.
This was a historically low number. The total of just 16 crossover districts is the lowest since at least 1952, and maybe the lowest in a century or more. We say “maybe” because records are incomplete prior to 1952, according to the Brookings Institution’s Vital Statistics on Congress — see Table 2.16 here for more information.
Figure 1 shows the percentage of crossover districts in the House in each election since 1964. This figure is a modified version of one I included in my book The Long Red Thread, a history of House elections since the 1960s — it starts in 1964 because that was the first election after the U.S. Supreme Court’s Wesberry vs. Sanders decision, which applied the principle of “one person, one vote” to U.S. House districting (it would take several cycles for every state to come into compliance with the ruling). The data in the figure itself were provided to me by Jonathan Rodden and featured in his book, Why Cities Lose.
Figure 1: Crossover House districts as percentage of total districts, 1964-2020
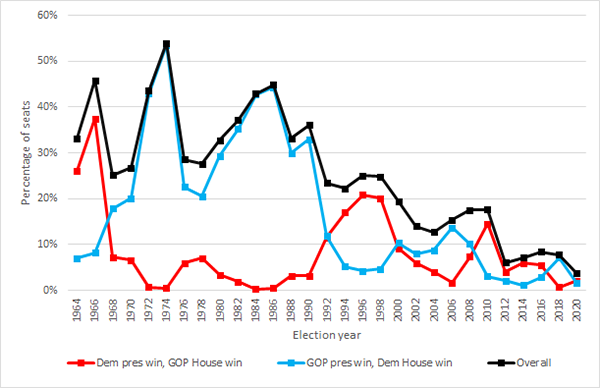
Source: The Long Red Thread; Why Cities Lose.
Note that while the totals vary from year to year, the overall tally is generally getting smaller over time, as evidenced by the noisy but downward-sloping black line (the total percentage of crossover seats among the total number of seats in the House). The huge number of crossover districts in the 1960s, 1970s, and 1980s was at least partially a function of the blowout victories we saw in presidential elections during this era: the 1964 election was Lyndon Johnson’s landslide, and 1972 and 1984 were those of Richard Nixon and Ronald Reagan. The bigger the presidential blowout, at least back then, the more crossover districts there might be.
But voters were just generally likelier to split their tickets back then, usually to the benefit of congressional Democrats: Notice that the blue line, the percentage of total House members who were Democrats in districts GOP candidates won for president, is often markedly higher than the red line, the percentage of total House members who were Republicans in districts that Democrats won for president, until the early 1990s, when the GOP broke the Democrats’ 40-year hammerlock on the House majority. Over the last several elections, Republicans have won more crossover districts with the exception of 2018, although the numbers in 2020 were both small in total and very similar on both sides.
Figure 1 also shows that the number of crossover districts can spike in favor of the non-presidential party in midterm years. See, for instance, the Republican spikes in 1994 and 2010, and the Democratic bumps in 2006 and 2018, as well as the predictable dips for the presidential party in their own tally of crossover districts in those years. If 2022 ends up being a good Republican year, expect something similar to happen.
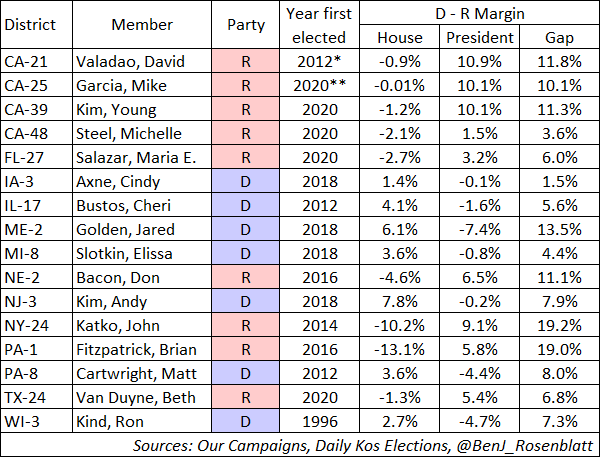
Redistricting also can have an impact on the number of crossover seats, as members who find themselves in crossover districts can be bailed out of them by friendly mapmakers, or those who occupy districts where their party matches presidential partisanship can end up in districts won by the other party’s presidential candidate if the mapmakers are not so friendly. As we check in on the evolving number of crossover districts, let’s look back to what happened in 2020 and use that as a starting point. Table 1 shows the crossover members elected in that election, a group that we analyzed in depth last year.
Table 1: Crossover House members elected in 2020
Congressional redistricting is finished — barring late legal intervention — in nearly all of these states. Let’s look at who has moved off of this list.
In Texas, first-term Rep. Beth Van Duyne (R, TX-24) saw her Biden-won district converted into one that Trump won by about a dozen points. She was one of several Texas Republicans whose districts were shored up by friendly mapmakers — while she was the only Texas Republican House member in a Biden-won district, several others hold districts that came close to voting for Biden. New Jersey’s bipartisan commission went with a Democratic plan that fortified some Democratic incumbents, including Rep. Andy Kim (D, NJ-3), who is now in a Biden +14 seat after winning an extremely narrow Trump seat in 2020.
In Michigan, Rep. Elissa Slotkin (D, MI-8 — now running in MI-7) saw her district reconfigured by the state’s new independent commission. She will be running for reelection in a modified district reoriented around Lansing that Biden narrowly won (by about a point) after winning in 2020 in a district that Trump narrowly won (also by about a point). So she moves off this list as well, even as her district remains clearly marginal.
So 3 of these 16 incumbents will seek new terms in districts that their party won for president. If they win, they will no longer be crossover district members.
Retiring Rep. Cheri Bustos (D, IL-17) could have run in a northwestern Illinois district that Biden won by about 8 points, compared to the narrow Trump-won seat she actually holds (Illinois Democrats gerrymandered the state). But she opted to retire. Other retirees on this list are Reps. Ron Kind (D, WI-3) in western Wisconsin and John Katko (R, NY-24) in the Syracuse area. Kind’s district didn’t change much in redistricting; Katko’s renumbered district got markedly more Democratic thanks to a Democratic gerrymander that continues to face a court challenge. Our ratings favor both of these districts to flip in November, meaning that we do not expect their next representatives to be on the crossover list in the new Congress.
One member on this list, Rep. Maria Elvira Salazar (R, FL-27) in South Florida, remains a question mark as redistricting remains incomplete in the Sunshine State (more on that below).
So of the 16 names on this list, only 9 are for sure seeking reelection in districts the other party won for president.
Four of them are California Republicans. Reps. David Valadao (R, CA-21 — now running in CA-22), Mike Garcia (R, CA-25 — now running in CA-27), and Michelle Steel (R, CA-48 — now running in CA-45) are all running in districts where Biden did better than he did in their current districts, while Rep. Young Kim (R, CA-39 — now running in CA-40) is running in a much more marginal district that should be easier for her to hold. The remaining holdovers — Reps. Cindy Axne (D, IA-3), Jared Golden (D, ME-2), and Matt Cartwright (D, PA-8) on the Trump-Democratic side and Reps. Don Bacon (R, NE-2) and Brian Fitzpatrick (R, PA-1) on the Biden-Republican side — saw only modest change to the 2020 presidential numbers in their districts.
There are 7 new crossover district members — sitting members who are seeking reelection in districts the other party won for president — that are joining them. Our list is in Table 2.
Table 2: House members seeking reelection in districts the other party won for president
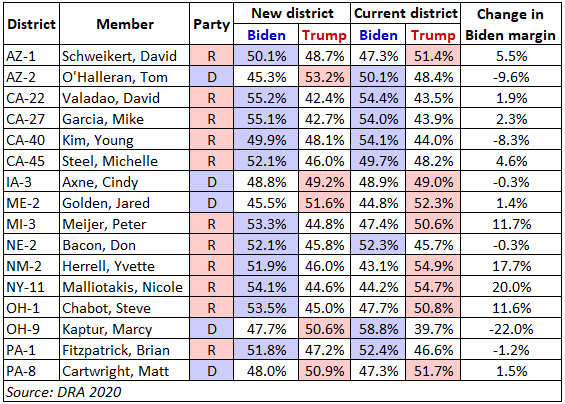
This means that there continues to be 16 members on this list, although the partisan makeup is different. Instead of there being 9 Biden-district Republicans and 7 Trump-district Democrats on this list — as there are on Table 1, the actual results from 2020 — we count 11 Republicans seeking reelection to Biden-won districts and just 5 Democrats seeking reelection to Trump-won districts so far. In addition to the 9 holdovers cited above, there are some new members here, all of whom were harmed to some degree by redistricting.
In Arizona, Republicans largely got the better of the state’s independent redistricting process after Democrats benefited a decade ago, and that process created 2 new crossover districts. Rep. Tom O’Halleran (D, AZ-1 — running in AZ-2) saw his northeast Arizona seat reconfigured from a narrow Trump 2016/Biden 2020 seat into a Trump +8 district that he will have a very hard time winning. Rep. David Schweikert (R, AZ-6 — running in AZ-1) saw his metro Phoenix seat changed from a Trump +4 seat to a roughly Biden +1.5 seat. Given the 2022 environment, Schweikert should be OK in 2022 but could face trouble in future election cycles. In Michigan, already noted as a commission state above, first-term Rep. Peter Meijer (R, MI-3) now finds himself in a clearly Biden-won district in the Grand Rapids area, which might not be that much of a hindrance as the district is redder down-ballot and Meijer could easily attract crossover support as a Trump critic (he backed the second impeachment of Trump). However, he still has to get through a primary.
Democratic gerrymandering put 2 Republicans on this list, first-term Reps. Yvette Herrell (R, NM-2) in southern New Mexico and Nicole Malliotakis (R, NY-11) on Staten Island. We call both districts Toss-ups. And, finally, Ohio Republicans created 2 new crossover districts as part of what could be called a constrained gerrymander (we analyzed the map in detail last week). Rep. Steve Chabot (R, OH-1) is seeking reelection in a Biden +8.5 seat in the Cincinnati area, and Marcy Kaptur (D, OH-9) is seeking another term in a Trump +3 seat in and around Toledo.
This list may change slightly as redistricting is finished in the 3 states where maps are still being drawn: Florida, Missouri, and New Hampshire. In Missouri, it’s possible that Republicans will put Kansas City-area Rep. Emanuel Cleaver (D, MO-5) in a Trump-won district, although most Republicans seem to want to keep the status quo there while bolstering Rep. Ann Wagner (R, MO-2), who holds a district in the St. Louis area that Trump only won by 115 votes, according to number-crunchers at the liberal elections site Daily Kos Elections. In the Granite State, Rep. Chris Pappas (D, NH-1) would have found himself in a narrow Trump district if state legislative Republicans had their way, but Gov. Chris Sununu (R-NH) does not support that plan. Gov. Ron DeSantis (R-FL) is pushing for a wider Republican edge in his state and he very well may get it, as state legislative Republicans announced recently that they are effectively deferring to him on congressional redistricting in a special session slated to start next week. DeSantis wants to dismantle the Democratic seat held by Rep. Al Lawson (D, FL-5), whose substantially Black district currently runs from Tallahassee to Jacksonville, and make other changes to benefit Republicans in open, Democratic-held districts, as reflected in a new map draft he released Wednesday. The aforementioned Salazar could also get a Trump-won district. We’ll just have to wait and see, and there will be lawsuits, assuredly.
There are a few potential crossover districts that we could have included but didn’t because they aren’t being defended by incumbents. For instance, the aforementioned WI-3 would be included if Democrat Ron Kind were defending it. Additionally, Texas Republicans reduced the number of Biden-won South Texas districts from 3 to 2, converting TX-15 from a Biden district to a Trump district, but no Democratic incumbent is running there, and we favor Republicans to flip that district. The same is somewhat true for the reconfigured MI-10 in the northern Detroit suburbs, which Trump won by a tiny margin and where Rep. Andy Levin (D) hypothetically could have run for reelection. But Levin is running against Rep. Haley Stevens (D, MI-11) in a strongly Democratic district instead, leaving MI-10 as an open seat that Democrats could potentially defend but where 2018 and 2020 Senate nominee John James (R) appears to be the likeliest winner. We also did not include districts like NY-1, which a Democratic gerrymander flipped from Trump to Biden, or GA-6 and TN-5, which Republican gerrymanders flipped the other way, because they are all open seats.
Conclusion
At the moment, there are 16 incumbents who are trying to be elected as crossover members in 2022, the same number who won in 2020. Redistricting, late-breaking candidate decisions, and judicial action could change this tally.
Going forward, what do we expect? Well, the number of Trump-district Democrats will likely get even smaller — to the point where there might not be a single one in the next Congress — and the number of Biden-district Republicans will likely grow, quite possibly by a lot.
Of the 5 Democratic incumbents running for reelection in Trump districts, we currently rate 1 (O’Halleran) as a clear underdog. The other 4 (Axne, Cartwright, Golden, and Kaptur) are in Toss-up races, and all could lose. Republicans are favored in every other Trump-won district. To the extent that Democrats can play offense in this election, that likely would come in Biden-won districts in states like California and New York (assuming the Democratic gerrymander holds in the latter).
In 2014, a strong Republican midterm election, Democratic House candidates only won 5 districts that Mitt Romney had carried in the 2012 presidential election. In 2018, a Democratic midterm year, Republicans won only 3 districts that Hillary Clinton had carried in 2016. This election could very well be even worse for the president’s party in such districts.
Republicans, meanwhile, have many plausible Biden-district targets beyond those they will be trying to defend this year. We’ll get into this in much more detail in future issues, but we rate about 2 dozen Biden-won Democratic districts in either the competitive Toss-up or Leans categories in our ratings. In 2018, Democrats increased their number of Trump-won districts to 31, compared to just 12 in 2016.
Overall, it seems likelier than not that the total number of crossover districts will increase from the 16 we saw in 2020. But the way that is likeliest to happen is that the number of Trump-district Democrats would be reduced or even eliminated entirely while the number of Biden-district Republicans significantly spikes.
— J. Miles Coleman contributed to this article.
Kyle Kondik is a Political Analyst at the Center for Politics at the University of Virginia and the Managing Editor of Sabato's Crystal Ball.
See Other Political Commentary by Kyle Kondik.
See Other Political Commentary.
Views expressed in this column are those of the author, not those of Rasmussen Reports. Comments about this content should be directed to the author or syndicate.
Related Articles

Rasmussen Reports is a media company specializing in the collection, publication and distribution of public opinion information.
We conduct public opinion polls on a variety of topics to inform our audience on events in the news and other topics of interest. To ensure editorial control and independence, we pay for the polls ourselves and generate revenue through the sale of subscriptions, sponsorships, and advertising. Nightly polling on politics, business and lifestyle topics provides the content to update the Rasmussen Reports web site many times each day. If it's in the news, it's in our polls. Additionally, the data drives a daily update newsletter and various media outlets across the country.
Some information, including the Rasmussen Reports daily Presidential Tracking Poll and commentaries are available for free to the general public. Subscriptions are available for $4.95 a month or 34.95 a year that provide subscribers with exclusive access to more than 20 stories per week on upcoming elections, consumer confidence, and issues that affect us all. For those who are really into the numbers, Platinum Members can review demographic crosstabs and a full history of our data.
To learn more about our methodology, click here.