Notes on the State of Politics
A Commentary By Kyle Kondik
Debate effects can fade; Trump may be running behind his approval; the NC-9 special; a Magnolia runoff?
KEY POINTS FROM THIS ARTICLE
— The polling effects from the first debate largely wore off by the time the second round started.
— In 2016, President Trump won some voters who otherwise did not like him, but there are some signs he isn’t benefiting from such a dynamic at the moment.
— The NC-9 special House election moves from Toss-up to Leans Republican.
— Mississippi’s GOP gubernatorial primary may be headed to a runoff.
Debate effects may not endure
According to the RealClearPolitics average, here was the national polling average for the Democratic presidential nomination battle on June 26, the day of the first debate (we’re only listing candidates who were at 2% or higher in the average, rounded to the nearest whole percentage point):
Joe Biden 32%, Bernie Sanders 17%, Elizabeth Warren 13%, Kamala Harris 7%, Pete Buttigieg 7%, Beto O’Rourke 3%, and Cory Booker 2% (no one else had 2% support or more).
On Tuesday morning, the day of the start of the second round of debates, the average was:
Biden 32%, Sanders 16%, Warren 14%, Harris 11%, Buttigieg 6%, O’Rourke 3%, Andrew Yang 2%, and Booker 2%.
In between then and now, Biden did in fact dip several points — hitting a low of 26% in the average — before recovering to his previous standing. Harris rose as high as 15% and is still several points higher than before, but the debate effects seemed to dissipate. The others didn’t change much at all.
So as we wait to see what effect Tuesday and Wednesday night’s debates have on the race for the Democratic nomination, don’t necessarily assume that changes we may see are permanent — if changes occur at all. To our eyes, we didn’t see much from the debates that seems likely to fundamentally alter the race.
Trump: Running behind approval?
A big part of the reason why Donald Trump won the presidency in 2016 was that he captured a not-insignificant percentage of voters who did not necessarily like him but chose him anyway over Hillary Clinton. Only 38% of the electorate reported having a favorable opinion of him, according to the national exit poll, but he won 46% of the vote, meaning that he ran eight percentage points ahead of his favorability. Clinton, whose favorability was 43%, got 48% of the vote, meaning that she only ran five points ahead of her favorability. Additionally, Trump won 47%-30% among the 18% of the electorate who held unfavorable views of both Trump and Clinton.
That Trump was able to capture voters who held an unfavorable view of him suggests that perhaps he could do it again in 2020, particularly if the eventual Democratic nominee also becomes unpopular. This helps explain why Trump is desperate to make the election a choice as opposed to a referendum.
However, in some early ballot tests, there is some indication that Trump is not only failing to pick up support from people who don’t like him, but in some instances he does not appear to be winning every poll respondent who approves of his job performance.
Let’s look at three well-established, live-caller national polls released over the last month that asked both about Trump’s approval rating and tested the president in ballot tests against the leading Democratic candidates: Fox News, NBC News/Wall Street Journal, and ABC News/Washington Post.
The Fox News poll released last week found that Trump’s approval rating among registered voters was 46%, but he only attracted between 39%-42% of the vote in matchups against the top-polling Democratic presidential contenders (Joe Biden, Kamala Harris, Elizabeth Warren, and Bernie Sanders — Biden usually does the best in these head-to-heads with Trump at this point). The NBC News/Wall Street Journal poll released in early July found Trump’s approval at 45% among registered voters, but his support in ballot tests against the four top Democrats was just 42%-44%. The ABC News/Washington Post survey conducted right after the first debates found Trump at 47% approval among registered voters, but Trump was only at 43% against Biden: against the three others, Trump was between 46%-48%, effectively equaling his approval.
The differences here are slight, but this is something worth monitoring because Trump’s path to victory probably entails him either improving his approval rating so that it’s in the mid-to-high 40s as opposed to the mid-to-low 40s, or running ahead of his approval by capturing a small but significant number of voters who don’t approve of him. But if Trump is actually losing a small number of voters who approve of his job performance, he may have a very hard time cobbling together another Electoral College majority.
Just for comparison’s sake, we went back and looked at how Barack Obama was faring against Mitt Romney in surveys from the same outlets at about the same time in his presidency. In an ABC News/Washington Post poll from mid-July 2011, Obama’s approval among all adults was 47%, but he was at 51% against Mitt Romney, who would become his eventual 2012 opponent. Around the same time, Fox News pegged Obama’s approval at 45% among registered voters and he was at 47% against Romney; NBC News/Wall Street Journal had Obama at 47% approval among all adults and 48% against Romney among registered voters. In other words, Obama was running at or ahead of his approval rating more consistently back then compared to Trump now.
For what it’s worth, the approval rating of incumbent presidents around the time of Election Day who have run for reelection over the past several decades has correlated fairly well with their final share of the vote. We went back to Richard Nixon’s 1972 reelection for this exercise and used the FiveThirtyEight approval average for each president; however, we omitted Gerald Ford in 1976 because it did not appear as though there was any fresh approval polling in the lead-up to the election, which he narrowly lost to Jimmy Carter.
Table 1: Presidential approval at Election Day, 1972-2012
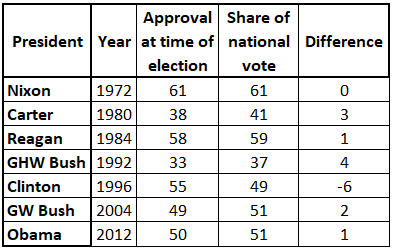
Sources: FiveThirtyEight and Dave Leip’s Atlas of U.S. Presidential Elections
Bill Clinton was the only president who underperformed his approval, and that probably had at least something to do with the unusual circumstances of the election, which featured Ross Perot’s second presidential campaign (as it was, Clinton soundly beat Bob Dole 49%-41%, with Perot winning 8%).
To be clear, horse race polls this early in an election cycle are not predictive, and there are not huge differences in Trump’s approval and his horse race polling. But one might generally expect an incumbent president to win a share of the vote commensurate with his approval rating. In some national polls, Trump is running behind his approval. It’s worth watching whether that continues as the marathon campaign meanders on.
NC-9 Leans Republican
Campaigns sometimes confuse us with their decisions to release internal polls. Generally speaking, one has to take these polls with a grain of salt, and it’s usually a safe assumption to believe that they present a rosy picture of whichever campaign releases them. So it was a little odd that the campaign of Dan McCready (D), a Marine veteran running in a special, do-over election in NC-9, released a poll only showing him tied with state Sen. Dan Bishop (R). The poll showed the candidates knotted at 46%, with McCready outperforming a generic ballot in the district, which showed a Republican leading 48%-39%.
This is effectively the last election of the 2018 cycle; McCready seemed to narrowly lose last November to former pastor Mark Harris (R), but credible allegations of fraud designed to help Harris prompted a second election.
This internal poll is a reminder that this district, which extends east and south from the Charlotte suburbs and which Donald Trump won by about a dozen points, leans considerably to the right of the nation. We have little doubt that McCready, a very well-funded candidate, can and will outperform the generic lean of the district, as this poll suggests. But the district may end up being too hard in a political environment that may not be as Democratic-friendly as it was prior to the midterm.
According to a compilation of the results by the liberal site Daily Kos Elections, Democrats on average ran 11 points ahead of Hillary Clinton’s 2016 margin in state and federal legislative special elections held between the 2016 and 2018 elections. That’s the kind of overperformance Democrats would need to win NC-9. During this cycle’s legislative special elections, Democrats are still overperforming Clinton’s 2016 showing on balance, but by less on average, six points. This may help provide context for the political environment in which NC-9 is being contested: If this race was happening during the 2018 cycle, it may really have been a Toss-up, as it basically was on Election Night. But now that it’s happening in the 2020 cycle, when the parties may be a bit closer in terms of off-year motivation, it may be that the district is a bit too Republican for the race to feel like a true Toss-up.
Special elections are unpredictable, and we still think NC-9 should be close. McCready has a substantial money edge on Bishop, although so far Republican outside groups seem to be making much more of an investment in the race, which will even things out for Bishop (this according to a helpful summary from Politico). All told, we think we’d probably rather be the Republicans here with less than a month and a half to go until the Sept. 10 election. So we’re moving NC-9 from Toss-up to Leans Republican.
We also wanted to make note a few other House ratings changes that we have announced on Twitter over the past couple of months but that we have not specifically addressed in the Crystal Ball. These have been predicated on candidate decisions — either incumbents retiring or noteworthy challengers emerging.
Table 2: House ratings changes
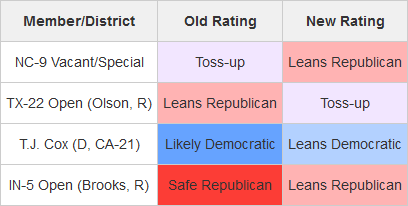
Note: TX-22 change previously announced July 25 via Twitter; CA-21 change announced July 18; IN-5 change announced on June 14.
Most recently, last Thursday, we moved TX-22 from Leans Republican to Toss-up following the retirement of Rep. Pete Olson (R). This suburban Houston seat is one of many that appeared to be very safely Republican until the emergence of Donald Trump as the leader of the Republican Party pushed many voters in affluent, highly-educated suburban areas toward the Democrats. This district shifted from voting for Mitt Romney by 25 points in 2012 to backing Trump by only eight in 2016. This shift continued in 2018, as Sen. Ted Cruz (R-TX) only carried the district by less than a point against challenger Beto O’Rourke (D) according to election analyst J. Miles Coleman, and Olson only won by five points against Sri Preston Kulkarni (D), who is running again. It may be that the GOP is eventually favored, but this district was already strongly on both party’s radars even before Olson retired.
A couple of weeks ago, we also moved Rep. T.J. Cox (D, CA-21) from Likely Democratic to Leans Democratic after ex-Rep. David Valadao (R) took steps toward a rematch. This is an odd district: Hillary Clinton won the Central Valley-based, majority Hispanic district by 16 points but Valadao won easy victories in 2012, 2014, and 2016 before narrowly falling to Cox last year. On paper, this is not a district a Republican should win in a presidential year, but Valadao is a strong candidate who should not be counted out.
In mid-June, we moved IN-5 in the Indianapolis suburbs from Safe Republican to Leans Republican following the retirement of Rep. Susan Brooks (R). It is another highly-educated suburban seat that is newly vulnerable in the Trump era, but it doesn’t seem quite as difficult for the Republicans as TX-22: It is somewhat similar to OH-12, the seat in Central Ohio that Republicans held in a nationally-watched special election last year (Trump won both IN-5 and OH-12 by roughly a dozen points).
A number of other Republicans from Safe Republican seats announced their retirements over the last week: Reps. Martha Roby (R, AL-2), Paul Mitchell (R, MI-10), Mike Conaway (R, TX-11), and Rob Bishop (R, UT-1). None of these seats are competitive in a general election. But sometimes retirements can be an ominous sign for a party, because it may signal a lack of confidence in the next election: These are members who wouldn’t have had trouble winning a general election, but serving in the minority is unpleasant and perhaps they do not feel good about the prospects of the GOP winning the majority in 2020. Ultimately, no one except the members themselves know exactly why they retired, and the fact that several Republicans who lost in 2018 appear to be running again — Valadao prominent among them — presents an opposing and more bullish view of GOP confidence about 2020. We wouldn’t read into these developments too much either way about the outlook for next year, which is still a long time away anyway and will hinge on several factors that are as-yet unknown.
Overall, we have 224 House seats rated as Safe, Likely, or Leans Democratic, 194 Safe, Likely, or Leaning Republican, and 17 Toss-ups. Splitting the Toss-ups roughly evenly, let’s say nine for the Republicans and eight for the Democrats, would result in a 232-203 House, or a net loss of three for the Democrats. Republicans need to net at least 18 seats to win the House (depending on what happens in NC-9).
A Mississippi runoff?
The primaries for the Mississippi governor’s race are next Tuesday. Even though Lt. Gov. Tate Reeves (R) has long been the favorite, he may have to face a runoff. A Mason-Dixon poll released earlier this week showed Reeves with 41%, followed by former state Supreme Court Chief Justice Bill Waller, Jr. at 31%, and state Rep. Robert Foster lagging back at 13%. Foster has made the most national news, thanks to his refusal to allow a female reporter to follow him on a campaign trip without a male colleague tagging along, but the real story is that Waller appears to really be pushing Reeves. The runoff would be Aug. 27. State Attorney General Jim Hood (D), a social conservative with an impressive electoral track record, is the likely Democratic nominee.
Republicans are gunning for their fifth-straight gubernatorial victory in racially-polarized Mississippi, where a unified and Democratic African-American voting bloc is typically outvoted by a slightly-less unified but significantly larger Republican white voting bloc. While Hood is the strongest-possible Democratic candidate, this is still the GOP’s race to lose given the state’s Republican leanings. We rate this race as Leans Republican, which is the same rating we’ve given to Kentucky’s governor’s race, where unpopular Gov. Matt Bevin (R) faces a very credible challenge from state Attorney General Andy Beshear (D).
The other gubernatorial race this year, in Louisiana, we rate Leans Democratic as Gov. John Bel Edwards (D) seeks a second term. That race features an all-party primary on Oct. 12; if no one gets over 50% — Edwards hypothetically could but probably won’t — there will be a runoff on Nov. 16. Edwards’ two leading challengers are Rep. Ralph Abraham (R, LA-5) and businessman and political donor Eddie Rispone (R). Abraham is favored to face Edwards in the runoff but Rispone is spending a lot of personal money to catch up, and it would hardly be surprising if a business figure surpassed an elected official in a GOP primary setting.
Kyle Kondik is a Political Analyst at the Center for Politics at the University of Virginia and the Managing Editor of Sabato's Crystal Ball.
See Other Political Commentary by Kyle Kondik.
See Other Political Commentary.
This article is reprinted from Sabato's Crystal Ball.
Views expressed in this column are those of the author, not those of Rasmussen Reports. Comments about this content should be directed to the author or syndicate.
Related Articles

Rasmussen Reports is a media company specializing in the collection, publication and distribution of public opinion information.
We conduct public opinion polls on a variety of topics to inform our audience on events in the news and other topics of interest. To ensure editorial control and independence, we pay for the polls ourselves and generate revenue through the sale of subscriptions, sponsorships, and advertising. Nightly polling on politics, business and lifestyle topics provides the content to update the Rasmussen Reports web site many times each day. If it's in the news, it's in our polls. Additionally, the data drives a daily update newsletter and various media outlets across the country.
Some information, including the Rasmussen Reports daily Presidential Tracking Poll and commentaries are available for free to the general public. Subscriptions are available for $4.95 a month or 34.95 a year that provide subscribers with exclusive access to more than 20 stories per week on upcoming elections, consumer confidence, and issues that affect us all. For those who are really into the numbers, Platinum Members can review demographic crosstabs and a full history of our data.
To learn more about our methodology, click here.