In 2016’s Game of Musical Chairs, the Music Stopped at the Wrong Time for Clinton
A Commentary By Kyle Kondik and Geoffrey Skelley
After the Bay of Pigs debacle, when U.S.-backed forces tried and spectacularly failed to topple Fidel Castro’s nascent communist regime in Cuba, President John F. Kennedy held a press conference and took blame for the failure. Speaking on April 21, 1961 — just a few months into his presidency — JFK memorably declared, “There’s an old saying that victory has a hundred fathers and defeat is an orphan,” meaning that when something goes right, many will want to take credit for it, but when something goes wrong, no one wants to take the blame.
We were thinking about the quote over the weekend after Castro’s death, particularly in relation to how it might be used to describe the 2016 election. That’s not just a reference to Trump advisers taking credit or Hillary Clinton’s campaigners shirking blame. Rather, we were thinking about how in a very close race, there can be many different factors that made the difference between one candidate’s victory and the other’s defeat. A tight election outcome might be said to have “100 fathers,” all of which may or may not have been decisive.
Indeed, the 2016 election was highly competitive. Trump won 306 electoral votes in an election where six states were decided by less than two points: Trump carried Michigan by 0.2 points, Wisconsin by 0.8, Pennsylvania by 1.1, and Florida by 1.2, while Clinton won New Hampshire by 0.4 and Minnesota by 1.5. Flipping Michigan, Pennsylvania, and Wisconsin would have given Clinton the Electoral College*, while a slightly better showing in Minnesota and New Hampshire would have given Trump a margin of more than 100 electoral votes.
After the election, there have been several explanations offered for Trump’s surprising victory. These include Trump’s digital campaign efforts, the Clinton campaign’s neglect of the Rust Belt battlegrounds, and the proliferation of “fake news” online — some of the hundred fathers of the 2016 presidential result. Every one of them might have had some bearing on the outcome.
While keeping in mind that all sorts of things potentially contributed to Trump’s victory, we have a theory that might help explain the essence of what happened.
Clinton seemed dependent on Trump’s many controversies throughout the campaign cycle. She enjoyed some of the best polling of the campaign during periods where Trump’s missteps dominated the news. These periods included the post-Democratic National Convention period, when Trump got into a spat with Khizr Khan, the Gold Star father who spoke against Trump at the DNC, and during the second weekend of October, when Trump’s offensive comments about women in the Access Hollywood tape surfaced. These stories seemed to suppress Trump’s vote, moving Trump voters from his column to either the third-party candidates or to undecided. Clinton generally kept her lead during the debate period (Sept. 26-Oct. 19), and post-debate polls indicated that the public thought Clinton got the better of Trump in all three debates.
But the last debate was nearly three weeks before Election Day, giving Trump time to recover and for new developments to alter the election’s state of play.
Sure enough, there was a major late development: FBI Director James Comey’s letter to Congress announcing that the bureau was looking into new emails potentially related to its investigation of Clinton’s use of a private email server while she served as secretary of state. Two days before the election, Comey followed up and said the emails did not change the FBI’s conclusion to not recommend charges against Clinton, but any damage to Clinton may have already been done — and the announcement itself underlined yet again Clinton’s email controversy.
The Comey letter dropped on Friday, Oct. 28 — nine days after the last debate, and 11 days before the election. By this time, Clinton’s six-point national lead on the day of the final debate had been cut to four, and it would fall to three in the RealClearPolitics average by Election Day. It now appears she’ll win the national popular vote by about two points, so the national polls taken together were close to the mark. Still, Trump managed to win by narrow margins in several key swing states.
Over the last two months of the campaign, the Crystal Ball kept an eye on the statistical relationship between the amount of attention Trump and Clinton received and the margin between them in the polls. We did this using a few different data points: Trump’s margin in the different iterations of the HuffPost Pollster and RealClearPolitics polling averages; how much more or less Gallup respondents said they had read, heard, or seen something about Trump versus Clinton in the last day or two; and how much more or less Google users searched for Trump compared to Clinton in the United States. While correlation between the polling margin and these two indicators of public attention does not necessarily imply causation, the notable correlations between some of these data suggest that there may have been something to the idea that greater exposure adversely affected a candidate’s poll numbers. After all, as Kristen Soltis Anderson and Patrick Ruffini of Echelon Insights recently noted in The Washington Post, there were more Google searches for “Donald Trump” in states that he lost on Nov. 8 than in states that he won.
In an Oct. 13 article, we found fairly strong negative correlations between Trump’s polling margin and the amount of attention he received over the last month of the campaign, according to Gallup and Google Trends. That is, when Trump got more relative exposure than Clinton, his poll standing tended to suffer, and vice versa.
What about the last month of the campaign up to Election Day? Shown in Tables 1 and 2, the results are mixed in comparison to the mid-October findings. The negative correlation between the Gallup data and the two polling averages actually became even stronger. However, the negative correlation between the Google data and the polls became weaker in the case of the RealClearPolitics data, but remained the same or became stronger in the case of HuffPost Pollster.
Table 1: Correlation between Trump’s polling margin and the difference between Trump and Clinton in Gallup’s “read, hear, or see anything about Clinton/Trump” question, as of Oct. 11 vs. Nov. 7
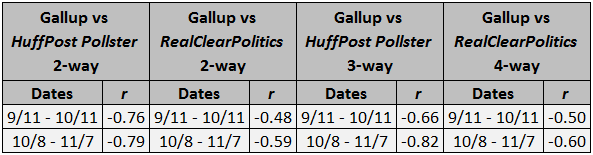
Table 2: Correlation between Trump’s polling margin and the Trump-Clinton difference in Google Trends’ search relevance, as of Oct. 11 vs. Nov. 7
Notes: 2-way polls are head-to-head averages for just Clinton versus Trump, 3-way averages include Gary Johnson, and 4-way averages include Johnson and Jill Stein.
Sources: Oct. 13 Crystal Ball article, Gallup, Google Trends, HuffPost Pollster (2-way, 3-way), RealClearPolitics, (2-way, 4-way)
The divergence between the Gallup correlations and the Google Trends correlations is due to differences regarding how much more Trump was on the public’s mind than Clinton in early to mid-October, following the release of the aforementioned Access Hollywood tape, and just after the third debate on Oct. 19, when Trump refused to say whether he would accept the election result. Google Trends found a much higher volume of Trump searches than Clinton searches in those time periods relative to how much more Gallup respondents said they had read, heard, or seen something about Trump than Clinton in those two periods.
If there was at least some negative causal relationship between attention and poll standing, it is notable that Trump received less attention in the final week and a half of the campaign than Clinton compared to the rest of the campaign. From the start of Gallup’s data (July 5) to Oct. 27 — just before Comey sent his letter to Congress — an average of 78.2% of respondents said “yes” regarding whether they had read, heard, or seen anything about Trump in the past couple of days, compared to Clinton’s 74.7%. From Oct. 28 to Nov. 7, the final day of Gallup’s data, the average percentages flipped to 80.7% for Clinton and 76.1% for Trump. In the same two timeframes, the Google Trends data showed a similar pattern. The average volume of Trump searches from July 5 to Oct. 27 was 28.1% to Clinton’s 21.0%; from Oct. 28 to Nov. 7, Clinton’s average search volume was 41.4% to Trump’s 36.3%. The Comey letter news coverage and Trump’s conspicuous discipline in avoiding controversial statements on the trail and on social media probably help explain this shift.
How much of this can be attributed directly to Comey’s letter and its subsequent coverage is debatable, particularly because there already were signs that Clinton’s lead was diminishing before the letter was released. There also were other unfortunate developments for Clinton during the last few weeks, including the drip-drip-drip of Russian-hacked emails released by WikiLeaks from Clinton campaign chairman John Podesta’s account, among others. In our view, there was never a particularly damning bombshell in the emails, but the steady stream generated daily negative coverage for the Clinton campaign.
The exit poll shows that a fair number of voters claimed to have decided in the final week or two of the campaign. If so, the focus on Clinton’s damaging storylines probably didn’t help her cause in winning over late-deciders. Nationally, the exit poll indicated that 63% of all voters were bothered “a lot” or “some” by Clinton’s use of private email, and Trump edged her 45%-42% among the 13% that decided their vote in the final week (and by a wider 48%-40% amongst those who decided in the final month, who made up a quarter of the electorate).
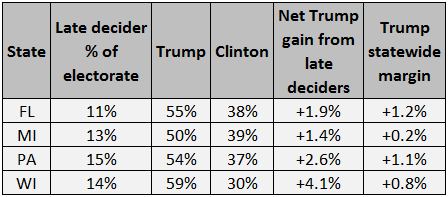
Crystal Ball senior columnist Alan Abramowitz examined the effect that these late deciders had on the four states that provided Trump his smallest margins of victory: Florida, Michigan, Pennsylvania, and Wisconsin. Those results are shown in Table 3.
Table 3: Late deciders in states Trump won by less than two percentage points
Note: “Late deciders” refers to those respondents in the exit polls who said they decided their vote choice in the week before the election.
Source: Exit polls, Dave Leip’s U.S. Atlas of Presidential Elections, Alan Abramowitz
Trump carried late deciders in all of these states — by notably larger margins than he did nationally — and the net effect that Abramowitz calculated from the exits was bigger than Trump’s margin of victory in all four states.
Now it’s possible that this was bound to happen anyway, without the Comey letter or the Podesta emails or any other late developments, in part because Clinton was representing the incumbent White House party after two terms. This election featured an unusually large number of voters who told pollsters they were either undecided or said they would support third-party candidates. In a prescient piece published on the eve of the election, Henry Olsen of the conservative Ethics and Public Policy Center correctly assumed that many of these undecided and third-party voters had profiles that made them likely Trump voters. Sure enough, most polls measured Clinton’s level of support well but understated Trump’s.
There were two competing changes in the electorate this year that, on balance, benefited Trump. Poll after poll indicated that Trump was going to do better with white voters that did not have a bachelor’s degree — certainly better than Mitt Romney did in 2012 — and that’s exactly what happened: Trump won non-college whites 66%-29%, surpassing Romney’s 61%-36% margin. Just as bad for Clinton, she did not do as well with college-educated whites as she needed to. After many pre-election polls suggested that Clinton could win white voters who had a college degree, Trump ended up carrying this group by three points — worse than Romney’s 14-point win, but not enough to push Clinton to an Electoral College majority. Meanwhile, Clinton’s performance with nonwhite voters was a little weaker than Obama’s in 2012 (with all of this, it’s important to remember that exit poll subgroup findings are not as precise as many think).
Had Clinton actually won college-educated whites nationally, she probably would have done better in some key places in critical states, such as the suburbs of Detroit, Milwaukee, and Philadelphia. Because of his special appeal and rural targeting, Trump was destined to significantly outrun Romney in the outlying, working-class parts of these states, and that much was obvious from pre-election polling. But Trump’s ability to hold the line in some large suburban counties was harder to predict in advance and perhaps was a late development influenced by the events we’ve discussed.
No one can be certain, of course, given the imperfect data available today. For example, isolating a single development such as the Comey letter to explain Trump’s win ignores many other factors in an extraordinary election. All of us in and around politics will be studying 2016 for a long time, hoping to unlock more of its tantalizing mysteries.
*There’s little or no reason to think that recounts being pursued by Green Party nominee Jill Stein will change the outcome in the decisive states, as friends of the Crystal Ball Jeffrey Blehar and Brandon Finnigan of DecisionDeskHQ recently argued.
Kyle Kondik is a Political Analyst at the Center for Politics at the University of Virginia.
Geoffrey Skelley is the Associate Editor at the Center for Politics at the University of Virginia.
See Other Political Commentary by Kyle Kondik.
See Other Political Commentary by Geoffrey Skelley.
See Other Political Commentary.
Related Articles

Rasmussen Reports is a media company specializing in the collection, publication and distribution of public opinion information.
We conduct public opinion polls on a variety of topics to inform our audience on events in the news and other topics of interest. To ensure editorial control and independence, we pay for the polls ourselves and generate revenue through the sale of subscriptions, sponsorships, and advertising. Nightly polling on politics, business and lifestyle topics provides the content to update the Rasmussen Reports web site many times each day. If it's in the news, it's in our polls. Additionally, the data drives a daily update newsletter and various media outlets across the country.
Some information, including the Rasmussen Reports daily Presidential Tracking Poll and commentaries are available for free to the general public. Subscriptions are available for $4.95 a month or 34.95 a year that provide subscribers with exclusive access to more than 20 stories per week on upcoming elections, consumer confidence, and issues that affect us all. For those who are really into the numbers, Platinum Members can review demographic crosstabs and a full history of our data.
To learn more about our methodology, click here.