Leaning Into State Trends: The West Coast
A Commentary By J. Miles Coleman
Also some larger observations on how all the states have trended.
KEY POINTS FROM THIS ARTICLE
— The West Coast states have all been Democratic-leaning in nearly every recent presidential election.
— One exception was Oregon, which leaned slightly right of the nation in 2000, although it is now a solidly blue state.
— Looking nationally, Biden was the best-performing recent Democratic nominee in several Sun Belt states — many of which will be at the center of the 2024 campaign.
— Donald Trump, between his two elections as the GOP nominee, turned in the best recent Republican performances in half the states — this includes much of the electorally-critical Rust Belt.
Finishing up a series
Concluding our series exploring the relative leans of states in presidential elections since 2000, we’ll consider the four states that make up the West Coast. About a month ago, we started with the Northeast and Greater South. Then, we considered the Midwest and Interior West.
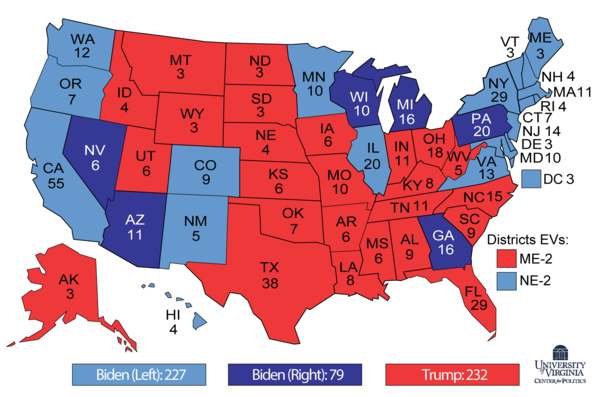
As a refresher, when we mention how a state “leans,” we are referring to its deviation from the national popular vote in a given election. In 2020, for example, Joe Biden carried 6 states by less than his popular vote margin — those 6 are the dark blue states shown in Map 1.
Map 1: 2020 presidential election showing the lean of Biden-won states
Additionally, for this series of articles, we’ve been using the regions of the country that Managing Editor Kyle Kondik established when looking at changes in the House over the last several decades.
Table 1 shows the lean of the West Coast states in presidential elections since 2000.
Table 1: 2000-2020 Democratic presidential lean of West Coast states
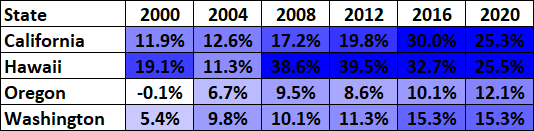
Note: The table considers the 2-party vote each year
Source: Dave Leip’s Atlas of U.S. Presidential Elections
We’ll start with the nation’s most populous state. California began the century roughly a dozen points left of the national popular vote — this was the case in the 2000 and 2004 elections. George W. Bush actually campaigned in the state because, as former Almanac of American Politics author Michael Barone surmised, the electoral vote-rich state seemed like it was just “too big to ignore.” But in 2008, Barack Obama improved on John Kerry’s performance in all 58 of the state’s counties, pushing it 17 points left of the nation. In 2012, California’s Democratic lean actually increased — as Obama’s national margin decreased by over 3 points, his margin in California only dropped from 24 points to 23 points.
California was at its most Democratic in the 2016 election, when it tracked 30 points more Democratic than the national popular vote. In several already-blue, voter-rich counties, Hillary Clinton improved by more than 10 points on Obama’s margins. As part of that overperformance, Clinton became the first Democrat to win traditionally Republican Orange County since Franklin Roosevelt in 1936. In 2020, California’s Democratic lean lessened; as Joe Biden performed a few points better than Clinton nationally, he carried California by a slightly smaller margin. While Biden matched, or ran ahead, of Clinton’s showing in college-educated white areas, he slid with minority voters. In Los Angeles County, for example, he fared 5 points worse than Clinton. But even in 2020, California was still more Democratic than it had been in the Obama era.
The only instance on Table 1 of a West Coast state leaning to the right of the national popular vote was Oregon’s vote in 2000. That year, thanks in large part to Green Party candidate Ralph Nader taking over 5% of the vote in the state (a little less than double his national share), Al Gore came within half a point of losing Oregon. As Table 1 only considers the two-party vote, Gore’s margin in Oregon was slightly right of his national edge. But by 2020, Oregon was a dozen points left of the national vote — essentially where California was at the start of the century.
Trends in places such as Washington County, the state’s second-largest county and directly west of Portland’s Multnomah County, illustrate Oregon’s shift well. In 2000, Gore carried Washington County by just a 49%-46% margin. Twenty years later, as it cast 70% more votes, Biden won it 66%-31%. Similarly, in the middle of the state, Deschutes County (Bend) gave Bush a 17-point margin in 2000, but as its vote total more than doubled by 2020, Biden carried it 53%-44%.
One other way to contextualize Oregon’s political movement over the past two decades: in the 2000 election, Oregon and Iowa’s two-party leans were nearly identical, as both were a tick or so right of the national vote. But by 2020, the pair had drifted 25 points apart — Oregon was 12 points left of the nation while Iowa was 13 points to its right.
Rounding out the Lower 48 states, Washington state was a somewhat marginal blue state in the 2000 election, but settled at 15 points left of the nation in the last two elections. Part of the explanation is Seattle’s King County, which casts nearly one-third of the state’s votes. Both Clinton and Biden carried the county by around 50 points, roughly doubling the 26-point margin that it gave Gore. Though Republicans have gained in parts of eastern and southwestern Washington, Democrats have more than offset those loses with gains in large counties like Clark (Vancouver) and Whatcom (Bellingham) — both are among the larger sources of votes in the state and flipped from Bush in 2000 to Biden in 2020.
Finally, Hawaii, though one of the bluest states in the nation, has followed a unique trajectory. The only election on Table 1 where the state was even remotely competitive was in 2004, when Bush was seeking a second term. Hawaii is often pegged as a “pro-incumbent” state, a claim that has some basis in historical returns: in 1980, it stuck with Jimmy Carter, and in 1992, as George H. W. Bush was ousted, he saw only limited slippage in Hawaii. In addition to that dynamic, Bush’s status as a wartime president in 2004 likely helped in this military-heavy state. The state actually saw some presidential politicking that year, as the Bush campaign dispatched Vice President Cheney to do an event with the state’s then-Republican governor, Linda Lingle. But four years later, with a native leading the ticket, Hawaii saw the biggest two-cycle shift of any state we’ve considered over this series: its Democratic lean jumped from 11 points to nearly 40 — and it got slightly more pronounced in 2012. Hawaii’s Democratic lean eroded once Obama was off the ballot, and it was down to voting “only” about 26 points left of the nation in 2020.
The strongest nominees over the years
Throughout this series, we’ve broken the nation down by regions looking at the lean of individual states. But to wrap things up, we’ll consider the overall picture.
With the relative leans of each state in mind, Map 2 shows the best-performing Democratic nominee since 2000 in each state. This doesn’t show which candidate did the best in the state in absolute terms, but rather the best-performing candidate in each state relative to the national vote over the last six presidential elections.
Map 2: Best-performing Democrat since 2000, relative to the national vote
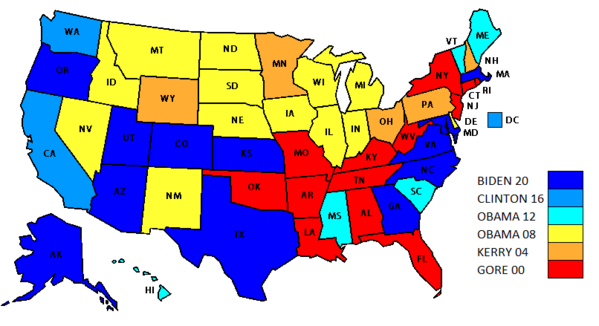
As pointed out earlier in the series, the states that leaned most Democratic in 2000 were a mix of traditionally Democratic states that would trend strongly toward Republicans in subsequent elections — such as Arkansas and West Virginia — and states with a large Jewish bloc: Gore’s selection of then-Connecticut Sen. Joe Lieberman as his running mate almost certainly helped on that front.
For 2004, John Kerry held up notably well in a few marginal outer Midwest states. But being a Midwesterner himself, Obama’s performance in 2008 represented the apex of Democratic strength in most states in the region. In 2008, Obama also made much of the Mountain West and Great Plains region look more Democratic than usual — 2008 was the last cycle where the Dakotas were within 20 points of the nation, for instance.
For 2012, Obama’s home state effect had clearly not waned in Hawaii and, in addition to parts of New England, he fared well in Mississippi and South Carolina, two states with sizeable Black populations, which speaks to the relative strength of Black turnout in that election (and which has waned a bit with Obama off the ballot).
Clinton’s strength was essentially limited to a few West Coast states — as mentioned earlier, she found the ideal balance of minorities and white suburbanites in California — and Washington, DC.
Finally, Biden’s 2020 performance represented the best showing for a Democratic nominee in a dozen states. Biden’s coalition included several populous, Sun Belt states — such as Texas, Georgia, and North Carolina — where his gains with college-educated suburban voters offset any slippage with minority voters.
Map 3 is similar but considers Republican performances since 2000.
Map 3: Best-performing Republican since 2000, relative to the national vote
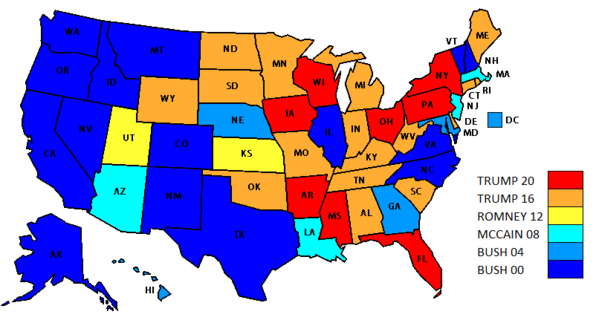
Something that immediately stands out about Map 2 is that many of the same Sun Belt states where Biden was the best-performing Democrat also had Bush in 2000 as the best-performing Republican — Colorado, Texas, and North Carolina are examples. In 2000, Bush ran well along the West Coast, although many of those states had high third-party voting (as we discussed earlier with Oregon).
For 2004 and 2008, Bush and John McCain each claimed a few states in disparate regions of the country, often for idiosyncratic reasons — Arizona leaned most Republican for its home state senator in 2008, for example. Not surprisingly, Mitt Romney, a Mormon, turned in the best performance in Utah, but also had notable strength in Kansas — in addition to benefitting from the reddening of rural Kansas, he ran well in Johnson County, the state’s most populous county (it would go on to vote for Biden by 8 points in 2020).
Then came Donald Trump: In either 2016 or 2020, he was the best-performing Republican in 25 states, a number higher than the other two-time nominees we considered — Bush combined to claim 19 states between his runs while Obama was the strongest Democrat in 18 states. As we discussed earlier in the series, Trump’s strength in the Great Lakes states, specifically Pennsylvania and Wisconsin, stands out — both states gave him a relatively stronger showing in 2020, even though they flipped against him.
Conclusion
Though our primary cast of “red” and “blue” states was mostly cemented in the 2000 election, there has been a considerable amount of electoral churn among the states since then. Many of the Sun Belt states that started out the millennium by giving George W. Bush strong margins were among the states where Biden turned in the best relative Democratic performance. Similarly, while the Rust Belt states of Ohio and Pennsylvania turned in relatively strong performances for John Kerry in 2004, both had become Republican-leaning states by 2016 — and those leans increased in 2020, even as Pennsylvania remains hotly contested while Ohio does not.
J. Miles Coleman is an elections analyst for Decision Desk HQ and a political cartographer. Follow him on Twitter @jmilescoleman.
See Other Political Commentary by J. Miles Coleman.
See Other Political Commentary.
Views expressed in this column are those of the author, not those of Rasmussen Reports. Comments about this content should be directed to the author or syndicate.
Related Articles


Rasmussen Reports is a media company specializing in the collection, publication and distribution of public opinion information.
We conduct public opinion polls on a variety of topics to inform our audience on events in the news and other topics of interest. To ensure editorial control and independence, we pay for the polls ourselves and generate revenue through the sale of subscriptions, sponsorships, and advertising. Nightly polling on politics, business and lifestyle topics provides the content to update the Rasmussen Reports web site many times each day. If it's in the news, it's in our polls. Additionally, the data drives a daily update newsletter and various media outlets across the country.
Some information, including the Rasmussen Reports daily Presidential Tracking Poll and commentaries are available for free to the general public. Subscriptions are available for $4.95 a month or 34.95 a year that provide subscribers with exclusive access to more than 20 stories per week on upcoming elections, consumer confidence, and issues that affect us all. For those who are really into the numbers, Platinum Members can review demographic crosstabs and a full history of our data.
To learn more about our methodology, click here.