Generic Ballot Model Gives Democrats Early Advantage in Battle for Control of House
A Commentary By Alan I. Abramowitz
Results of recent special elections have fueled speculation about whether Democrats have a realistic chance to regain control of the U.S. House of Representatives in the 2018 midterm elections. Although Republican candidates have won recent special elections for seats vacated by President Donald Trump’s Cabinet appointees in Georgia, Kansas, Montana, and South Carolina, the GOP victory margins in all four contests have been much smaller than those for the former Republican incumbents in 2016.
While Democrats have pointed to the substantial vote swing in these four special elections as a sign that a wave election may be coming in 2018, Republicans have emphasized the failure of Democrats to actually capture any of these Republican seats, especially the hotly contested seat vacated by Secretary of Health and Human Services Tom Price in Georgia’s Sixth Congressional District, as an indicator that they should have a good chance to hold onto their majority in the midterm elections.
In reality, the results of a handful of special elections probably provide little information about what to expect next fall. Fortunately, there is a better way of predicting the outcomes of midterm elections based on something called the “generic ballot.” This is a question included in numerous national polls asking voters about which party they prefer in the upcoming House elections. It turns out that the results of this generic ballot test can be used to accurately forecast the House seat swing in midterm elections.
The president’s party almost always loses House seats in midterm elections — this has been true in 16 of 18 midterm elections since World War II. However, these elections have produced a wide range of outcomes, from a gain of eight seats in 2002 to a loss of 63 seats in 2010. So what explains the variability in midterm results and what can we expect in 2018?
In addition to the results of the generic ballot test in early September of the election year, two other predictors go a long way toward explaining seat swing in midterm elections: which party controls the White House and the number of seats held by each party prior to the election. The president’s party matters because, regardless of whatever else is going on, voters tend to turn against the party in the White House in midterm elections. And the number of seats each party holds prior to the election matters because, all else being equal, the more seats the president’s party has to defend, the more seats it is likely to lose.
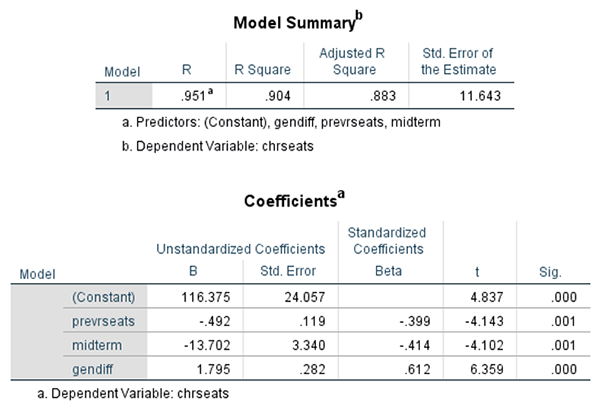
Table 1: Regression analysis of seat change in midterm House elections, 1946-2014
Source: Data compiled by author.
Table 1 displays the results of a regression analysis of Republican seat swing in midterm House elections between 1946 and 2014. All three predictors are highly statistically significant and the model explains about 90% of the variation in seat swing across these 18 elections. The coefficient of -.492 for previous Republican seats reflects the impact of exposure to risk — for every additional seat Republicans hold going into a midterm election, they can expect to lose close to half of a seat.
The coefficient of -13.7 for the midterm variable means that after controlling for the other predictors in the model, having a Republican in the White House costs the GOP an average of close to 14 seats. This coefficient also means that having a Democrat in the White House would be expected to result in a Republican gain of almost 14 seats in a midterm election.
Finally, the coefficient of 1.795 for the generic ballot variable means that for every additional one point advantage Democrats enjoy on the generic ballot in the Gallup Poll in early September of the midterm year, Republicans can expect to lose about 1.8 additional seats in the House.
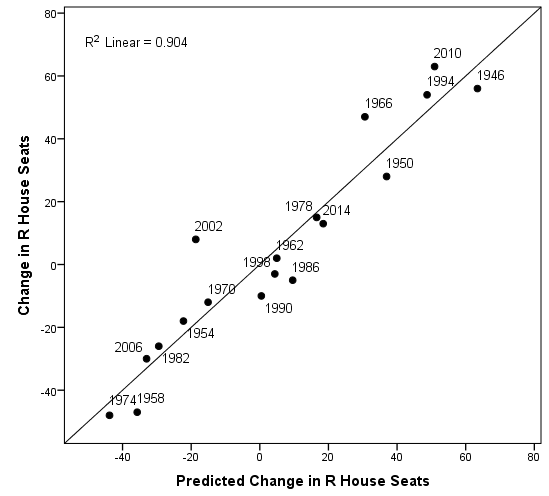
Figure 1: Scatterplot of change in Republican House seats by predicted change in Republican House seats
Source: Data compiled by author.
Figure 1 displays a scatterplot of the relationship between predicted and actual seat swing in House midterm elections based on the generic ballot model. The results show that the model does an excellent job of predicting House seat swing. Most of the points are very close to the prediction line. However, a few elections, especially the highly unusual post-September 11 midterm of 2002, are farther off the mark. It’s worth noting that adding presidential approval or economic indicators to the model has no effect once you include the generic ballot. Whatever effect these have seems to be captured by the generic ballot.
It is especially encouraging to note that the model’s forecast for the 2014 midterm election, a Republican gain of 18 seats, was very close to the actual GOP pickup of 13 seats. This is significant because the 2014 midterm election occurred after the post-2010 round of redistricting in which Republicans were able to redraw House district lines in many states. Despite this, the model actually slightly overestimated Republican seat gains in 2014. There is little reason to believe, therefore, that the model’s predictions for 2018 will be thrown off by the effects of post-2010 redistricting.
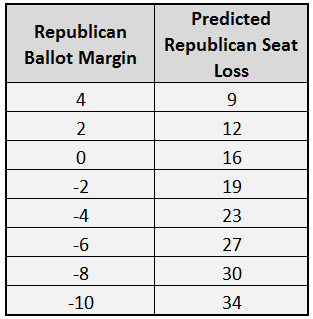
Based on the results in Table 1, we can calculate conditional forecasts of seat swing in the 2018 midterm election, depending on the results of the generic ballot test in early September of next year. The other two predictors, presidential party and Republican House seats, are already set, though additional House special elections could subtly alter the House’s party makeup before November 2018 (for instance, UT-3 will have a special election to replace Republican ex-Rep. Jason Chaffetz in November 2017, though that seat is ruby red). The conditional forecasts are displayed in Table 2.
Table 2: Predicted change in Republican House seats by generic ballot polling
Source: Data compiled by author.
The predictions in Table 2 show that Democrats will need a lead of at least five points on the generic ballot in early September of 2018 in order to gain the 24 seats that they need to take control of the House. Based on the results of recent national polls, that number appears well within reach. On average, based on calculations from FiveThirtyEight, Democrats hold an adjusted lead of close to seven points on the generic ballot, mirroring that of the RealClearPolitics average. A lead of that magnitude would result in a predicted Democratic gain of close to 30 House seats, more than enough to regain control of the chamber. Given the model’s standard error of 11.6 seats, that forecast would give Democrats about a two-thirds chance of regaining control of the House.
So keep an eye on the generic ballot polling for 2018. If Democrats maintain a lead in the high single digits, that probably indicates they will have a decent chance to win the House or at least significantly cut into the Republicans’ majority. A bigger Democratic lead, into the double digits, would make a takeover more likely, while a smaller Democratic lead — or a GOP advantage — would put Republicans in a clearer position to preserve their majority.
Courtesy of Larry Sabato's Crystal Ball
See Other Commentary by Dr. Alan Abramowitz
Related Articles

Rasmussen Reports is a media company specializing in the collection, publication and distribution of public opinion information.
We conduct public opinion polls on a variety of topics to inform our audience on events in the news and other topics of interest. To ensure editorial control and independence, we pay for the polls ourselves and generate revenue through the sale of subscriptions, sponsorships, and advertising. Nightly polling on politics, business and lifestyle topics provides the content to update the Rasmussen Reports web site many times each day. If it's in the news, it's in our polls. Additionally, the data drives a daily update newsletter and various media outlets across the country.
Some information, including the Rasmussen Reports daily Presidential Tracking Poll and commentaries are available for free to the general public. Subscriptions are available for $4.95 a month or 34.95 a year that provide subscribers with exclusive access to more than 20 stories per week on upcoming elections, consumer confidence, and issues that affect us all. For those who are really into the numbers, Platinum Members can review demographic crosstabs and a full history of our data.
To learn more about our methodology, click here.