Generic Ballot Model Gives Democrats Strong Chance to Take Back House in 2026
A Commentary By Alan I. Abramowitz
|
Dear Readers: Every midterm, Senior Columnist Alan Abramowitz releases a congressional forecasting model based on House generic ballot polling and the number of seats that the presidential party is defending in the House and the Senate. This cycle’s iteration of the model, which performed quite well in 2022, is positive for Democrats in both chambers. However, and for reasons that Alan discusses below, the model is much more bullish on Democrats in the Senate than a seat-by-seat analysis would suggest. That helps explain why the Crystal Ball’s official House ratings are more reflective of the model than our Senate ratings are. — The Editors |
KEY POINTS FROM THIS ARTICLE
— Just a couple of basic factors—House generic ballot polling and the number of seats the presidential party is defending—do a decent job of predicting midterm congressional election results.
— This model suggests Democrats would be favored to win the House majority even without a substantial lead in House generic ballot polling.
— The model also is bullish on Democrats in the Senate, but we urge caution on the findings, as the Senate model is historically less predictive than the House model and does not take into account this cycle’s specific Senate map.
Introduction
All 435 U.S. House seats and 35 U.S. Senate seats will be up for grabs in the 2026 midterm elections. While control of the presidency is not at stake, midterm elections can have important consequences for the occupant of the Oval Office. This is likely to be an especially significant midterm because it will be the first opportunity for voters across the entire nation to express their views on the drastic changes in the role of the executive branch and in many government policies during the first two years of the second Trump administration. The results of the 2026 midterm elections will go a long way toward determining whether Congress will continue to largely support the president’s agenda or will act as a check on the power of the White House.
In this article, I present a simple model for forecasting seat change in midterm elections based on the generic ballot question. The model has a strong track record of accurate forecasts. In 2022, while many other forecasters were predicting large Democratic losses in the midterm election, the generic ballot model accurately predicted more modest Democratic losses in the House and little change in the party balance in the Senate. For 2026, the model gives Democrats a strong chance of winning a majority of seats in the House and a chance of gaining enough seats to take back control of the Senate if the national political environment is highly favorable.
The Generic Ballot Model
It is well known that midterm elections generally result in losses for the party in the White House. Since the end of World War II, the president’s party has lost House seats in 18 of 20 midterm elections with an average loss of roughly 25 seats. However, while losses are typical, outcomes have ranged from a loss of 64 seats for Democrats in 2010 during Barack Obama’s first term to a gain of 8 seats for Republicans in 2002 during George W. Bush’s first term. That unusual result came in the aftermath of the Sept. 11 attacks on the United States and while President Bush was continuing to enjoy exceptionally high approval ratings.
The pattern of presidential losses is not quite as regular in midterm Senate elections, with the president’s party experiencing losses in 13 of 20 midterm elections with an average loss of roughly 3.5 seats. Senate outcomes have ranged from a loss of 13 seats for Republicans in 1958 during Dwight Eisenhower’s second term to a gain of 4 seats for Democrats in 1962 during John F. Kennedy’s first term.
Republicans currently hold 220 of 435 seats in the House and 53 of 100 seats in the Senate, so a loss of as few as three seats in the House and four seats in the Senate would cause Republicans to lose their majority for the final two years of Trump’s presidency.
The generic ballot model provides a simple and accurate method of assessing the chances of Democrats taking back control of either chamber in the 2026 midterm election. The model uses only two predictors—the number of seats held by the president’s party that are up for election and the average margin of the president’s party in generic ballot polling prior to the election.
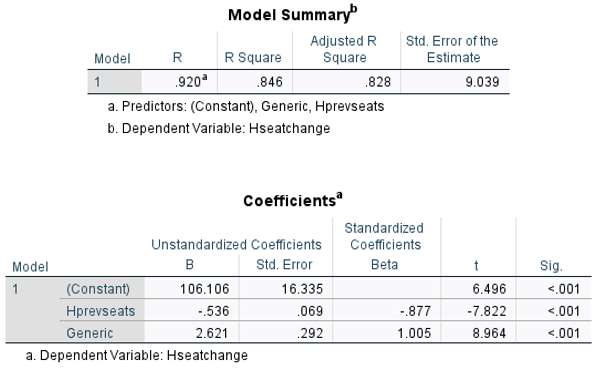
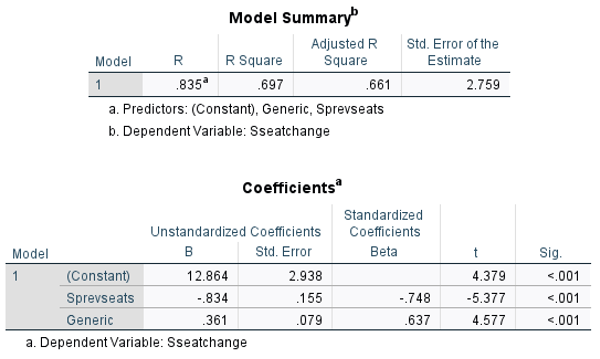
Tables 1 and 2 display estimated coefficients for the predictors in the generic ballot model based on data for all 20 midterm elections since World War II. The results show that the model explains more than 80% of the variance in the outcomes of House elections and a little more than two-thirds of the variance in the outcomes of Senate elections.
It is not surprising that the model is considerably more accurate for House elections than for Senate elections. All 435 House seats are at stake in every midterm election, while only about a third of Senate seats are at stake. The outcomes of midterm Senate elections therefore depend on which states have Senate contests each year. Factors peculiar to each class of Senate seats such as state partisanship and the strength of individual candidates can tilt the overall outcome. This sometimes leads to divergent outcomes in the House compared to the Senate, like we saw in the past two midterms, 2018 and 2022. While the non-presidential party captured the House majority from the presidential party in both elections, the presidential party netted Senate seats at the same time.
Table 1: Results of regression analyses of House change in midterm elections, 1946-2022
Source: Data compiled by author
Table 2: Results of regression analyses of Senate change in midterm elections, 1946-2022
Source: Data compiled by author
The results of the regression analyses show that both predictors have significant effects on the outcomes of House and Senate midterm elections. The stronger the performance of the president’s party on the generic ballot, the fewer seats the party can expect to lose. A shift of 1 point in the average generic ballot margin is associated with a swing of about 2.6 House seats and 0.36 Senate seats. At the same time, the more seats the president’s party has at stake in each chamber, the more seats it can expect to lose. The effect of seat exposure is especially striking for Senate elections. For each additional seat that the president’s party has at stake, it can expect to lose an additional .54 seats in the House and .83 seats in the Senate.
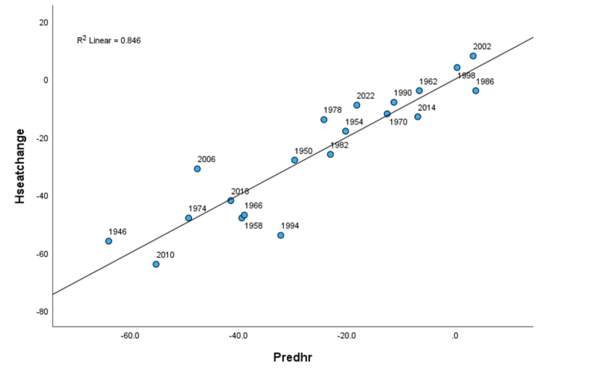
Figure 1: Scatterplot of seat change by predicted presidential party House seat change in midterm elections, 1946-2022
Notes: X-axis shows predicted change, Y-axis shows actual change in election. Click on image to see larger version.
Source: Data compiled by author
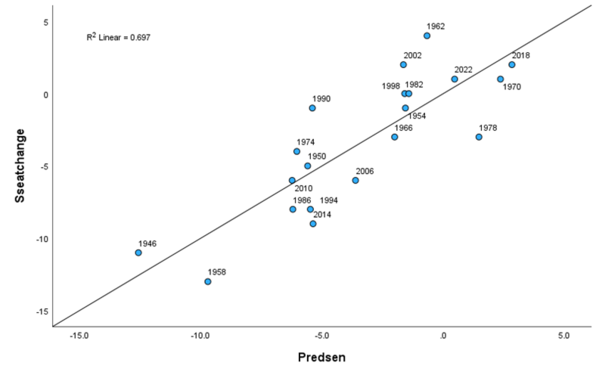
Figure 2: Scatterplot of seat change by predicted presidential party Senate seat change in midterm elections, 1946-2022
Notes: X-axis shows predicted change, Y-axis shows actual change in election. Click on image to see larger version.
Source: Data compiled by author
Figures 1 and 2 display a scatterplot of the relationship between predicted and actual seat change in, respectively, House and Senate midterm elections since World War II. This allows us to assess the accuracy of the generic ballot model over these 20 elections. A quick look at the two graphs shows very clearly that the model performs better for House elections than for Senate elections. Out of 20 House predictions, 16 fell within 10 seats of the actual results, although there are a few large misses—notably a 22-seat underestimate of Democratic losses in the 1994 midterm and a 17-seat overestimate of Republican losses in the 2006 midterm.
Meanwhile, 11 out of 20 Senate predictions fall within two seats of the actual results. However, the model misses badly in 1962, when it predicts a one-seat loss for Democrats when the actual result was a four-seat gain; in 1978, when it predicts a one-seat gain for Democrats when the actual result was a three-seat loss; and in 1990, when it predicts a five-seat loss for Republicans when the actual result was only a one-seat loss.
Many forecasters expected significant Democratic losses in 2022 based mainly on President Biden’s relatively low approval rating, which was averaging around 40%. The widely followed RealClearPolitics website projected that Republicans would gain around 30 seats in the House and three seats in the Senate. Some respected political science forecasters predicted even larger Republican gains in the House. In contrast, this generic ballot model predicted a Democratic loss of only 18 seats in the House and a gain of one seat in the Senate. That turned out to be closer to the actual outcome, which was a loss of nine seats in the House and a gain of one seat in the Senate.
Forecasting the 2026 midterm election
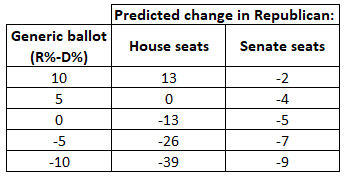
Table 3 presents conditional forecasts of seat swing in the 2026 House and Senate elections based on the results of the regression analyses displayed in Tables 1 and 2. The results indicate that even in a neutral political environment, one in which the two parties are tied on the generic ballot, Republicans would be expected to lose about 13 seats in the House and about 5 seats in the Senate. Losses of that magnitude would give Democrats control of both chambers in the next Congress. As of April 23, 2025, the generic ballot average, according to RealClearPolitics, favors Democrats by 1.5 points—very close to a tie.
Table 3: Conditional forecasts of House and Senate seat change in 2026 midterm election
Source: Data compiled by author
While the generic ballot model’s current prediction of a Democratic gain of more than a dozen seats in the House probably will not surprise most observers of American politics, the model’s forecast of a Democratic gain of five Senate seats—one more than Democrats would need to regain control of the Senate—undoubtedly will. The main reason for the expectation of a significant Democratic gain in the Senate is the fact that Republicans will be defending 22 of the 35 Senate seats at stake in the 2026 midterm election, and seat exposure is a strong predictor of seat swing in the model. However, there are reasons to be skeptical about the model’s Senate forecast.
Over time, Senate elections, like House elections, have become increasingly aligned with presidential voting patterns. In 2022, for example, the correlation between the Republican share of the Senate vote and the Republican share of the 2020 presidential vote was a near-perfect .96, and 34 of 35 states voted for a Senate candidate from the party that carried the state in the 2020 presidential election. The only exception was Wisconsin, which backed Democrat Joe Biden for president in 2020 and then reelected Republican Sen. Ron Johnson two years later, both by very narrow margins.
The challenge for Democrats in 2026 is, while 22 Republican seats will be up for grabs compared with only 13 Democratic seats, only one of the states with a Republican Senator—Maine—voted for Kamala Harris in the 2024 presidential election, while two states with Democratic senators—Georgia and Michigan—voted for Donald Trump in 2024. Moreover, only one other state with a Republican senator—North Carolina—voted for Trump by less than 5 points. The next likeliest states for Democratic gains in 2026 would be Ohio, Iowa, Texas, and Florida, all of which voted for Trump by margins of between 10 and 15 points.
Given the close connection between Senate and presidential voting patterns in recent elections, these results suggest that the national political environment would probably have to be tilted significantly in favor of Democrats for Republicans to suffer a net loss of four or more Senate seats in 2026. The current 1.5-point Democratic advantage on the generic ballot probably would not be enough. It would probably take a Democratic lead of close to 10 points to produce a swing of that magnitude.
Alan I. Abramowitz is the Alben W. Barkley Professor Emeritus of Political Science at Emory University and a senior columnist with Sabato’s Crystal Ball. His latest book, The Great Alignment: Race, Party Transformation, and the Rise of Donald Trump, was released in 2018 by Yale University Press. |
See Other Commentary by Dr. Alan Abramowitz.
See Other Political Commentary.
Views expressed in this column are those of the author, not those of Rasmussen Reports. Comments about this content should be directed to the author or syndicate.
Rasmussen Reports is a media company specializing in the collection, publication and distribution of public opinion information.
We conduct public opinion polls on a variety of topics to inform our audience on events in the news and other topics of interest. To ensure editorial control and independence, we pay for the polls ourselves and generate revenue through the sale of subscriptions, sponsorships, and advertising. Nightly polling on politics, business and lifestyle topics provides the content to update the Rasmussen Reports web site many times each day. If it's in the news, it's in our polls. Additionally, the data drives a daily update newsletter and various media outlets across the country.
Some information, including the Rasmussen Reports daily Presidential Tracking Poll and commentaries are available for free to the general public. Subscriptions are available for $4.95 a month or 34.95 a year that provide subscribers with exclusive access to more than 20 stories per week on upcoming elections, consumer confidence, and issues that affect us all. For those who are really into the numbers, Platinum Members can review demographic crosstabs and a full history of our data.
To learn more about our methodology, click here.
