Did Russian Interference Affect the 2016 Election Results?
A Commentary By Alan I. Abramowitz
KEY POINTS FROM THIS ARTICLE
— Special Counsel Robert Mueller’s recent testimony was a reminder that Russia attempted to influence the outcome of the 2016 election and very well may try to do so again in 2020.
— This begs the question: Is there any evidence that Russian interference may have impacted the results, particularly in key states?
— The following analysis suggests that the 2016 results can be explained almost entirely based on the political and demographic characteristics of those states. So from that standpoint, the answer seems to be no.
What explains the 2016 results?
Special Counsel Robert Mueller’s recent testimony before the House Judiciary and Intelligence Committees, and the Mueller Report itself, make it very clear that the Russian government made a major effort to help Donald Trump win the 2016 U.S. presidential election. What the Mueller Report did not determine, however, was whether that effort was successful. In this article, I try to answer that question by examining whether there are any indications from the 2016 results that Russian interference efforts may have played a clear role in the outcome. One such indication would be if Trump did better in key swing states than a range of demographic, partisan, and historical factors would have predicted.
We know from the Mueller Report that Trump campaign manager Paul Manafort briefed a longtime associate who the FBI believes had ties with Russian intelligence about campaign strategy and, according to Manafort deputy Rick Gates, discussed decisive battleground states such as Michigan, Pennsylvania, and Wisconsin. Manafort also directed Gates to share internal polling data, which may have influenced Russian operations.
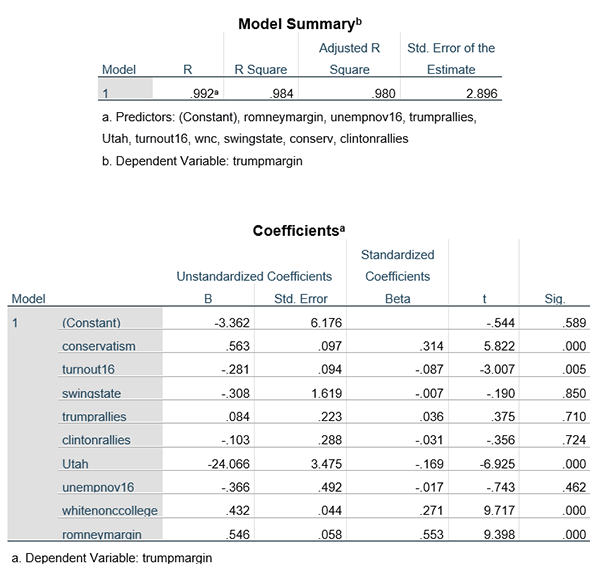
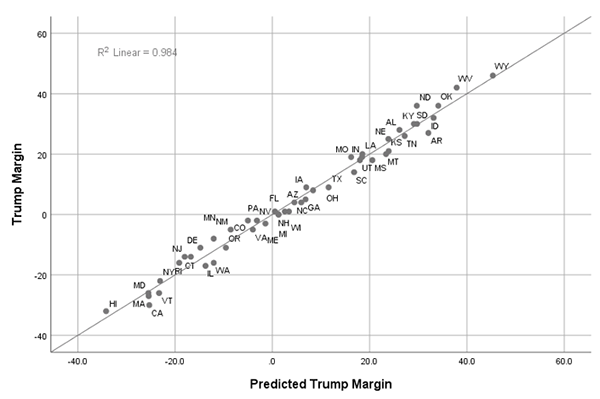
In order to address the question of whether the Russian interference effort worked, I conducted a multiple regression analysis of the election results at the state level. The dependent variable in this analysis was the Trump margin. My independent variables were the 2012 Mitt Romney margin, to control for traditional state partisanship, state ideology measured by the Gallup Poll (the percentage of conservatives minus the percentage of liberals), the percentage of a state’s population made up of whites without college degrees, the estimated turnout of eligible voters in the state, the state unemployment rate in November 2016 (to measure economic conditions), the number of Trump campaign rallies in the state, the number of Clinton campaign rallies in the state, a dummy variable for the state of Utah to control for the large vote share won by an independent conservative Mormon candidate from that state, Evan McMullin, and, finally, a dummy variable for swing states. The swing states included Arizona, Colorado, Florida, Iowa, Minnesota, Nevada, New Hampshire, Ohio, and Virginia, in addition to Michigan, Pennsylvania, and Wisconsin. The results of the regression analysis are displayed in Table 1 along with a scatterplot of the actual and predicted results in Figure 1.
Table 1: Results of regression analysis of Trump margin in the states
Source: Data compiled by author.
Figure 1: Scatterplot of actual Trump margin by predicted Trump margin in the states
Note: Alaska and District of Columbia omitted due to lack of state ideology data.
Source: Data compiled by author.
The regression equation proved to be extremely successful in predicting the election results, explaining a remarkable 98% of the variance in Trump vote margin in the states. Several of the independent variables had very powerful effects including the 2012 Romney margin, state ideology, and the percentage of non-college whites in the state. Even after controlling for traditional state partisanship and ideology, the size of the non-college white population in a state was a strong predictor of support for Donald Trump. The data in Table 1 also show that Evan McMullin’s candidacy dramatically reduced Trump’s vote share in Utah — although Trump still carried the state easily. In addition, the results show that voter turnout had a modest but highly significant effect on the results — the higher the turnout in a state, the lower the vote share for Trump. These results seem to confirm the conventional wisdom that higher voter turnout generally helps Democrats.
In addition to showing what mattered in explaining the results of the 2016 presidential election in the states, the data in Table 1 also show what did not matter. Economic conditions at the state level, at least as measured by state unemployment, did not matter. The number of campaign rallies held by the candidates in a state did not matter. Finally, and perhaps most importantly from the standpoint of estimating the impact of Russian interference, Donald Trump did no better than expected in the swing states. The coefficient for the swing state dummy variable is extremely small and in the wrong direction: Trump actually did slightly worse than expected in the swing states based on their other characteristics.
Table 2: Predicted and actual Trump margin in key swing states
Source: Data compiled by author.
This can also be seen in Table 2, which compares the actual and predicted results in the three swing states that ultimately decided the outcome of the election: Michigan, Pennsylvania, and Wisconsin. What is most striking about the data in this table is that Donald Trump actually slightly under-performed the model’s predictions in all three states. He did about one point worse than predicted in Michigan, about two points worse than predicted in Pennsylvania, and between two and three points worse than predicted in Wisconsin. There is no evidence here that Russian interference, to the extent that it occurred, did anything to help Trump in these three states.
Conclusions
I find no evidence that Russian attempts to target voters in key swing states had any effect on the election results in those states. Instead, the results were almost totally predictable based on the political and demographic characteristics of those states, especially their past voting tendencies, ideological leanings, and demographics. Of course, that doesn’t mean that the Russians weren’t trying to influence the results or that they might not succeed in the future. Nor does it speak to Russian efforts to hack into U.S. voting systems and potentially alter voter registration data or even election results themselves.
There are plenty of grounds for real concern here. Indeed, the Electoral College system used to choose the president almost invites efforts to interfere in the election. Whereas trying to affect the national popular vote results would probably be prohibitively expensive, efforts to target a few key swing states could be much more cost-effective and harder to detect. As a result, there is little doubt that these efforts will continue in 2020 and beyond, especially if we have a president who seems to be inviting them.
Alan I. Abramowitz is the Alben W. Barkley Professor of Political Science at Emory University and a senior columnist with Sabato’s Crystal Ball. His latest book, The Great Alignment: Race, Party Transformation, and the Rise of Donald Trump, was released last year by Yale University Press.
See Other Commentary by Dr. Alan Abramowitz.
See Other Political Commentary.
This article is reprinted from Sabato's Crystal Ball.
Views expressed in this column are those of the author, not those of Rasmussen Reports. Comments about this content should be directed to the author or syndicate.
Rasmussen Reports is a media company specializing in the collection, publication and distribution of public opinion information.
We conduct public opinion polls on a variety of topics to inform our audience on events in the news and other topics of interest. To ensure editorial control and independence, we pay for the polls ourselves and generate revenue through the sale of subscriptions, sponsorships, and advertising. Nightly polling on politics, business and lifestyle topics provides the content to update the Rasmussen Reports web site many times each day. If it's in the news, it's in our polls. Additionally, the data drives a daily update newsletter and various media outlets across the country.
Some information, including the Rasmussen Reports daily Presidential Tracking Poll and commentaries are available for free to the general public. Subscriptions are available for $4.95 a month or 34.95 a year that provide subscribers with exclusive access to more than 20 stories per week on upcoming elections, consumer confidence, and issues that affect us all. For those who are really into the numbers, Platinum Members can review demographic crosstabs and a full history of our data.
To learn more about our methodology, click here.


