Assessing Trump’s Chances: Forecasting the 2020 Presidential Election
A Commentary By Alan I. Abramowitz
KEY POINTS FROM THIS ARTICLE
— The author’s “time for change” presidential forecasting model has a successful track record of projecting presidential elections. In 2016, it showed Donald Trump as a favorite to win the national popular vote. Though Trump ultimately lost the popular vote while winning the Electoral College, the model presented an early indication that Trump was more than capable of winning the 2016 election.
— A new model uses post-World War II presidential elections featuring incumbents to try to project Trump’s chances in 2020 based on his approval rating and the state of the economy.
— Based on Trump’s current average approval rating in national polls and modest economic growth, the model suggests an extremely close 2020 result in the Electoral College.
— The model’s final projection will come out next summer.
Forecasting Trump’s Electoral College showing
There are still 10 months to go until the first ballots will be cast in the 2020 presidential caucuses and primaries. The identity of the Democratic nominee, in all likelihood, will not be known for more than a year. Nevertheless, it is not too early to begin speculating about Donald Trump’s chances of winning a second term in the White House. That is because when an incumbent is running for reelection, the presidential election is largely a referendum on that incumbent’s performance. The challenger’s characteristics and the general election campaign itself matter only at the margins.
In this article, I present the results of a modified version of the “time for change” forecasting model that I have used to correctly predict the winner of the national popular vote in every presidential election between 1992 and 2012. And while the model failed to predict Hillary Clinton’s narrow popular vote victory in 2016, I noted at the time that Trump might well fall short of his predicted vote given his extraordinary weaknesses as a candidate. As it was, the model predicted Trump to win the national two-party popular vote by three points, but Clinton won it by two points.
The time for change model predicts the outcomes of presidential elections based on three factors: the incumbent president’s net approval rating in late June or early July, the change in annualized real GDP in the second quarter of the election year, and a dummy variable based on whether the president’s party has held the White House for only one term or for more than one term. However, the model presented here differs in two crucial respects from the traditional time for change model. First, the model attempts to predict the electoral vote, not the popular vote. The reasons for this change should be obvious: the winner of the election is determined by the electoral vote and in two of the past five elections, 2000 and 2016, the winner of the popular vote lost the electoral vote.
The second difference between this model and the earlier time for change model is that this one is based only on the 11 presidential elections since World War II in which an incumbent was running. That is because an examination of the data on all 18 presidential elections since World War II indicates that elections with a running incumbent are different — their outcomes are much more predictable based on the incumbent’s approval rating in the middle of the election year and the growth rate of the economy during the second quarter of the year. Thus, the correlations between real GDP growth and incumbent electoral vote is .48 for the seven open seat elections vs. .73 for the 11 incumbent elections. Likewise, the correlation between late June presidential approval and incumbent electoral vote is .56 for the seven open seat elections vs. .82 for the 11 incumbent elections.
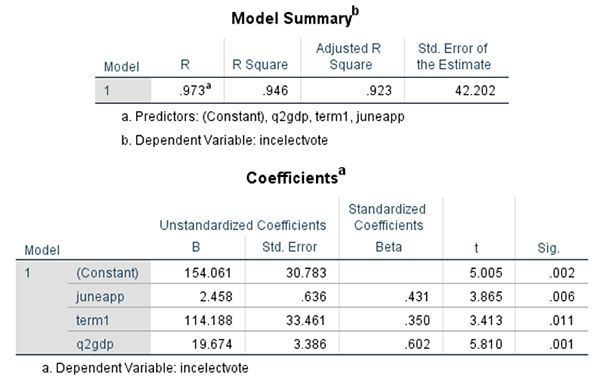
Table 1: Estimates for Incumbent Electoral Vote Model
Source: Data compiled by author
Table 1 presents the estimates for the ordinary least squares regression analysis of incumbent electoral vote on late June presidential approval, second quarter GDP change, and the time for change dummy variable for the 11 incumbent elections since World War II. The results show that the model does an excellent job of predicting the electoral vote for the incumbent, explaining over 90% of the variance in election results. All three predictors have very strong and highly significant effects, despite the small number of elections used in the analysis. The estimated coefficients indicate that an increase of one point in the incumbent’s net approval rating is associated with an increase of almost 2.5 electoral votes. Likewise, every one point in real GDP growth is associated with an increase of almost 20 electoral votes. Finally, the results in Table 1 show that first-term incumbents enjoy a substantial predicted advantage of just over 114 electoral votes over incumbents running for a second or later term in the White House for their party.
Table 2: Predicted and actual electoral vote for incumbents in presidential elections, 1948-2012
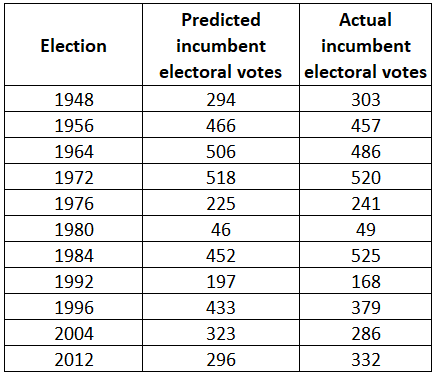
Note: President Gerald Ford’s formal electoral vote count in 1976 was 240 because of a rogue elector in Washington state, but for the purposes of this article we are disregarding the rogue elector and listing his total as 241, because that is what he earned from the election results.
Source: Data compiled by author
Table 2 displays the predictions generated by the model for the 11 incumbent elections since World War II along with the actual results of these elections. The model predicts the correct winner of all 11 elections. The margin of error for these predictions ranges from two electoral votes in 1972 to 73 electoral votes in 1984 with an average error of 26 electoral votes.
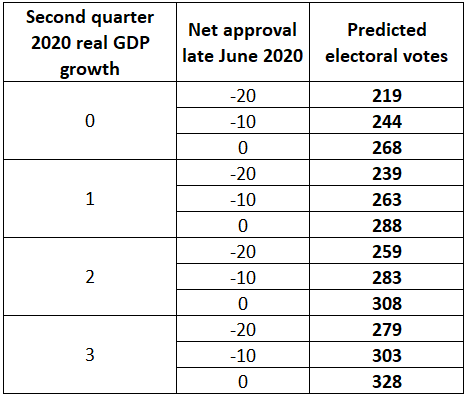
Based on this impressive performance, we can examine the range of likely forecasts of the electoral vote in the 2020 presidential election, assuming that Donald Trump is the Republican nominee. These conditional forecasts are presented in Table 3 based on a range of possible scenarios for real GDP growth and presidential approval. Most economic forecasts for 2020 have GDP growth falling in the 1% to 2% range, despite the administration’s official forecast of much higher growth. I have included growth rates ranging from zero to 3%. And since President Trump’s net approval rating has never reached the neutral point in any polling average or any reputable national poll since his first days in office, I have set the range for the approval rating variable from -20 to zero. However, readers can easily plug in their own preferred values by using the weights generated by the regression model in Table 1.
Table 3: Predicted electoral vote for Donald Trump by second quarter GDP change and late June net approval rating
Source: Data compiled by author
The results in Table 3 show a wide range of potential outcomes, from near certain defeat for the incumbent if the economy stalls out and his approval rating falls far below the neutral point, as it has from time to time, to near certain victory if the economy grows faster than expected and his approval rating rises to the neutral point, where it has essentially never been in his first two-plus years in office.
The most plausible prediction at this point, however, is for a very close contest. Given a net approval rating of -10, approximately where Trump’s approval rating has been stuck for most of the past year, and real GDP growth of between 1% to 2%, in line with most recent economic forecasts, the model predicts that he would receive between 263 and 283 electoral votes. Of course, it takes 270 electoral votes to win.
There are a few caveats that need to be mentioned at this point. First, this model is based on a very limited number of elections. Despite its apparent accuracy, therefore, any predictions should be taken with a grain of salt. Second, it is not certain that President Trump will receive the same first-term boost as his predecessors. This first-term boost is his most significant advantage heading into the 2020 election. However, the fact that his performance fell short of that predicted by the model in 2016 suggests that his highly unconventional style and abrasive personality could result in a similar underperformance in 2020.
Finally, it needs to be mentioned that none of the 11 elections included in this analysis resulted in an Electoral College misfire. In all 11 incumbent elections since World War II, the winner of the popular vote also won the electoral vote. Indeed, the correlation between the two is a very robust .95. These results suggest that a misfire of the magnitude that allowed Trump to win an Electoral College majority while losing the popular vote by more than two percentage points, is not very likely. But it is possible and in such a case, our model’s prediction may miss the mark by a larger than usual margin.
Alan I. Abramowitz is the Alben W. Barkley Professor of Political Science at Emory University and a senior columnist with Sabato’s Crystal Ball. His new book, The Great Alignment: Race, Party Transformation, and the Rise of Donald Trump, was released last year by Yale University Press.
See Other Commentary by Dr. Alan Abramowitz.
Related Articles

Rasmussen Reports is a media company specializing in the collection, publication and distribution of public opinion information.
We conduct public opinion polls on a variety of topics to inform our audience on events in the news and other topics of interest. To ensure editorial control and independence, we pay for the polls ourselves and generate revenue through the sale of subscriptions, sponsorships, and advertising. Nightly polling on politics, business and lifestyle topics provides the content to update the Rasmussen Reports web site many times each day. If it's in the news, it's in our polls. Additionally, the data drives a daily update newsletter and various media outlets across the country.
Some information, including the Rasmussen Reports daily Presidential Tracking Poll and commentaries are available for free to the general public. Subscriptions are available for $4.95 a month or 34.95 a year that provide subscribers with exclusive access to more than 20 stories per week on upcoming elections, consumer confidence, and issues that affect us all. For those who are really into the numbers, Platinum Members can review demographic crosstabs and a full history of our data.
To learn more about our methodology, click here.