Americans Are Politically Divided and Our Feelings Toward the Parties Show It
A Commentary By Alan I. Abramowitz
How politically divided are ordinary Americans? The recent release of a report on polarization in public opinion by the Pew Research Center has reignited a debate among journalists and academics about the depth of the divisions between supporters of the two major parties. One of the key findings of the report is that supporters of the two parties hold increasingly negative feelings toward the opposing party and its leaders. While some scholars like Morris Fiorina of Stanford University have disputed the significance of these findings, an examination of evidence from the American National Election Studies provides strong support for the conclusions of the Pew study.
The ANES data make it possible to examine trends in feelings toward the Democratic and Republican parties over a fairly long period of time. Since 1978, the ANES has been asking national samples of American adults in every presidential election year and most midterm election years to rate both parties on a feeling thermometer scale. The scale ranges from zero degrees to 100 degrees with zero the most negative rating, 100 the most positive rating, and 50 a neutral rating. Ratings above 50 degrees are considered positive, while ratings below 50 degrees are considered negative.
Figure 1: Average feeling thermometer ratings of Democratic and Republican parties by decade
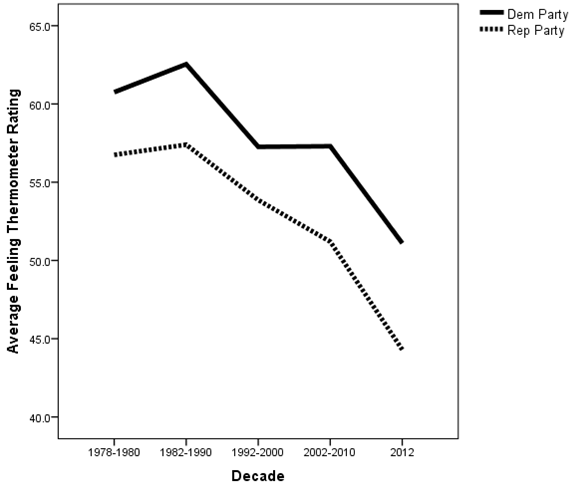
Source: American National Election Studies
Figure 1 displays the trends in the average ratings by voters of the Democratic and Republican parties on the feeling thermometer scale since the late 1970s. The results show that since the 1980s, there has been a clear decline in the average ratings of both parties. Since that time the average rating of the Democratic Party has fallen from the low 60s to the low 50s, while the average rating of the Republican Party has fallen from the upper 50s to the mid 40s. In fact, both parties received their lowest ratings ever in 2012.
Figure 2: Average feeling thermometer ratings of own party and opposing party by decade
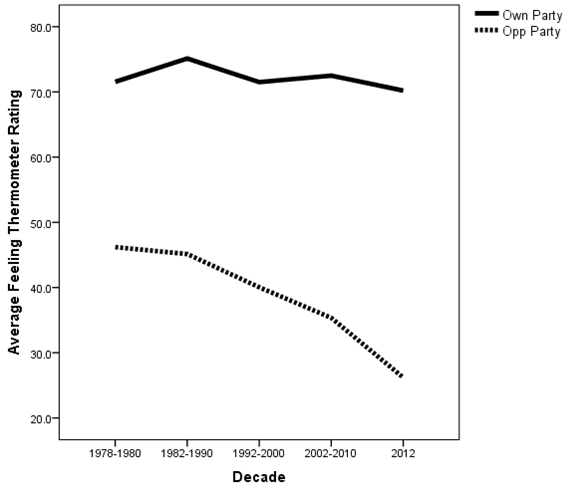
Source: American National Election Studies
Both parties are less popular today than they were 30 or 40 years ago, but that’s almost entirely due to a decline in ratings of the opposing party by Democratic and Republican identifiers. Figure 2 displays the trends in average ratings by voters identifying with a party — including independents leaning toward a party — of their own party and the opposing party. These results show that voters’ ratings of their own party have changed very little and remain quite positive. On average, voters continue to give their own party an average rating in the low 70s. In sharp contrast, ratings of the opposing party have declined substantially, falling from the upper-40s during the late 1970s and 1980s to the mid 20s in 2012. As a result, Americans, on average, rate their own party much more positively than the opposing party.
Table 1: Feelings about Democratic and Republican parties by decade
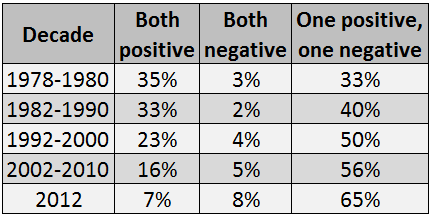
Note: Percentages sum across and do not total 100 due to exclusion of those with neutral opinions of one party or both parties.
Source: American National Election Studies
Americans’ feelings toward the Democratic and Republican parties are much more polarized today than 20 or 30 years ago. The data in Table 1 show that between the late 1970s and 2012, there was a dramatic increase in the proportion of Americans with a positive opinion of one party and a negative opinion of the other party. Over this time period, the proportion of Americans with such polarized opinions nearly doubled, going from 33% to 65%. There was an equally dramatic decline in the proportion of Americans with favorable opinions of both parties. During the late 1970s, more than a third of Americans had a positive opinion of both parties. By 2012, only 7% of Americans had a positive opinion of both parties. However, the proportion of Americans disliking both parties only increased slightly during this time period, going from 3% in the late 1970s to 8% in 2012.
Table 2: Percentages of Democrats and Republicans with positive rating of own party and negative rating of opposing party by decade
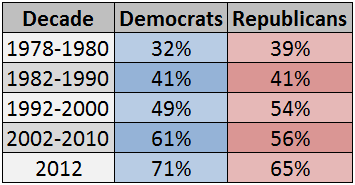
Source: American National Election Studies
The results displayed in Table 2 show that the increase in polarized opinions of the parties affected both Democratic and Republican identifiers. Between the late 1970s and 2012, the proportion of Democrats with a positive opinion of the Democratic Party and a negative opinion of the Republican Party increased from 32% to 71%, while the proportion of Republicans with a positive opinion of the Republican Party and a negative opinion of the Democratic Party increased from 39% to 65%.
Conclusions
Data from the American National Election Studies show that since the late 1970s, opinions of both major parties have become somewhat more negative. However, this is due almost entirely to the increasingly negative feelings that both Democratic and Republican identifiers, including independent leaners, hold toward the opposing party.
Feelings toward the parties are much more polarized today than they were in the late 1970s and 1980s, with far more voters holding positive feelings toward their own party and negative feelings toward the opposing party. This growing divide in voters’ feelings toward the parties has contributed to increased party loyalty and straight-ticket voting in elections. Voters may not like their own party any better today than in the past, but they dislike the opposing party much more than in the past and are less willing to consider voting for its candidates.
Alan I. Abramowitz is the Alben W. Barkley Professor of Political Science at Emory University and a senior columnist for the Crystal Ball . His most recent book is The Polarized Public: Why American Government Is So Dysfunctional . Follow Alan on Twitter @AlanIAbramowitz.
Courtesy of Larry Sabato's Crystal Ball
See Other Commentary by Dr. Alan Abramowitz
Related Articles

Rasmussen Reports is a media company specializing in the collection, publication and distribution of public opinion information.
We conduct public opinion polls on a variety of topics to inform our audience on events in the news and other topics of interest. To ensure editorial control and independence, we pay for the polls ourselves and generate revenue through the sale of subscriptions, sponsorships, and advertising. Nightly polling on politics, business and lifestyle topics provides the content to update the Rasmussen Reports web site many times each day. If it's in the news, it's in our polls. Additionally, the data drives a daily update newsletter and various media outlets across the country.
Some information, including the Rasmussen Reports daily Presidential Tracking Poll and commentaries are available for free to the general public. Subscriptions are available for $4.95 a month or 34.95 a year that provide subscribers with exclusive access to more than 20 stories per week on upcoming elections, consumer confidence, and issues that affect us all. For those who are really into the numbers, Platinum Members can review demographic crosstabs and a full history of our data.
To learn more about our methodology, click here.