The Electoral College: Map No. 2
A Commentary By Larry J. Sabato, Kyle Kondik and Geoffrey Skelley
Plus ça change, plus c'est la même chose
Some of our readers may recall that the Crystal Ball published its first 2016 Electoral College map at the end of March. It was somewhat controversial — at least judging by many of the reactions we received. As you see below, at that time we projected Hillary Clinton at 347 electoral votes and Donald Trump at 191. While Toss-ups are perfectly reasonable at this stage of the campaign, we decided for clarity’s sake to push every close state one way or the other.
Map 1: March 31 Crystal Ball Electoral College ratings
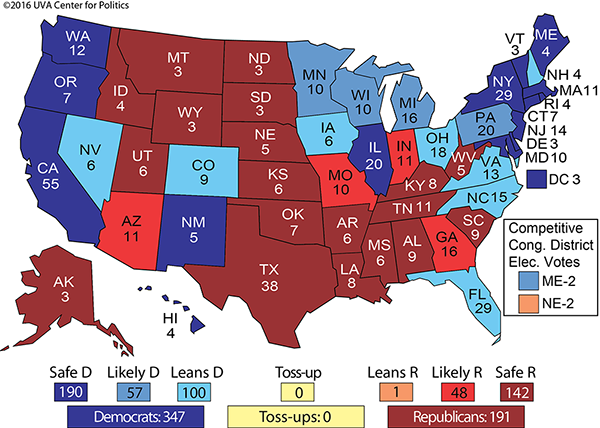
This decisive Clinton edge in the Electoral College came despite the fact that she was still engaged in a tough battle for the nomination (as was Trump back then). We also had no clear picture of the third parties and independents that might play a role in November.
Now that the primary season is over, the overall picture is clearer:
1. Both parties have semi-official nominees in Clinton and Trump, even if Bernie Sanders has not yet dropped out and some unhappy Republicans are still toying with a quixotic convention challenge to Trump. Some have argued that prognosticators should allow for the possibility that one or both of Clinton and Trump won’t actually make it to the November ballot — Clinton potentially derailed by an investigation into her use of e-mail while secretary of state, or Trump being unhorsed in Cleveland or otherwise dropping out — but these scenarios are far-fetched.
2. Potentially significant third-party candidates have jumped into (or failed to qualify) for the race. The Libertarians may be the key “none-of-the-above” entry now that conservative efforts to draft an impressive “real Republican” ticket have fallen flat, and it is not yet clear which party could lose more votes to the Libertarian ticket (Gary Johnson and Bill Weld) as a consequence.
3. The Green Party, led by presumptive nominee Jill Stein, could take some Sanders voters, although it has yet to score any real breakthrough in the polls, having received a mere 0.36% in 2012. Moreover, Democrats frequently urge one another to be on their guard since they recall Green nominee Ralph Nader drew enough votes in swing states to switch the White House from Al Gore to George W. Bush in 2000.
4. A big initial Clinton advantage faded after Trump became the presumptive nominee, and a couple of surveys actually showed Trump with a narrow national lead. Lately Clinton has regained her advantage: Both HuffPost Pollster and RealClearPolitics had Clinton up by about six percentage points as of Wednesday afternoon. Trump has not led any national poll since May. With all of these shifts, it’s time to revisit our map. With no drum roll — that’s overly dramatic in mid-June — here is our new and improved Electoral College map:
Map 2: Updated Crystal Ball Electoral College ratings
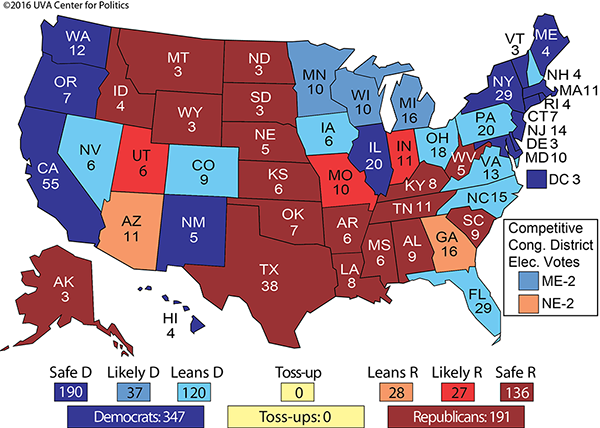
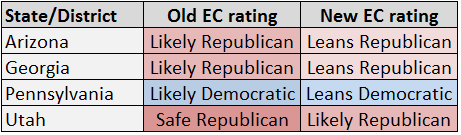
Table 1: Crystal Ball Electoral College ratings changes
Now you see why we dropped the drum roll. The revised map is anticlimactic — though startling in another sense because it doesn’t show what so many people may have expected. We simply detect no compelling reason to change very much, thus our subtitle, “plus ça change, plus c’est la même chose.”
Our Electoral College totals have not budged: 347 electoral votes Safe, Likely, or Leaning to Clinton and 191 Safe/Likely/Leaning Trump.
So to us, the state of the general election has not shifted much at all in the nearly three months since we issued our first Clinton-versus-Trump map. Clinton remains a substantial favorite. If this is how the election actually turns out — and it probably won’t, at least not exactly, because there is a long way to go — Clinton would win a victory smaller than Barack Obama’s 2008 win (365 electoral votes) but bigger than his 2012 reelection (332).
The ratings tweaks
We are shifting one state a bit toward Trump, although Democrats retain an advantage there. Pennsylvania, potentially the most important state in 2016, moves from Likely Democratic to Leans Democratic. Trump is targeting the state, and a number of his more plausible paths to 270 include turning the Keystone State red for the first time since 1988.
Here’s where we’ll see the success or failure of the Trump appeal to white blue-collar voters (culturally and/or economically). The state as a whole has moved slightly toward the Republicans over the past few cycles. However, we’ve seen much larger average shifts at the county level. Western Pennsylvania has reddened sharply — over the past four cycles, the nine counties with the largest relative movement in the GOP’s direction are located there — while eastern Pennsylvania, particularly near Philadelphia, has trended notably Democratic. But Pennsylvania remains a fairly white state (19th by non-Hispanic white overall), so it’s perhaps unsurprising that early polls there show Trump, who will be very reliant on white voters, has a shot to compete for the state’s 20 electoral votes.
If Trump’s blue-collar strategy is going to work, the Keystone State is a logical target. But it’s an open question how many more votes a Republican can add to the party’s net tally in areas such as southwestern Pennsylvania, considering the edge the party has there already. In addition, Trump will also have to overcome what should be at least a 400,000-vote Democratic plurality just from Philadelphia County, not to mention challenges in the big, wealthy, well-educated suburban counties that ring the city. Terry Madonna and Michael Young, two keen analysts of Keystone State politics, see a path for Trump, albeit a narrow one.
Ultimately, for now at least — given Trump’s strategy — we think Pennsylvania should be rated the same as states such as Florida and Ohio, both of which we call Leans Democratic.
Speaking of those three states, Quinnipiac University polled all of them and found Clinton up eight points in Florida but only tied in the other two. We don’t think this is how the election will ultimately play out. Florida has not voted considerably more Democratic than Ohio and Pennsylvania since the days of the overwhelmingly Democratic Solid South, an electoral alignment that started to break up after World War II. These three states have voted fairly close to the national average in recent years, so if Clinton’s national lead is around six points, that’s probably about what her lead in these states is as well. Trump needs to carry at least two of these three electoral vote-rich states to have a path to victory, and in our view he’s an underdog in all three at the moment. Notably, the Clinton campaign is starting to spend heavily on television advertising in some key states, including Florida and Ohio, although her campaign has yet to spend in Pennsylvania, which Democrats see as a significant reach for Republicans.
Excepting Pennsylvania, our new ratings changes favor Clinton.
Currently, we show every Obama 2012 state at least leaning to Clinton, along with North Carolina, the one state won by Mitt Romney where we currently see a Democratic edge. Obama carried North Carolina in 2008 along with Indiana, a traditionally conservative state that has long been the most Republican state in the Midwest. If Clinton’s national lead does grow further, it’s far from impossible that she might be able to carry Indiana, as well as Missouri, which Obama did not carry in either of his elections. But as of now, we think that is unlikely, and Trump remains the favorite in both.
Two Republican-leaning states where Democratic chances might be better are Arizona and Georgia. Both states typically vote several points more Republican than the nation, but they are both becoming more diverse: Arizona has a growing Hispanic population that will in all likelihood be quite hostile to Trump, an anti-immigration hardliner, while Georgia has a significant and deeply Democratic bloc of African-American voters as well as a growing, educated, white-collar professional class that might be turned off by Trump. While Trump is still a favorite in both places, we see Clinton having the potential to grab one or both if she ends up winning a big national victory, so we’re moving Arizona and Georgia from Likely Republican to Leans Republican.
Our ratings are premised to a large degree on a belief that we are not going to see dramatic changes in the electoral performance of the states this year. In other words, we think the states that have been the most Democratic in recent elections will continue to be among the most Democratic, the most Republican states will continue to be the most Republican, and the states that have voted closest to the national average in recent elections — the swing states — will continue to reflect the national average.
Table 2 shows the average two-party presidential performance in each state from 2000-2012. Note that the states that have been consistently the most Democratic in that timeframe all have Safe Democratic designations, while the most Republican states in that timeframe are almost exclusively rated as Safe Republican. Could Clinton win Texas, as she has suggested? Maybe, but only if she is winning nationally in a blowout. The same is true of Trump in California and New York: They only come into play for him if he is rolling up a huge national margin, which at this point is essentially unimaginable. As long as the election is decided by less than 10 points nationally — and we haven’t had a 10+ point margin since Ronald Reagan’s 49-state landslide in 1984 — none of these states should be all that competitive.
Table 2: Two-party Democratic presidential vote by state, 2000-2012
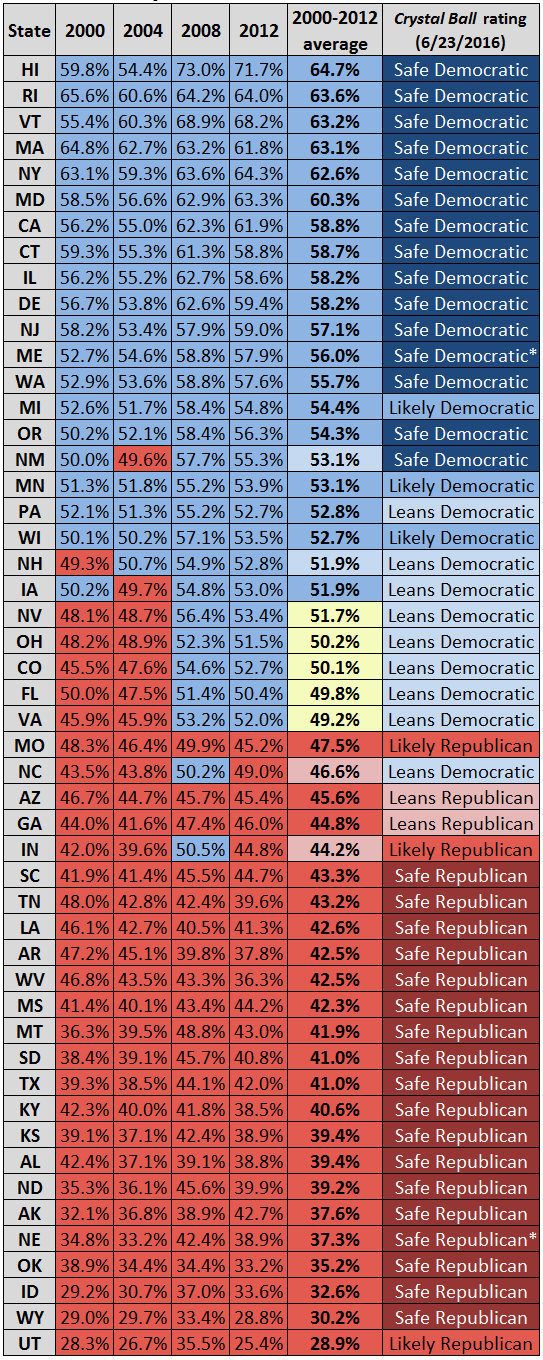
Notes: *Indicates states that award some electoral votes by congressional district. The rating listed applies only to the statewide vote. State results are colored by the party that won. The 2000-2012 average column is colored by the results over the four cycles: Blue for four Democratic victories, light blue for three Democratic victories, yellow for a two-two split, light red for three Republican victories, and red for four Republican victories.
Source: Dave Leip’s Atlas of U.S. Presidential Elections
However, there is at least one exception: Utah, which has been the most Republican state in the nation over the last four elections. We’re moving it from Safe Republican to Likely Republican.
Several 2016 polls have shown the state to be competitive. While Utah is very Republican, it also stands apart from other states because of its heavy Mormon population (58% of the state, according to the American Values Atlas), a religious group whose members were notably cool to Trump during the primary season. (Trump only got 14% in the state’s caucus, held on March 22.) Ultimately, Utah seems most unlikely to vote Democratic for president, but Trump could wildly underperform there and bleed votes to Johnson’s Libertarian ticket or perhaps someone else — the independent filing deadline is Aug. 15. The reasons for Trump’s troubles with Mormons are legion, according to BuzzFeed’s McKay Coppins, including his apparent hostility to religious freedom (his proposal to at least temporarily ban Muslims from entering the United States) and hardline anti-immigration message. Additionally, Coppins argues, “pitchfork populism doesn’t hold the same visceral appeal for a religious community with above-average education levels, relatively stable families, and comfortable middle-class incomes.” Perhaps more important, if Trump does indeed perform poorly with Mormons, it could also hurt him in more competitive states such as Utah’s neighbors (Arizona, Colorado, and Nevada). These are places with above-average Mormon populations where Trump’s potential underperformance with Hispanics may do him further harm.
The overall picture
If most of the Sanders vote is gradually re-absorbed into the Democratic column — a reasonable expectation — Clinton will get a boost of a couple percentage points nationally and in swing-state polling. Should the Democratic convention be a harmonious show — not a certainty — and Clinton’s choice for VP be well-received across the party and nation, Clinton’s poll gains should harden.
The same thing could happen for Trump, of course, but party unity within the Republican family is a non-starter. Two former presidents (both Bushes), the previous party nominee (Romney), and a host of other top GOP officials, donors, and commentators will never get on the Trump bandwagon. News media coverage is bound to stress who does not come to Cleveland, not just who does. It’s also doubtful that senior officials who have been publicly lukewarm about Trump are suddenly going to start singing his praises in or after Cleveland. They know that on any given day, some new or renewed Trump controversy could force them to stand down and backtrack.
The watchword for much of the party establishment is extreme wariness, although we’re skeptical of a possible coup attempt in Cleveland. As much as many Republicans dislike Trump and fear he will lead to catastrophic losses in the fall, he won the nomination fair and square, and previous attempts to derail the Trump train have failed. If Trump isn’t the nominee, who would it be? The anti-Trump forces have no candidate to rally around, and they almost certainly couldn’t agree on one. Bluntly put, the GOP is stuck with Trump. And a substitute nominee, should one be installed somehow, would be asked to lead a viciously divided party with no real chance of victory.
Nothing here or anywhere is carved into stone in a most unorthodox presidential year. We recognize that Clinton has loads of weaknesses, too. Personally, she isn’t much liked or trusted. She’s also heavily dependent upon President Obama’s job approval, and thus must fear a reversal of his majority standing. Obama’s ratings could take a nosedive on account of a surprise recession or more domestic terrorism. And as we all know, Clinton might face the email music, courtesy of the FBI at an inopportune time. Scandals and controversies are part of the Clinton tapestry over a quarter-century in national politics. Why would 2016 be any different?
So while reasonably confident of the direction of the 2016 general election, your Crystal Ball will always wait and watch. We will revise the electoral map again a few weeks after the conventions have adjourned, and as needed throughout the campaign.
The colors on our map don’t run, but they won’t fully dry either, at least until late on the evening of Election Day, Nov. 8. We can’t rule out a dramatic reassessment, but so far, early in this campaign, one has not been required.
Larry J. Sabato is the director of the Center for Politics at the University of Virginia.
Kyle Kondik is a Political Analyst at the Center for Politics at the University of Virginia.
Geoffrey Skelley is the Associate Editor at the Center for Politics at the University of Virginia.
See Other Political Commentary by Larry Sabato
See Other Political Commentary by Kyle Kondik
See Other Political Commentary by Geoffrey Skelley
See Other Political Commentary
Related Articles

Rasmussen Reports is a media company specializing in the collection, publication and distribution of public opinion information.
We conduct public opinion polls on a variety of topics to inform our audience on events in the news and other topics of interest. To ensure editorial control and independence, we pay for the polls ourselves and generate revenue through the sale of subscriptions, sponsorships, and advertising. Nightly polling on politics, business and lifestyle topics provides the content to update the Rasmussen Reports web site many times each day. If it's in the news, it's in our polls. Additionally, the data drives a daily update newsletter and various media outlets across the country.
Some information, including the Rasmussen Reports daily Presidential Tracking Poll and commentaries are available for free to the general public. Subscriptions are available for $4.95 a month or 34.95 a year that provide subscribers with exclusive access to more than 20 stories per week on upcoming elections, consumer confidence, and issues that affect us all. For those who are really into the numbers, Platinum Members can review demographic crosstabs and a full history of our data.
To learn more about our methodology, click here.