History in Red and Blue (and Green and Purple)
A Commentary By Larry J. Sabato and Tim Robinson
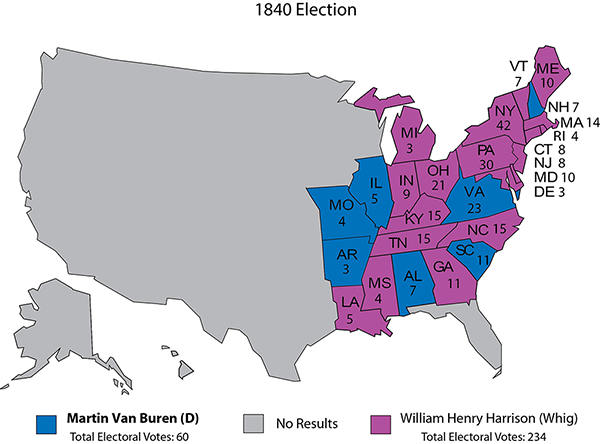
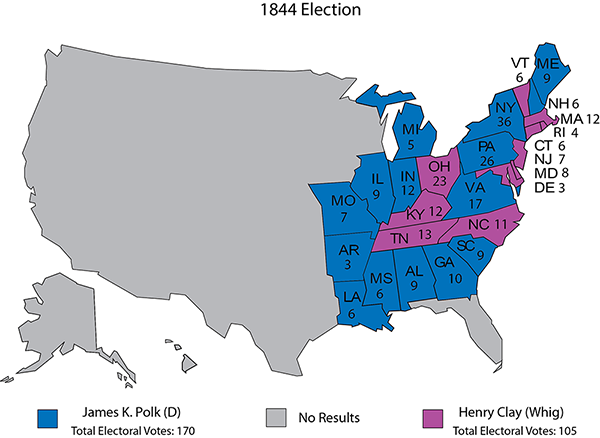
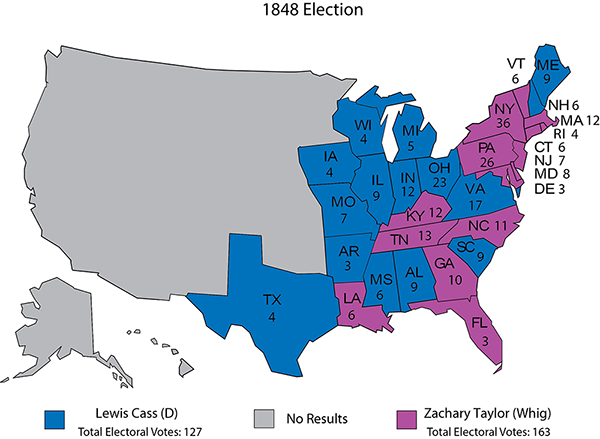
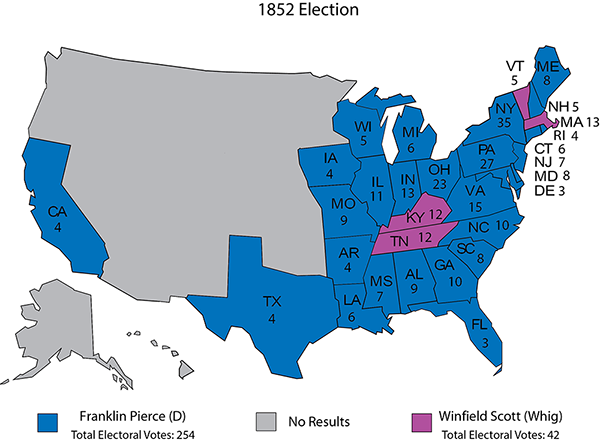
The evolution of the Electoral College from 1824-2012
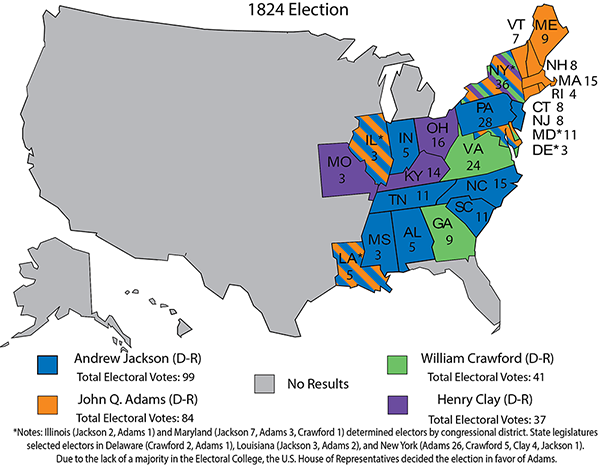
Simple maps can teach a lot. Presidential election maps show at a glance where the nation was at four-year intervals beginning in 1824, when popular voting (of a very restricted sort) became established. John Quincy Adams lost that vote but won the White House anyway in the House of Representatives.
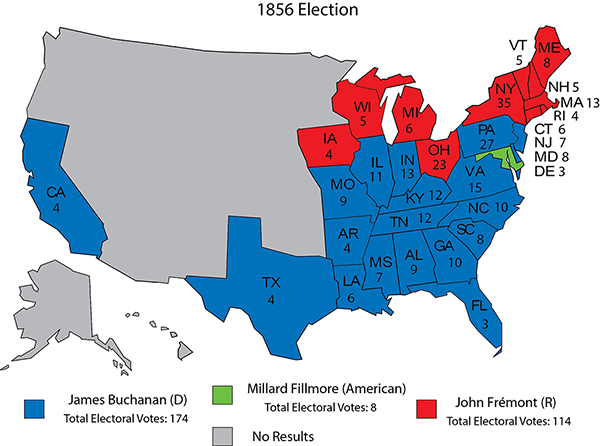
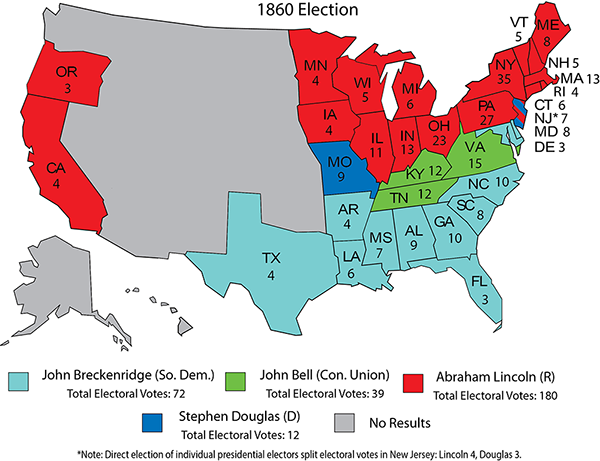
We didn’t have maps that analysts could splash with Republican Red and Democratic Blue until 1856, but since then, our two-party system has been remarkably stable — even as the meaning of the colors and party labels has changed dramatically. (The current Red/Blue scheme was gradually adopted by the news media in the 1970s and 1980s; it is pretty much universal now.)
This is the slow time between Christmas and New Year’s, and you’ve got 15 minutes to flip through the 48 maps linked here. Many of you have forgotten or never known about some of these elections, but they are part of the tapestry that has led us to the dawn of 2016’s contest.
Throughout American history, electoral coalitions have been born with fanfare. Then they age and die just like their founders, replaced by some other temporary alignment. Some majorities are flash-in-the-pan but others, like the New Deal coalition, survive for decades, deteriorating only gradually.
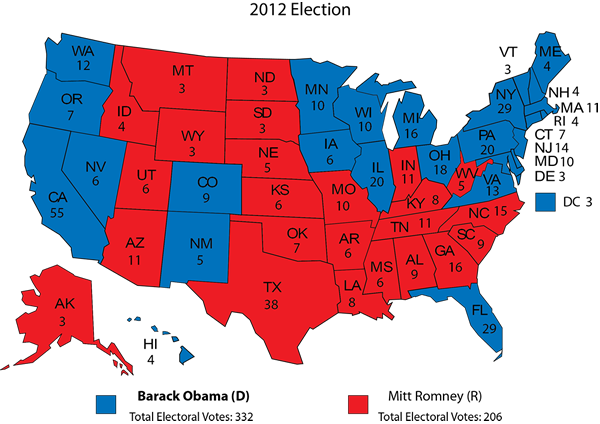
It will be interesting to see whether the newest in the long line, the Obama majority, continues, dies, or goes into hibernation next year.
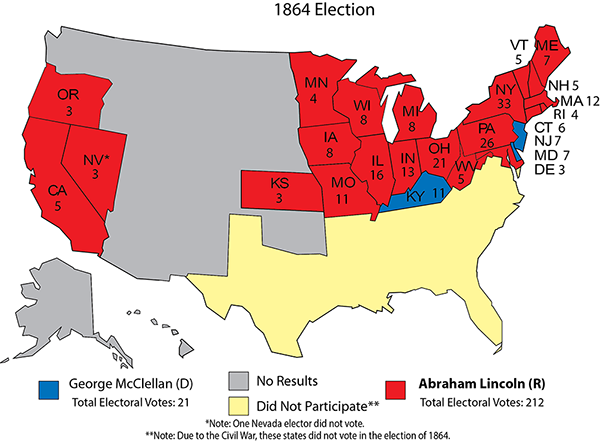
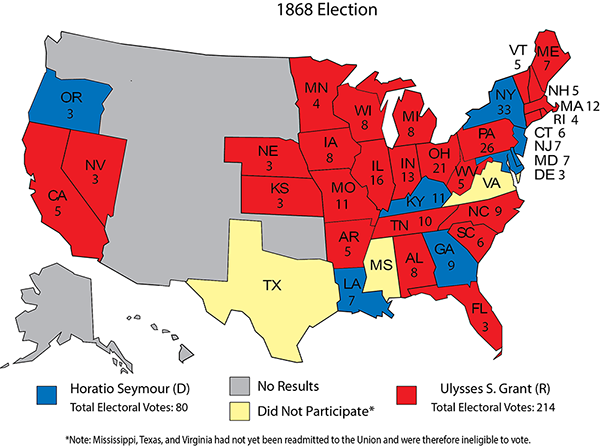
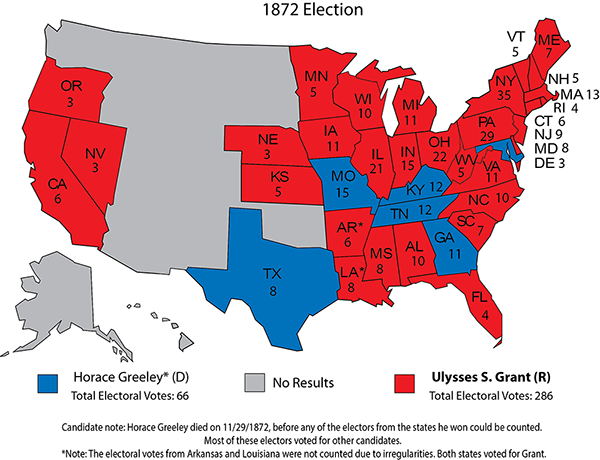
Once you get to 1856 and the GOP’s debut on the national scene, take note of the North (Republican)/South (Democratic) pattern that defined presidential politics for about a century. The South was out of the picture for 1864 because of a little skirmish called the Civil War, and three states still hadn’t been readmitted to the Union in 1868. (The only two elections where West Virginia outvoted Virginia in the Electoral College were in 1864 and 1868. The Old Dominion couldn’t participate.)
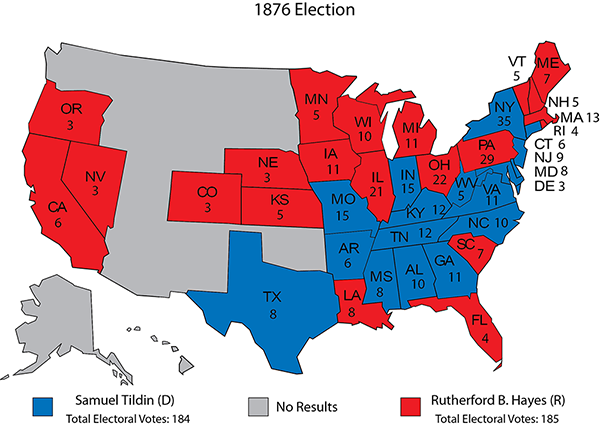
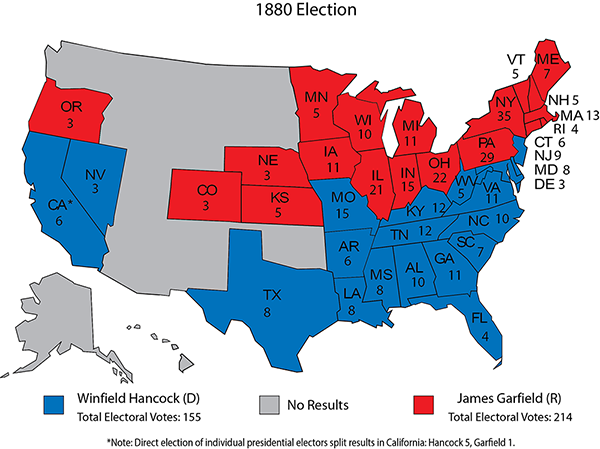
Naturally, the closest elections are the most eye-catching, such as the corrupt contest in 1876 between Democrat Samuel Tilden and the eventual, much-disputed winner, Republican Rutherford B. Hayes, or the near-draw of 1880 (in popular vote at least). James A. Garfield (R) won a narrow victory only to be shot within four months of taking office.
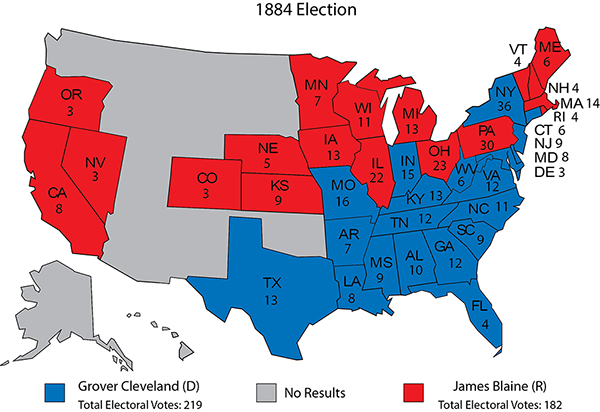
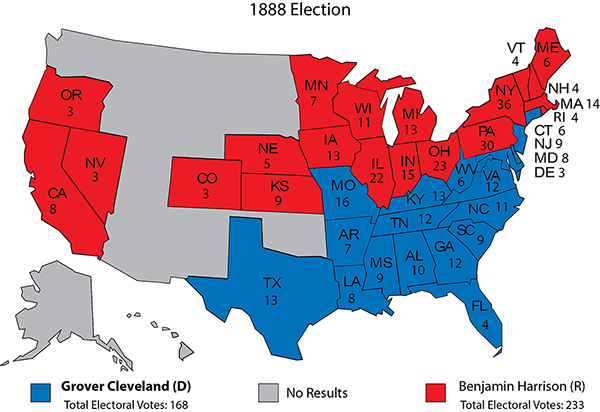
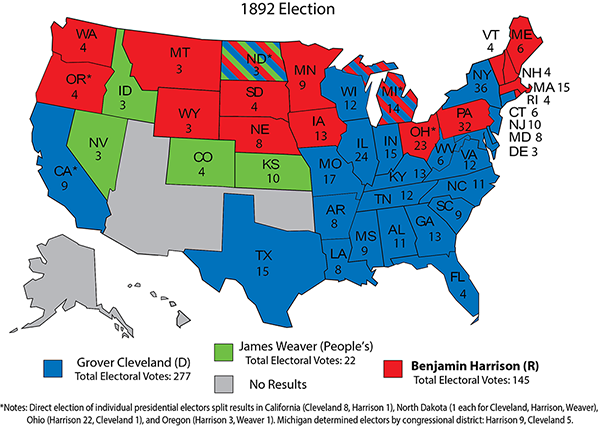
New York was for decades both the most populous state with the largest cache of electors, and also the state that, with some regularity after Reconstruction, would flip back and forth between the two parties. When Grover Cleveland (D) carried his home Empire State in 1884 and 1892, he became president. When Benjamin Harrison (D) snatched New York away in 1888, he tossed out Cleveland for a term.
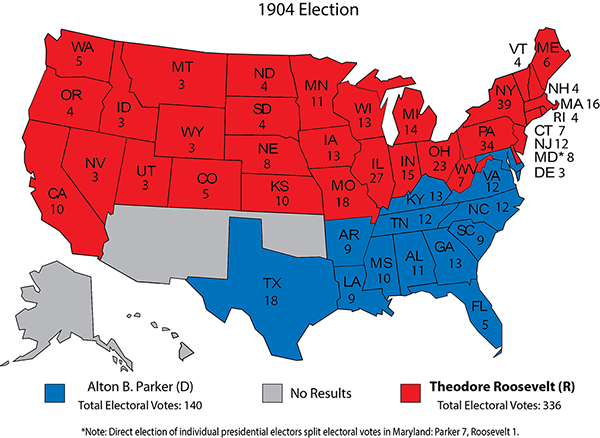
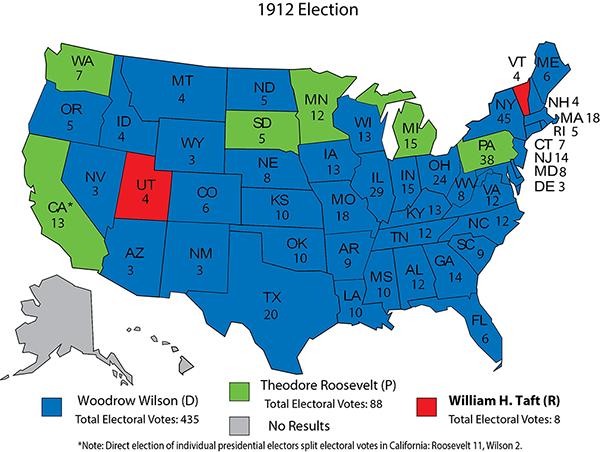
Finally, in 1912, the continental map was completed and 48 states were represented in the Electoral College for the first time. With just 41.8% of the vote, Democrat Woodrow Wilson won 40 states. Republican President William Howard Taft captured only Utah and Vermont, while Bull Moose nominee Teddy Roosevelt lassoed six states, most prominently California, Michigan, and Pennsylvania.
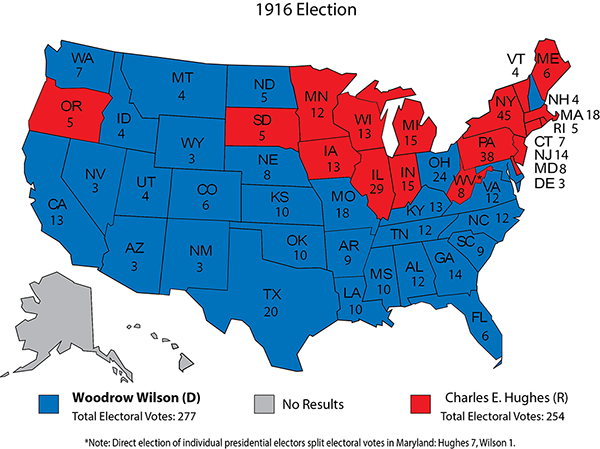
No two-term president has ever fallen so far in the Electoral College as Wilson did in his second election, from a massive 435 votes in 1912 to just 277 in 1916, when the GOP reunited behind Charles Evans Hughes. Wilson barely scraped by, and even the state he had governed, New Jersey, turned its back on him.
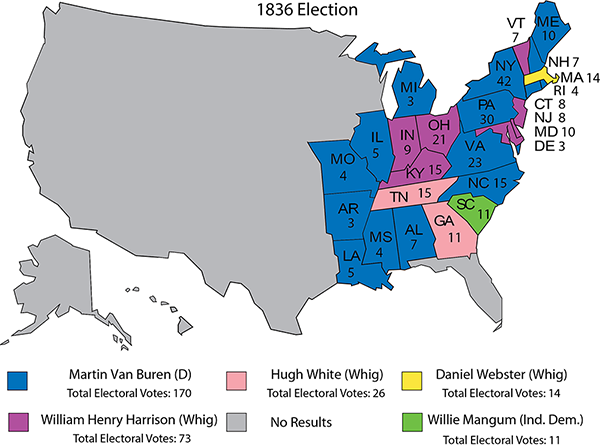
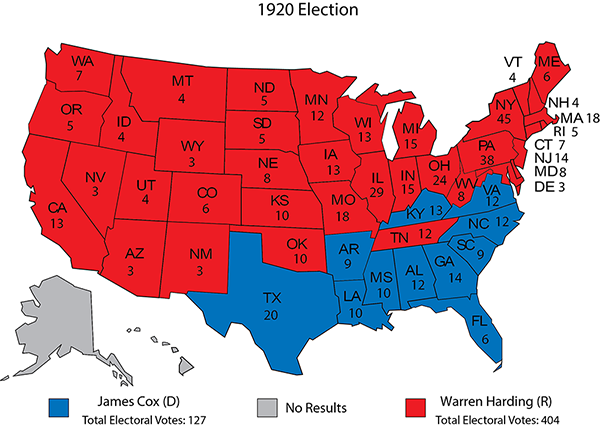
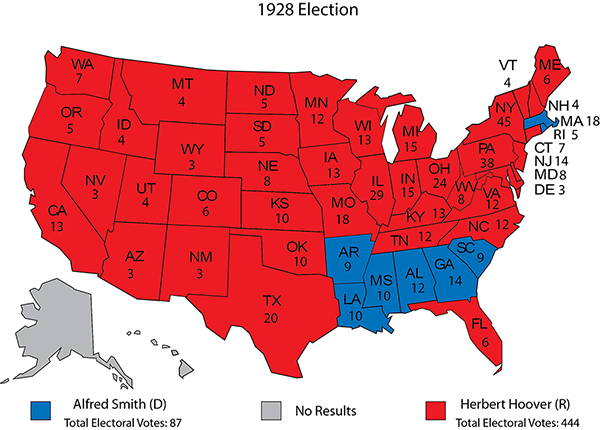
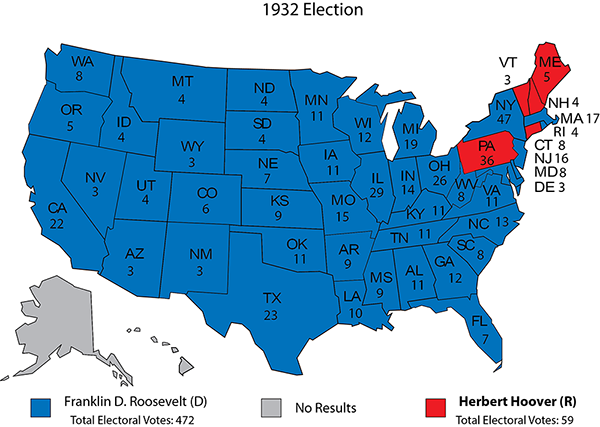
Of course, one-term presidents defeated for a second term have fallen further than Wilson. Herbert Hoover holds the record, collapsing from 444 electors in 1928 to a mere 59 in 1932. At least Hoover held onto 5 states (all in the Northeast). His successor as GOP nominee, Gov. Alf Landon of Kansas, received just 8 votes in 1936 from two states: As Maine went, so went Vermont.
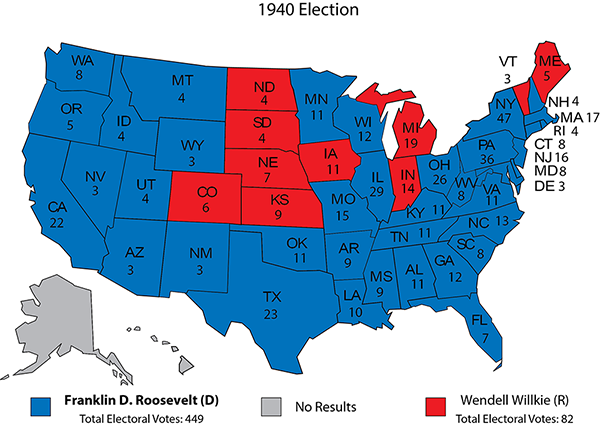
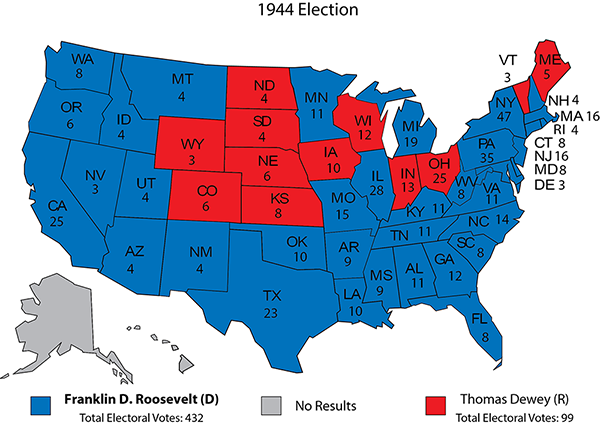
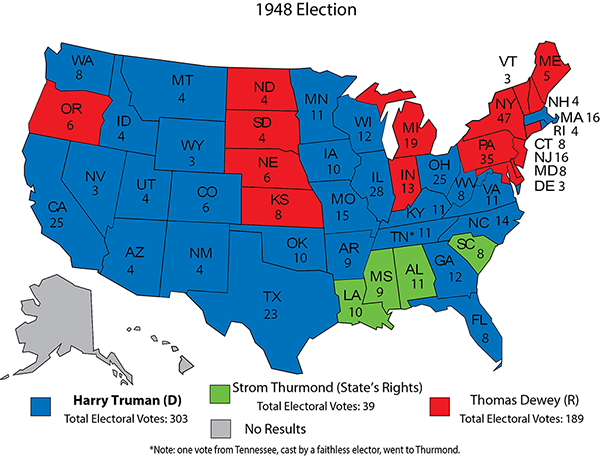
Franklin Roosevelt’s four victories were all Electoral College landslides, with his electors totaling 472, 523, 449, and 432. His successor, Harry Truman, didn’t have FDR’s pull, but Truman’s 303 electors in 1948 comprised a magnificent upset triumph in difficult circumstances.
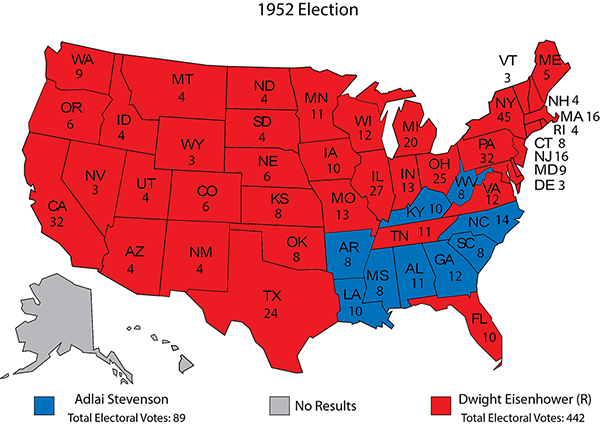
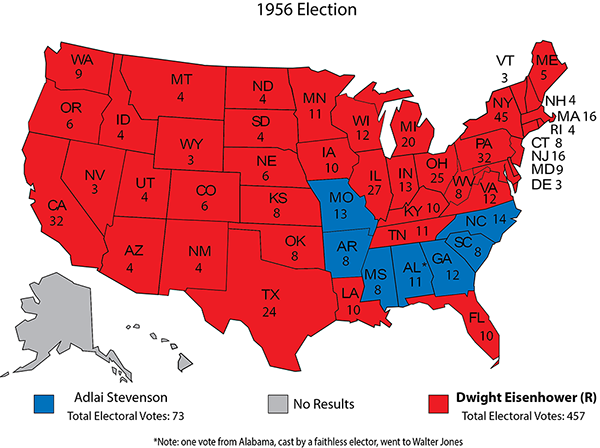
Never has personal popularity mattered as much as in 1952 and 1956. The nation was still fundamentally Democratic, but Dwight Eisenhower had two near-sweeps (442 and 457 electors, respectively).
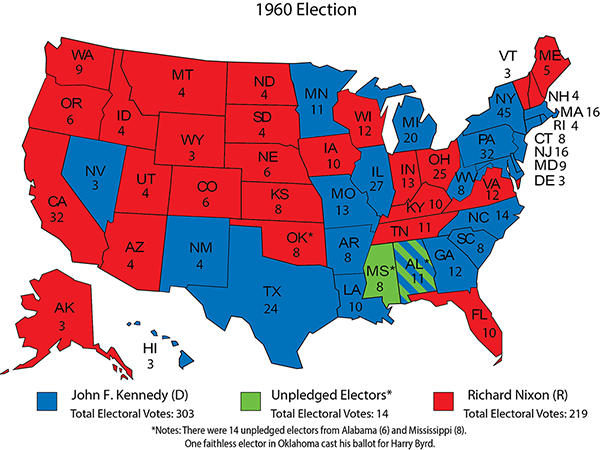
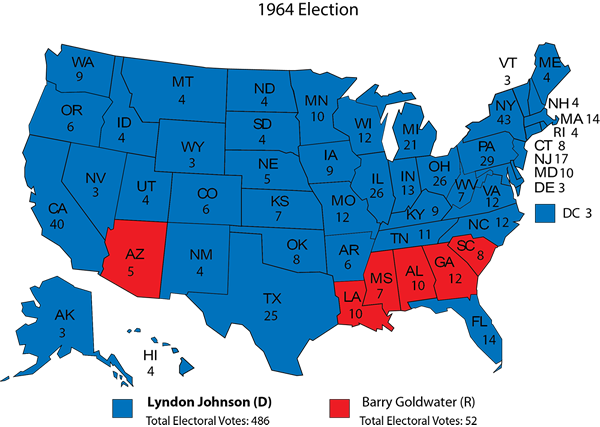
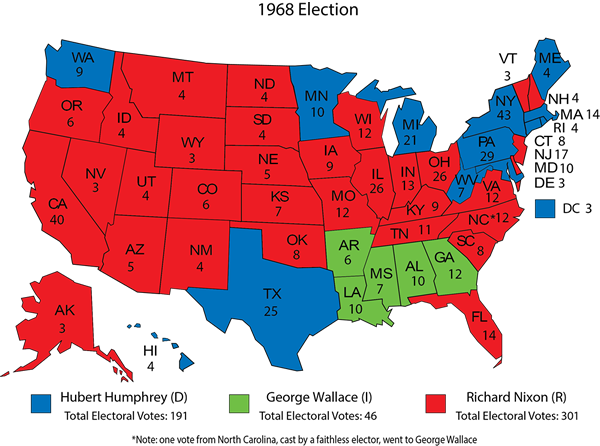
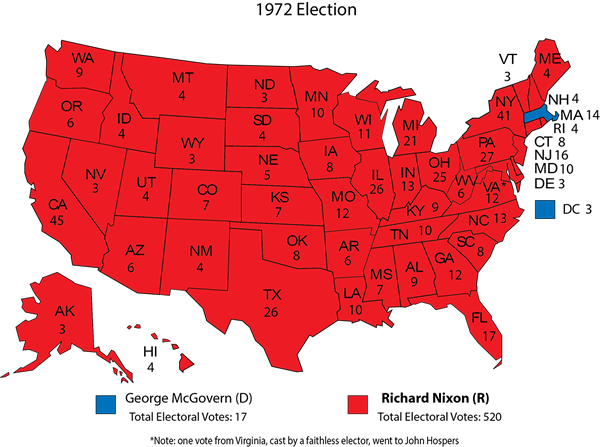
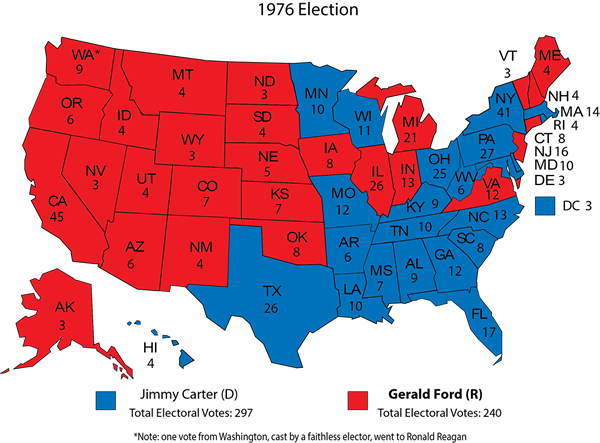
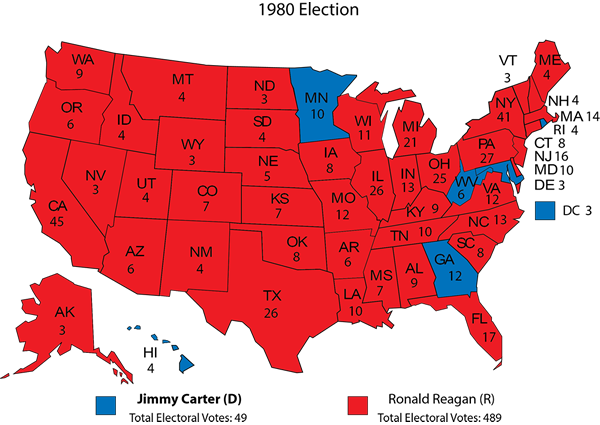
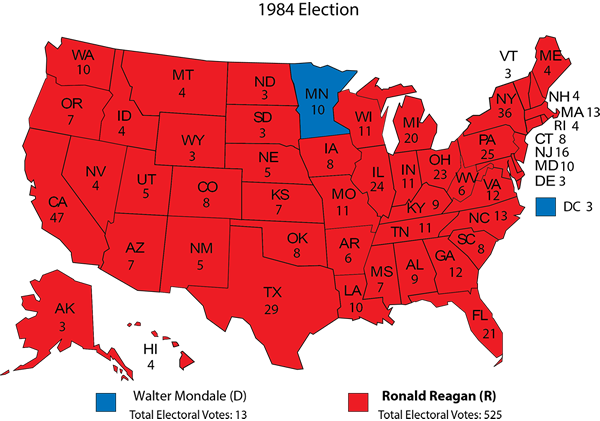
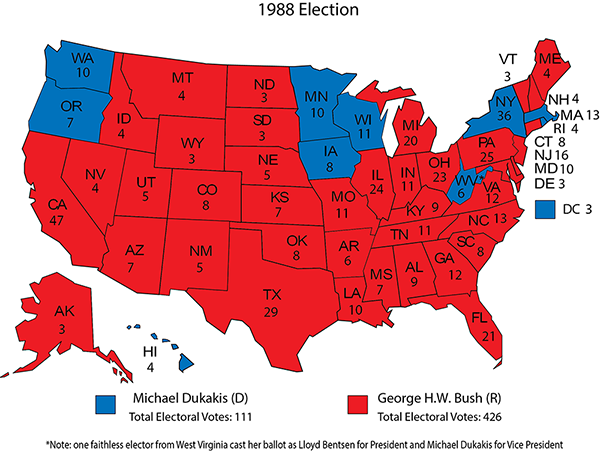
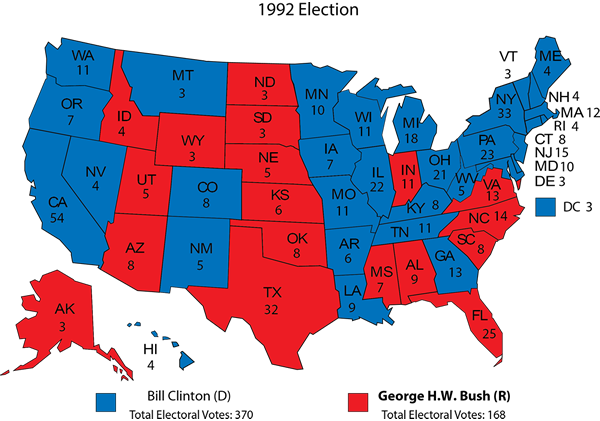
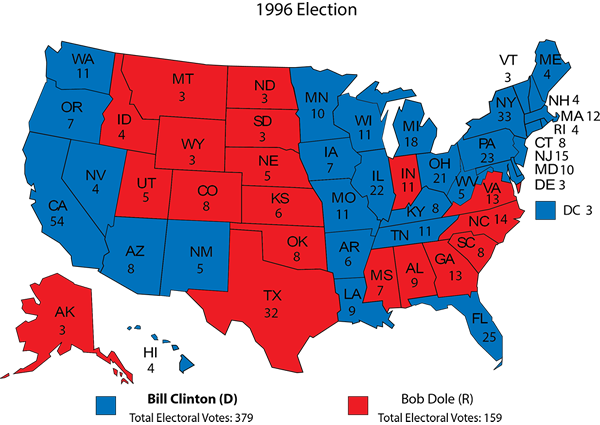
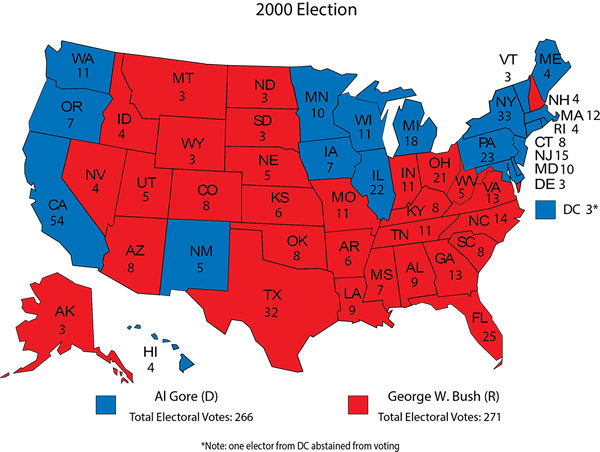
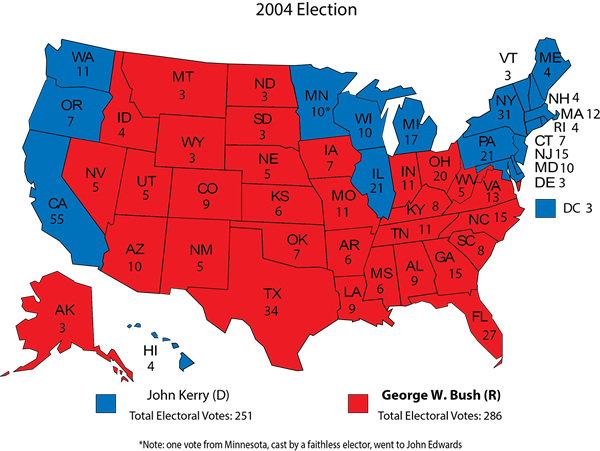
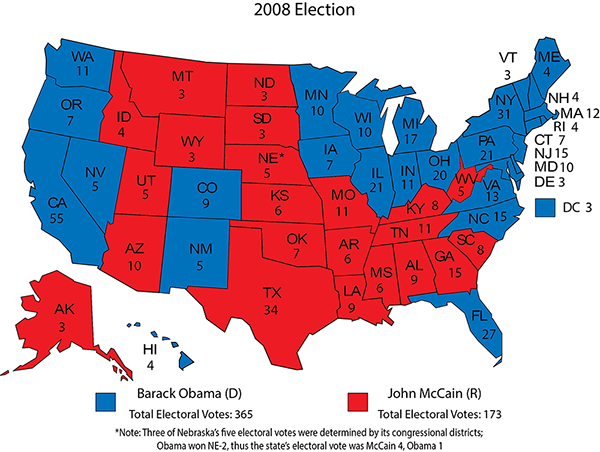
The Crystal Ball’s readers are much more familiar with the presidential elections from 1960 to 2012, so we’ll leave those maps to your own analysis and commentary.
Each map, old and new, has had significant (and sometimes tremendous) implications for the United States at home and abroad. The colors on these maps don’t fade; they are the permanent record of the actions of a free people at the polls. Mistakes have been made — we’ll leave it to you to construct your own presidential list — but the nation has survived. May it always be so.
The Electoral College: 1824-2012
Notes: Click on the maps to expand their size. Incumbents’ names are bolded.

Sources: Dave Leip’s Atlas of U.S. Presidential Elections, 270towin.com, and CQ Press Guide to U.S. Elections, volume I, 6th edition.
Larry J. Sabato is the director of the Center for Politics at the University of Virginia.
See Other Political Commentary by Larry Sabato
See Other Political Commentary
Related Articles


Rasmussen Reports is a media company specializing in the collection, publication and distribution of public opinion information.
We conduct public opinion polls on a variety of topics to inform our audience on events in the news and other topics of interest. To ensure editorial control and independence, we pay for the polls ourselves and generate revenue through the sale of subscriptions, sponsorships, and advertising. Nightly polling on politics, business and lifestyle topics provides the content to update the Rasmussen Reports web site many times each day. If it's in the news, it's in our polls. Additionally, the data drives a daily update newsletter and various media outlets across the country.
Some information, including the Rasmussen Reports daily Presidential Tracking Poll and commentaries are available for free to the general public. Subscriptions are available for $4.95 a month or 34.95 a year that provide subscribers with exclusive access to more than 20 stories per week on upcoming elections, consumer confidence, and issues that affect us all. For those who are really into the numbers, Platinum Members can review demographic crosstabs and a full history of our data.
To learn more about our methodology, click here.