Why Trump Will Do Better in Ohio Than He Does Nationally
A Commentary By Kyle Kondik
And why that doesn’t guarantee he’ll win the state
“There is no city in the United States in which I get a warmer welcome and fewer votes than Columbus, Ohio.” – John F. Kennedy
For the first time since Ohio rejected Kennedy in favor of Richard M. Nixon in 1960, it seems quite possible that the Buckeye State will find itself on the losing side of a presidential election this year.
CNN’s Jeff Zeleny sent a scare into Ohio Democrats eight days ago when he noted that Hillary Clinton had not been in Ohio since Labor Day and that the state was “slipping down on the priority list” for the Clinton campaign. On Thursday, the New York Times’ Jonathan Martin reported from the state and suggested that the state’s bellwether status might be fading away. News broke that same day that Clinton would be coming back to Ohio Monday — perhaps that was the plan all along, or perhaps the Clinton campaign felt it had to dispatch the nominee to the Buckeye State in response to creeping rumors that the campaign was pessimistic about carrying the state.
This would not be the first time that a Democratic campaign cut bait on Ohio. In 2000, Al Gore pulled out of Ohio near the end of the campaign, and George W. Bush won the state by 3.5 points while he lost the national popular vote by half a point. There are many “what ifs” of the 2000 election that loom large: “What if Gore hadn’t pulled out of Ohio?” is one of them, although it’s probably far down the list of the most potentially impactful to the overall national outcome.
Uncertainty about Ohio comes in the midst of a competitive presidential race where Hillary Clinton is clearly reasserting herself. We urged caution about jumping to conclusions following Clinton’s strong performance (and Trump’s weak one) in the first debate. But it’s now clear that Clinton got a significant bump from the debate, and her numbers are improving across the board. There also aren’t signs that Clinton is giving up on any state that Obama won in 2012: She was just in Iowa, a state that seems likelier to vote for Trump than Ohio, and she’s campaigning in Akron and Toledo Monday. Bill Clinton is also barnstorming the Mahoning Valley — Greater Youngstown, a traditionally Democratic area where Donald Trump sees an opportunity to make gains this time — later this week.
So what role does Ohio play in this election? Here are three possibilities:
If Donald Trump becomes president, Ohio will vote for him. If Hillary Clinton wins Ohio, she will be president. But if Hillary Clinton wins by just a small margin nationally, the state could easily back Trump in a loss.
That’s because both history and demographics suggest Trump will perform better in Ohio than he does nationally, just like Nixon did in 1960. If that’s what happens, the key questions then are: 1. By how much does Trump outperform his national average in Ohio; and 2. Are the changes that Trump may make to the electorate fleeting, or are they permanent?
First, the history:
While Ohio almost always votes for the winning presidential candidate — it has done so in every election since 1964, in 28 of 30 elections since 1896, and 35 of 40 in the current Democrat vs. Republican two-party era dating back to 1856 — it typically has at least a little bit of a Republican lean. In those five elections that Ohio did not vote for the winner, it voted for a losing Republican over a winning Democrat. Based on research I did for my book The Bellwether: Why Ohio Picks the President, Ohio voted more Republican than the nation in 24 of the past 30 elections, although over the last half-century the lean has been slightly less pronounced than it was the 50 years before that.
Still, Barack Obama won nationally in 2008 by seven points and in 2012 by four, while he won Ohio by four and a half points in 2008 and three in 2012. In 2004, John Kerry actually lost Ohio by a slightly smaller margin than he did nationally.
Overall, winning Ohio is a necessary but not sufficient condition for a GOP presidential victory. That’s been true throughout history.
And it may be even truer for Trump than it has been for some previous Republican nominees. That’s because of the second factor, demographics, which in this particular election also suggest Trump should outperform his national margin in Ohio.
Ohio’s electorate is going to be somewhere around 80% white in 2016. That’s significantly higher than the national average, which will be somewhere around 70% (I’m using rounded numbers for figures that are hard to precisely formulate and on which some experts disagree). The state’s lack of diversity compared to the nation is a seeming GOP advantage in Ohio given the differences in voting between white and nonwhite voters: Obama won nonwhite voters 80%-20% in 2012 but lost whites roughly 60%-40% that year, according to exit polls. Democrats compete in Ohio because a big chunk of the state’s nonwhite vote (about two-thirds or more) is African American (black voters often give 90% or more of their votes to Democrats) and because Ohio’s white vote is not as Republican as the national average (Obama performed at least a couple of points better with Ohio whites than he did nationally).
The white population, though, merits further examination because polls show Trump consistently overperforming Mitt Romney with whites who do not have at least a bachelor’s degree (particularly among men in that group) while underperforming Romney amongst whites who do have a bachelor’s degree. That tradeoff might ultimately not work out in Trump’s favor amongst the national electorate, but it might in Ohio, which is less educated than the country. Nationally, about 29% of Americans over the age of 25 have a bachelor’s degree, while just about 26% of Ohioans do.
According to the Upshot at the New York Times, the national electorate should be nearly 45% non-college educated white and nearly 30% college-educated white (that site generally believes that exit polls overstate the percentage of nonwhites and college graduates in the electorate). In Ohio, based on the New York Times’ analysis and our own research, the Ohio electorate should be about half non-college white in 2016 and about a third college-educated white. In other words, the gap between non-college and college-educated whites in Ohio is a little bit larger than the national gap, so a growing educational difference in white voter preference — with Trump overperforming with non-college graduates and underperforming with college graduates — probably works more to Trump’s advantage in Ohio than it might in some other states.
So for historical and demographic reasons, we should expect Trump to do better in Ohio than he does nationally. By how much is the key question. Currently, polling averages show Trump doing about five points better, in terms of margin, in Ohio than nationally. That would be the biggest difference between Ohio’s margin and the national margin since, yes, 1960, when Nixon won the state by about 6.5 points in what effectively was a tied race nationally (Kennedy won the national vote by two-tenths of a point that year).
However, we’re in a fluid environment: Clinton very clearly got a polling bounce nationally and in many swing states after voters judged her the winner of the first debate, but there haven’t been any post-debate polls of Ohio, so the gap is probably narrower than it seems at this precise moment. My own sense of things from speaking with contacts on both sides in Ohio over the past couple of weeks is that prior to the debate, Trump was probably leading in the state by a very small margin, which helps explain our current Leans Republican ranking there.
A Tale of Two (and a Few Other) Counties
Politically, Ohio has three types of counties: what I call the Blue Islands, the Purple Enclaves, and the Red Reach. These are, respectively, the counties that gave Democratic presidential candidates at least 55% of the two-party vote over the last four elections, those that gave the Democratic candidates somewhere between 46%-54%, and those that gave Republican candidates at least 55%.
Map 1: Ohio’s counties by presidential performance, 2000-2012
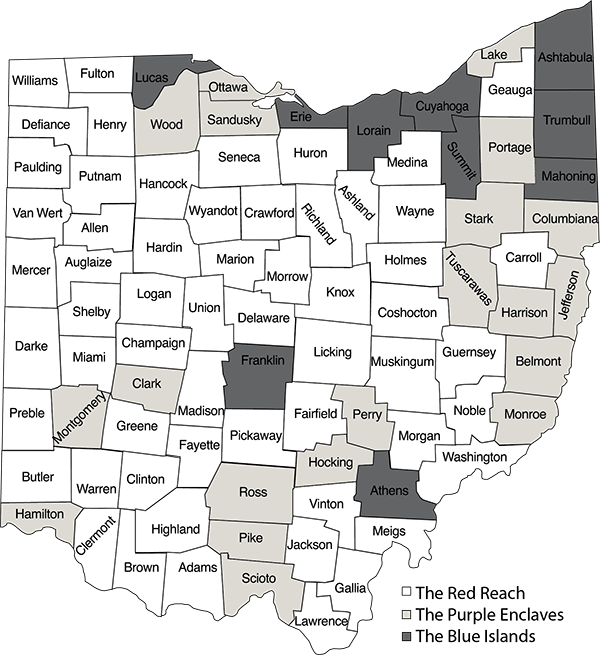
There are just 10 Blue Islands and 20 Purple Enclaves, while 58 of the 88 counties are in the Red Reach. These are shown in Map 1. One of the ways that Ohio mirrors the nation is that most of its counties are Republican, but the state is competitive overall: Barack Obama only carried about 20% of both Ohio’s counties and the total number of counties nationally while winning Ohio and the nation in 2012. This helps illustrate the Democrats’ urban strength versus the Republicans’ rural strength in both Ohio and the nation. Interestingly, and perhaps not surprisingly, the 20 swing counties, the Purple Enclaves, largely cancel themselves out. If those counties were removed from the state, that would not have changed the winner of any of the last four presidential elections in the state.
There are two counties that provide an interesting contrast in this election, though, and neither of them is a bellwether county — that is, both typically vote far from the state and national average, although that may be changing in this election. These are Trumbull and Delaware counties. The former is located in the state’s Mahoning Valley in Northeast Ohio along the Pennsylvania border (it is part of the Youngstown media market), while the latter is just north of Franklin County (Columbus). I provided commentary on both of these counties to PBS NewsHour as part of two reports it produced in Ohio a couple of weeks ago.
In some ways, the counties are exact opposites. Mitt Romney won Delaware by 23 points in 2012, while Barack Obama won Trumbull by the exact same margin. Trumbull County has voted significantly more Democratic than the state ever since 1936, when Franklin Roosevelt’s New Deal majority emerged in Ohio’s industrial heartland. Delaware has voted significantly more Republican than the state for about as long as Trumbull — it’s part of a large number of Ohio counties that reacted to the New Deal by becoming dramatically more Republican — and it hasn’t voted for a Democratic presidential candidate since Woodrow Wilson in 1916 (it has the longest streak of voting Republican of any county in the state).
The counties also have very similarly-sized populations and cast roughly the same number of votes (about 100,000 apiece in 2012). They are also both not very diverse – both counties are about 90% white.
But they are heading in opposite directions: Delaware’s population grew 75% from 2000 to 2015 — making it by far the fastest-growing county in Ohio — while Trumbull’s shrunk by about 9.5% in the same time period, making it one of the state’s fastest-declining counties. Delaware also has the state’s highest median income and is by far the state’s most-educated county (a shade over half of the county’s residents over the age of 25 has a bachelor’s degree — no other Ohio county is even over 40%). Trumbull has a below-average median income and its percentage of residents with a bachelor’s degree is just a third of Delaware’s.
Oh, and then there’s this: Delaware County was Donald Trump’s worst county in the Republican primary, while Trumbull was Trump’s second-best. Trumbull is a declining, post-industrial county, part of a region that has been struggling economically since the fall of heavy manufacturing across the Rust Belt in the late 1970s. That’s not to say that the area is devoid of employment — one major employer is General Motors, which builds the Chevrolet Cruze at a massive plant alongside the Ohio Turnpike in Trumbull County’s Lordstown — but the slogan “Make America Great Again,” and Trump’s rough-around-the-edges blue collar appeal, might be a good fit for the area. Or at least a better fit than Mitt Romney, easily caricatured as an out-of-touch plutocrat. Paul Sracic, a professor at Youngstown State University, argues that Trump has the potential to do well with some typical Democratic voters in this area because “his secret weapon with these voters is that they know he is not really a Republican.” It may have sounded tacky, but Clinton’s description of Trump’s economics at the first debate as “trumped-up trickle down” was probably a signal to some of these voters that Trump is not that different than a normal Republican. We’ll see if it works and if she keeps at it in the stretch run of the campaign.
Trump attacks free trade perhaps better than Democrats do, and this is a region quite comfortable with anti-free trade rhetoric. Jim Traficant was an outrageous, populist Democrat who eventually ended up in jail over corruption. His rhetoric (and his hair) was something of a precursor to Trump when he represented the area in Congress. And the man who would effectively take Traficant’s House seat, current Rep. Tim Ryan (D), is an anti-free trader who defeated then-Rep. Tom Sawyer (D) in a 2002, post-redistricting Democratic primary in which Ryan attacked Sawyer over his vote for the North American Free Trade Agreement in 1993.
Going back even further, Republican President William McKinley is from Niles, in Trumbull County. Back in the late 1800s, the GOP was the anti-free trade party, and McKinley supported tariffs to protect American industry.
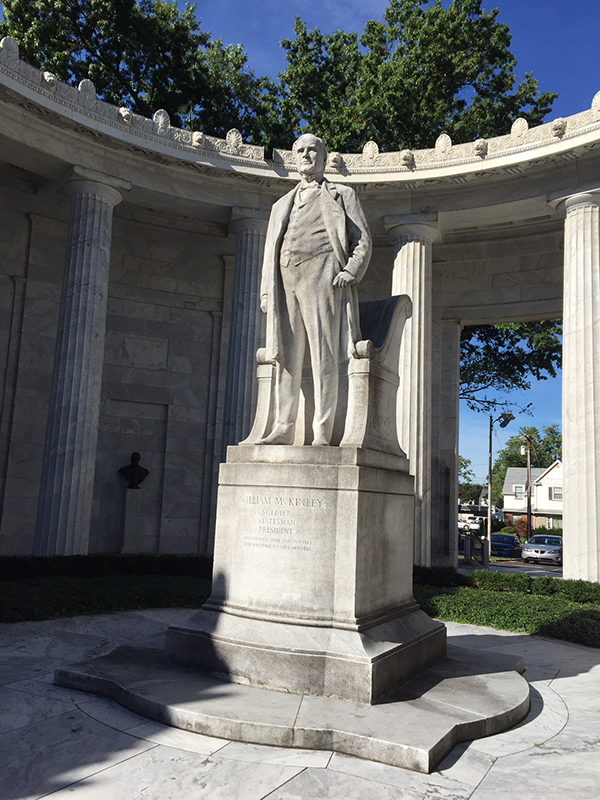
National McKinley Birthplace Memorial, Niles
It is hard to get a true, accurate read on county-level voting before the election, but there’s wide agreement, based on county demographics and anecdotal reports, that at the very least Trump will perform better in Trumbull County than Romney did.
Mahoning County (Youngstown), which is more Democratic than Trumbull, should also end up performing worse for Clinton than it did for Obama. But it seems like a stretch to think Trump could actually win it: for one thing, the county has a higher percentage of African Americans than the state as a whole, and its anchor city, Youngstown, is nearly half African American, and Obama won the county by 28 points in 2012. Such a turnabout just seems like a bridge too far barring Trump winning by a decent margin nationally, but the very suggestion of Mahoning going red in a competitive election is a notable one given the county’s longstanding Democratic tradition.
In any event, Trump winning Trumbull, as well as its northern neighbor, Ashtabula, is very much in play, and perhaps even Mahoning, too.
Clinton can afford some erosion in Ashtabula-Mahoning-Trumbull: Obama won the counties by 63,316 votes, and he won statewide by 166,272. But if the Mahoning Valley swings hard against Clinton in favor of Trump, other counties will as well. Appalachian Ohio down south from Youngstown has already trended strongly Republican in recent years, going back to 2000. But Trump can run ahead of Romney in that region, too. And there are lots of other blue collar areas, including the west side of Cleveland, parts of greater Toledo and Columbus, and other areas where Trump will have more appeal than Romney.
But there are some communities in Ohio where some Romney voters will be aghast at voting for Trump and might even switch to Clinton. Delaware County is a prime example: It’s almost impossible to imagine Clinton carrying the county, but it’s also hard to see Trump matching Romney’s 61% of the vote there. And the county has been very subtly moving Democratic relative to the state anyway over the past few elections. Democrats recently sent Tim Kaine’s wife, Anne Holton, to campaign in Delaware, and the Clinton campaign sees some potential for an overperformance in the county.
Trump doing significantly worse in Delaware than any recent Republican, with perhaps a bigger-than-expected protest vote for Libertarian Gary Johnson, seems like a real possibility. More importantly, it seems possible, perhaps even likely, that Clinton will best Obama’s margin in Franklin County (Columbus), which has been trending hard to the Democrats in recent years, much like other growing urban counties across the country. A couple of unreleased internal polls from local Democrats showed Clinton up 28 and 21 points, respectively, in Franklin County (one was from early summer, while the other was from a couple of weeks ago). Obama won the county by 23 points, so Clinton is either effectively matching or exceeding that. Northern Franklin County and southern Delaware County together make up a populous, wealthy, well-educated suburban/exurban zone where Trump’s message of post-industrial decline is a poor fit for a growing area, particularly because the Columbus area was never nearly as reliant on heavy industry as Northeast Ohio.
There are a number of counties like Delaware across the state: well-educated, suburban, growing, and Republican. These include Warren (near Cincinnati); Greene (near Dayton); and Geauga (near Cleveland). Warren in particular merits watching. It is very Republican — Romney got 69% of the vote — and it is second only to Delaware in terms of education level and median income. Clinton has no chance to win it, but chipping away at Romney’s margin even slightly could help her make up what she might lose in Appalachian Ohio.
Hamilton County (Cincinnati) itself once was one of the more Republican urban counties in the country, but it voted more Democratic than the state for the first time since the Great Depression in 2008 and 2012, and winning it is probably a necessity for Clinton.
The overall point here is that it’s easy to imagine there being some big swings from 2012 in different parts of Ohio, but it may be that those swings largely cancel themselves out, giving Clinton a path to win the state despite Trump’s seeming advantages.
Conclusion: How much change is there in 2016, and how much of it is permanent?

Tappan Lake in Harrison County
So is the sun setting on the Ohio bellwether?
The quote at the top of this article is a funny quip from JFK about his troubles in Franklin County. Kennedy did in fact lose Franklin County handily — Nixon won it by nearly 20 points. That was a peculiar election, and not just because Ohio voted for the loser. It’s also because the electorate changed that year quite dramatically on account of Kennedy’s religion.
JFK was just the second Catholic major party presidential nominee. Al Smith, the Democratic governor of New York, was the first, losing in a landslide to Herbert Hoover (R) in 1928.
The 1960 election was defined by a Catholic vs. Protestant split. Kennedy narrowly won the election by improving on 1956 Democratic nominee Adlai Stevenson’s performance with Catholics by 27 percentage points, according to Gallup, while hardly moving the numbers at all from four years prior with Protestants.
This pattern jumps off the page in Ohio when looking at county-level election statistics. Nowhere in the state did Kennedy improve his performance over Stevenson more than in two northwest Ohio counties, Mercer and Putnam. Both counties are, to this day, the only two majority Catholic counties in Ohio. Franklin County, on the other hand, is and was less Catholic than the state, and thus Kennedy’s improvement there from 1956 was comparatively mild. Kennedy’s problem was that in the 1950s and 1960s Ohio had a slightly bigger Republican lean than it does now, and that Ohio wasn’t as Catholic as it needed to be to overcome that lean back then.
The reason I bring up this point is merely to say that the Catholic vs. Protestant split in 1960 was not permanent. Counties like Mercer and Putnam remain heavily Catholic but have been voting overwhelmingly Republican for decades, while a county that is less Catholic than the statewide average, Franklin, has trended very Democratic over the last two decades. So too has a fairly Catholic county, Hamilton. How Catholic or not Catholic a place was meant a whole lot in 1960, but it doesn’t mean much of anything, politically, nowadays.
The relevant question today, as it pertains to both Trump’s chances in Ohio in this election, as well as whether Ohio remains a bellwether of national political opinion going forward, is how much does Trump truly improve on typical GOP performance among whites who do not have a college degree, how much does he fall off with whites who do have a college degree, and how much do those changes persist over time?
If the answer to those questions are, respectively, a lot, not much, and yes, then Ohio very well could go the way of Missouri: A one-time bellwether that wandered away from the flock. But if the changes are minor, or if they are ones that do not persist past Trump, then the Ohio bellwether may very well endure, even if — as in 1960 — the state doesn’t actually vote for the winner this year.
Kyle Kondik is a Political Analyst at the Center for Politics at the University of Virginia.
Geoffrey Skelley is the Associate Editor at the Center for Politics at the University of Virginia.
See Other Political Commentary by Kyle Kondik
See Other Political Commentary
Related Articles

Rasmussen Reports is a media company specializing in the collection, publication and distribution of public opinion information.
We conduct public opinion polls on a variety of topics to inform our audience on events in the news and other topics of interest. To ensure editorial control and independence, we pay for the polls ourselves and generate revenue through the sale of subscriptions, sponsorships, and advertising. Nightly polling on politics, business and lifestyle topics provides the content to update the Rasmussen Reports web site many times each day. If it's in the news, it's in our polls. Additionally, the data drives a daily update newsletter and various media outlets across the country.
Some information, including the Rasmussen Reports daily Presidential Tracking Poll and commentaries are available for free to the general public. Subscriptions are available for $4.95 a month or 34.95 a year that provide subscribers with exclusive access to more than 20 stories per week on upcoming elections, consumer confidence, and issues that affect us all. For those who are really into the numbers, Platinum Members can review demographic crosstabs and a full history of our data.
To learn more about our methodology, click here.