An Electoral College Time Capsule
A Commentary By Kyle Kondik
KEY POINTS FROM THIS ARTICLE
— The six presidential elections held during the 25-year history of the Center for Politics were often close, although most states voted predictably.
— As part of a time capsule we are putting together to be opened at the center’s 50th anniversary in 2049, we are asking our future students to consider what has changed and what has stayed the same.
— Had we done the same exercise when the center was founded 25 years ago, we would have seen an Electoral College alignment from 1976-1996 that looked a lot different than what we’ve become familiar with this century.
The past (and future) of the Electoral College
This past weekend, we celebrated the 25th anniversary of the Center for Politics at the University of Virginia. That included breaking ground on an expansion of our home base at UVA and a variety of other fun events.
Part of our celebration was creating a time capsule that will be opened in 2049, for the Center for Politics’ 50th anniversary. The time capsule includes all sorts of political relics, and one of the things we are going to include is… this article.
So we’re speaking both to our current readers as well as the students of the future. The topic, naturally for us, is the course of American presidential elections.
There are all sorts of big picture questions one could ask about what presidential elections might look like in 2049—there are slated to be seven of them between now and then, including the election coming up later this year. From the perspective of 2024, some may wonder whether we even will have regular (and real) presidential elections every four years, given modern-day concerns about authoritarianism. Assuming that those fears do not come to pass, will the basic method of presidential elections be the same? Will the Electoral College still be in place? It is hard for us in 2024 to imagine that it wouldn’t be.
Will almost all of the states award their electoral votes in a winner-take-all fashion, with the exception of Maine and Nebraska, which award some by congressional district? (As we are writing this, there is an effort afoot by Republicans to make Nebraska winner-take-all in an effort to help the presumptive Republican nominee, Donald Trump).
Beyond these big-picture questions, there are the voting patterns by state. That is what we mainly wanted to focus on here.
Over the course of the Center for Politics’ first 25 years, there have been six presidential elections (2000-2020). Five of these six elections were close and competitive, decided by less than 5 points in the national popular vote; two of those six involved the winning candidate losing the popular vote (Republicans George W. Bush in 2000 and Trump in 2016). The parties split these six elections, with Republicans winning the Electoral College in 2000, 2004, and 2016, and Democrats winning in 2008, 2012, and 2020.
Despite these close results, the lion’s share of the states have voted predictably for one side or the other over these six elections. Map 1 shows how the states voted from 2000-2020, along with their number of Electoral College votes following the 2020 census. We analyzed these trends in depth, election by election, in late 2022 at this link: https://centerforpolitics.org/crystalball/the-electoral-college-in-the-21st-century/. (Does the link still work? Is this all horribly antiquated for you, 2049 reader? We suspect so!)
Map 1: Electoral College voting patterns, 2000-2020
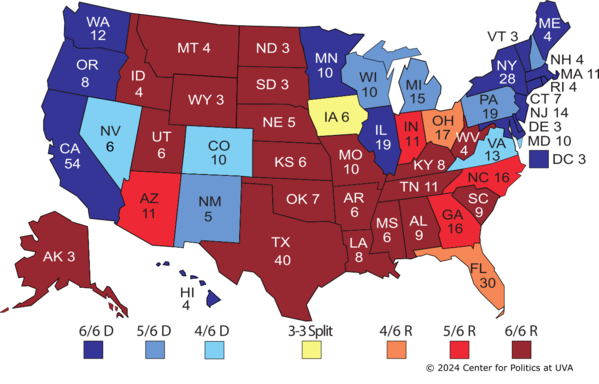
Among the questions we would ask the students of the future to consider as they study this map are:
— How many of these states vote the same way they did in the 2000-2020 timeframe? Are there any major shifts? Go through the elections that have happened leading up to when you’re opening this—how many states vote very consistently one way or the other?
— It is nearly impossible for us to imagine anything other than a Democratic or Republican presidential nominee winning a state—from the perspective of right before the 2024 election, the last third party candidate to win a state was segregationist Dixiecrat George Wallace in 1968. Have any third party candidates won a state in your era? The Republican and Democratic parties have been the two major parties in the United States since right before the Civil War of 1861-1865 (please don’t tell us there has been a second one). Do these parties still exist? Again, we suspect that they will.
— Leading into the 2024 election, the most recent election where a presidential candidate won the national popular vote by a double-digit margin was Ronald Reagan in 1984. Has anyone done that in your era? The 20th century had many blowout presidential elections; the 21st has not (really, only Barack Obama’s 2008 win qualifies, and it paled in comparison to 20th century landslides).
— One of our spring 2024 interns, Eli Bardash, posed the following question: “How rapidly and how consistently did the ‘Blue Wall’ of the Midwest crumble (if it did, which I presume it will) and has the Sun Belt gotten bluer as a sort of trade-off with the Midwest?” The “Blue Wall” refers primarily to the Industrial North states Wisconsin, Michigan, and Pennsylvania, which together voted Democratic in five of the six elections from 2000-2020; the one exception was 2016, when the region provided the pivotal electoral votes for Trump. Relative to the nation, these states became less Democratic over the first couple of decades of the 21st century, while some key states in the Sun Belt (Arizona and Georgia specifically, which backed Joe Biden in 2020 after voting uniformly Republican in the five elections prior) became less Republican-leaning. The aforementioned states were some of the few regarded as winnable by either side in the 2024 election, so we are keenly interested in the trends in those states. Are these states still vitally important in the late 2040s?
We suspect that there will in fact be a lot of change over the next 25 years, because there certainly was in the 25 years before the Center for Politics opened.
Map 2 shows how the states voted from 1976-1996, with the electoral vote tallies listed from the post-1990 census era (as the 2000 census was still in the future). Had we done a similar time capsule back in the late 1990s, when the center opened, these are the elections we would have included in a look back at the previous quarter century.
Map 2: Electoral College voting patterns, 1976-1996
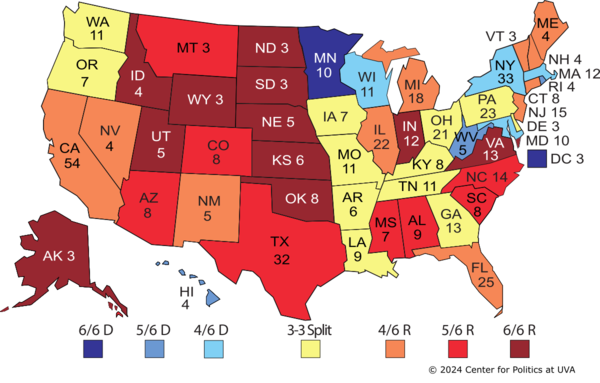
Another spring 2024 Crystal Ball intern, Elizabeth Hardin, looked at Maps 1 and 2 and pondered the following: “The main thing that jumped out at me was the fact that most states have become more solidified in their party leaning—there were far less 3/3 splits in 2000-2020 compared to 1976-1996. I’m wondering why exactly this was, and if this trend will continue in the next 20 years.”
To Elizabeth’s point, we’d note that from 2000-2020, only 15 states voted at least once for either party. In the 1976-1996 range, it was more than double that, 38.
Here’s at least a partial explanation: Just like in the 2000-2020 period, the 1976-1996 period included three Electoral College victories for each party: 1976, 1992, and 1996 for Democrats and 1980, 1984, and 1988 for Republicans. But unlike the 2000-2020 period, the 1976-1996 period was not broadly competitive: only the 1976 election featured a national popular vote decided by less than 5 points, and that was also the only election in that timeframe where the winning candidate got less than 370 electoral votes (no one got to 370 in the 2000-2020 time period, although Obama came close in 2008, winning 365). So a greater number of blowouts contributed to more diversity in how the states voted.
The landslide victories by the Republicans from 1980-1988 also give the overall map a red tint, as the most states the Democrats won in any of those three elections was 10 (plus the District of Columbia), by Michael Dukakis in 1988. Even in their worst election of the 21st century, 2008, Republicans still carried 22 states.
Here’s what stands out to us as we compare the two maps:
— Some of the state-level patterns of the late 20th century persisted through the first six elections of the 21st century. The five states running from the northern Texas border all the way to the Canadian border have continued to vote reliably Republican for president, as have some other western states: Idaho, Utah, and Wyoming. It wouldn’t surprise us if these states continued their Republican streaks for another quarter century.
— Minnesota was the only state that voted Democratic in every election from 1976-1996 thanks to its lonely support of home-state candidate Walter Mondale in Ronald Reagan’s 49-state sweep in 1984. So it is the only dark blue state on both maps, although Republicans have come fairly close to carrying it a few times despite that streak.
— Our home state of Virginia has become the most reliably Democratic of the 11 states that made up the Civil War-era Confederacy (the classic definition of “The South” in political science), and it’s the only state in the region that voted for the Democrats in a majority of the elections from 2000-2020. But in the 1976-1996 period, it was the only southern state that didn’t vote Democratic even once (the rest of the South backed southerner Jimmy Carter in 1976, and several other southern states backed another southerner, Bill Clinton, in one or both of his presidential victories).
— An interconnected group of eight states, running broadly east to west from Delaware, Pennsylvania, Ohio, Kentucky, Tennessee, Missouri, Arkansas, and Louisiana, voted for the winning presidential candidate in all six of the 1976-1996 elections. Four additional states—Georgia, Iowa, Oregon, and Washington—also split three to three in this era, although they did not consistently vote for the winning candidate. In the 2000-2020 era, only Iowa split three to three, but it voted for losing candidates twice (Al Gore in 2000 and Trump in 2020). Notably, no state voted for the winning candidate in all six of the 2000-2020 elections.
— Several states that we think of as being very firmly Democratic in the early 2020s voted more often for Republican candidates in the 1976-1996 period: California, Connecticut, Illinois, New Jersey, and Vermont all voted for Republicans in four of those six elections, but they voted Democratic for president in every one of the 2000-2020 elections.
— West Virginia had, by 2020, become one of the most Republican states in the country, but in the last quarter of the 20th century, it was one of the states likeliest to vote Democratic for president.
One caveat, and a possible explanation if in fact there is not a lot of change in how states voted in the 2020s, 2030s, and 2040s, is that a big story of the second half of the 20th century was the parties becoming more ideologically cohesive. The conservative Democrats and liberal Republicans that used to be more numerous gradually became extinct, and the Republican Party became more consistently right-wing and the Democratic Party became more consistently left-wing. That ideological alignment of the parties has likely contributed to this more stable era of partisan voting, but it also contributed to what many of us see as a troubling pattern of intense polarization by party. Another spring 2024 intern, Tanish Gupta, asks: “What is political polarization like in 25 years? What has contributed more to it? Or what resulted in it decreasing?”
It is possible that there will be big changes coming to how the states vote just a few months from when we are writing this. At least some polling for the upcoming 2024 election shows erosion for Democrats among groups that typically are very supportive of them, like young people as well as Black and Hispanic voters, while Democrats are doing a bit better with older voters, who typically vote right of center. These are the sorts of demographic questions we are pondering in 2024—those reading this in 2049 will know whether these polls were picking up on real trends, but you also will have your own questions about the future shape of your own political era. Perhaps you can pose them to your successors in your own time capsule.
Kyle Kondik is a Political Analyst at the Center for Politics at the University of Virginia and the Managing Editor of Sabato's Crystal Ball.
See Other Political Commentary by Kyle Kondik.
See Other Political Commentary.
Views expressed in this column are those of the author, not those of Rasmussen Reports. Comments about this content should be directed to the author or syndicate.
Related Articles

Rasmussen Reports is a media company specializing in the collection, publication and distribution of public opinion information.
We conduct public opinion polls on a variety of topics to inform our audience on events in the news and other topics of interest. To ensure editorial control and independence, we pay for the polls ourselves and generate revenue through the sale of subscriptions, sponsorships, and advertising. Nightly polling on politics, business and lifestyle topics provides the content to update the Rasmussen Reports web site many times each day. If it's in the news, it's in our polls. Additionally, the data drives a daily update newsletter and various media outlets across the country.
Some information, including the Rasmussen Reports daily Presidential Tracking Poll and commentaries are available for free to the general public. Subscriptions are available for $4.95 a month or 34.95 a year that provide subscribers with exclusive access to more than 20 stories per week on upcoming elections, consumer confidence, and issues that affect us all. For those who are really into the numbers, Platinum Members can review demographic crosstabs and a full history of our data.
To learn more about our methodology, click here.