A Deeper Dig into the Granite
A Commentary By J. Miles Coleman and Kyle Kondik
The Trump, Haley, and Biden coalitions in the New Hampshire primary.
KEY POINTS FROM THIS ARTICLE
—With a lull in the primary calendar, we thought we’d take a closer look at last week’s New Hampshire primary.
—Nikki Haley’s town-level victories were confined almost exclusively to places that Joe Biden carried in the 2020 general election.
—Although Biden showed some weakness in a few of the state’s larger cities, he carried nearly every town in the state.
—The GOP primary saw the most raw votes cast of any New Hampshire primary contest, but that was driven in part by participation from voters who likely won’t be voting Republican for president in the fall.
The New Hampshire results
After looking ahead to the New Hampshire primary for months on end, it can be easy to just quickly move on after it happens. But it may be that the New Hampshire primary ends up being the most competitive presidential nominating contest on either side this year, and we thought it merited taking a closer look at what happened after the dust settled. What follows is an analysis of Nikki Haley, Donald Trump, and Joe Biden’s performances in New Hampshire, a look at the turnout, and some thoughts on the ongoing dispute between New Hampshire and national Democrats over the presidential nominating calendar:
1. Where Haley did well
Despite eventually losing the New Hampshire primary, Haley began with some welcome news: shortly after midnight on Primary Day, she unanimously carried the town of Dixville Notch. The voters of Dixville, up in the northern reaches of the state, have a quirky yet enduring tradition of casting their ballots at the earliest time possible on Election Day. However, unfortunately for Haley, Dixville, which cast just 6 votes, has not picked a Republican winner since 2008, and that streak continued into 2024.
But even with a small sample size, Dixville’s vote did have some predictive value: in 2016, the last contested GOP primary in the Granite State, it was among the 15 towns that then-Ohio Gov. John Kasich carried (he earned 3 votes to Donald Trump’s 2). Moving into the more populous areas of the state, Haley would perform well in towns that Kasich, a relative moderate who would go on to endorse Joe Biden in 2020, carried.
As we pointed out last week, in our initial reaction to the results, Haley’s best town was Hanover, which houses Dartmouth College. Eight years ago, it was also Kasich’s best town (at least among the towns that cast more than a few votes)—his 42% there was significantly lower than the 86% that Haley earned, but the 2016 field was fractured. Other Kasich towns that went heavily for Haley included Jackson, a popular destination for those looking to ski or hike the White Mountains, and New Castle, a tourism-heavy town along the Seacoast. All in all, Haley carried 12 of Kasich’s 15 towns—she tied Trump in another, and the other two cast either no or very few votes in 2024.
Just carrying the Kasich towns, though, was hardly enough for a majority. In a Republican primary, Haley was reliant on a coalition of moderate and former Republicans and independents.
Before the primary, Sam Quinn, who has been a valuable source for Granite State insights and data, posted a map highlighting several categories of towns across the state. As election returns rolled in, this helped us make sense of the results (along with a Crystal Ball analysis from the University of New Hampshire’s Dante Scala, which dovetails with Quinn’s preview). Map 1 is what Quinn produced.
Map 1: Towns to watch in the New Hampshire primary
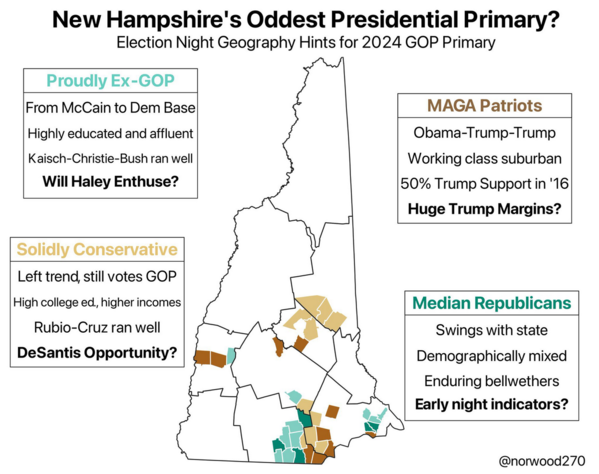
As expected, Haley’s base was the “Proudly Ex-GOP” category, where she carried 9 of the 10 towns highlighted (she came within 3 points of carrying the 10th). Geographically, most of those towns are clustered between Nashua and Manchester, as well as near the Seacoast. However, basically by definition, these types of areas are becoming less influential in Republican primaries.
Statewide, turnout was up 15% and 31% from the 2016 and 2012 GOP primaries, respectively (more on that below). The Proudly Ex-GOP towns cast more raw votes than they did in those previous years but clocked in at half the statewide increases: they were up only 7% from 2016 and only 15% from 2012. On the other end of the spectrum, the MAGA Patriot towns saw an 18% increase over their 2016 vote totals and an astounding 44% increase over 2012.
2. Where Trump did well
This brings us to Trump. Aside from, expectedly, sweeping the MAGA Patriots category, he carried all but one of the Solidly Conservative towns and, perhaps more tellingly, won each of the Median Republicans towns. In fact, Manchester, the largest municipality in the state, was the sole Median Republicans constituency that gave Trump a double-digit percentage margin—he carried it 56%-41%—and it provided his largest raw vote margin in the state.
In 2016’s crowded field, Trump claimed majorities in six towns, although only four of them cast more than 100 votes. Those four towns basically hugged the southeastern border with Massachusetts. Running west to east, they were: Pelham, Danville, Newton, and Seabrook. Last week, Trump took over 65% in each, with his best being Seabrook (this also was his best town in 2016 of places that cast more than a tiny number of votes). Generally, towns in this area have income on par with many of the towns just to the west, between Manchester and Nashua, but have lower college attainment rates.
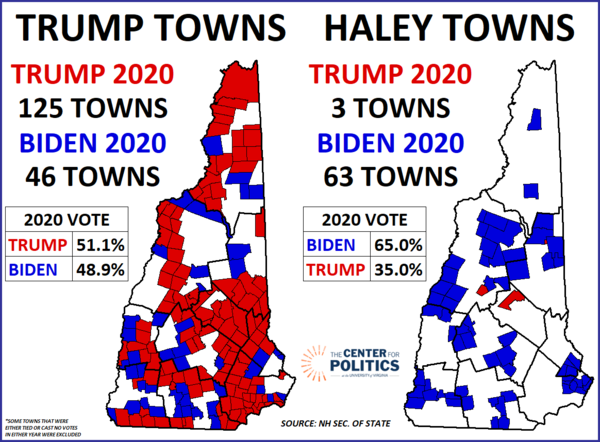
When discussing Haley’s best areas, we noted that she tended to perform better in areas that have been drifting away from Republicans in general elections. Well, the reverse was true for Trump. As Map 2 shows, nearly all of the towns that supported him in the 2020 general election backed him against Haley—and he was also competitive in the Biden-won towns, winning 46 of them to Haley’s 63.
Map 2: Trump and Haley towns by 2020 vote
3. Where Biden did well
Meanwhile, on the Democratic side, Biden won the state’s unsanctioned primary as a write-in candidate, taking just under 65% of the overall vote. Biden’s most formidable competitor—and we are being somewhat charitable by using that description—was Rep. Dean Phillips (D, MN-3), who saw several millions spent on his behalf only to take about 20% of the vote. Marianne Williamson, a 2020 Democratic candidate, ran again but was not much of a factor, as she won only 4%—she finished with a little more than 5,000 votes in total, which was only slightly more than the roughly 4,760 write-in votes that Haley received on the Democratic side (the vote totals are not official yet, so we are trying to avoid citing absolute figures in instances like this, but we’d be surprised if these numbers change markedly).
Considering the entire field, Biden took pluralities or majorities in 236 of the 237 towns that cast votes. The sole town that Biden did not carry was Hill, which Phillips carried by a single vote, 40 to 39—as an aside, this reminded us of Trump’s near-sweep of Iowa’s counties last month, where he won every county except Iowa City’s Johnson, which Haley claimed by one vote. One small note here is that the town of Landaff, where Phillips currently leads with 6 votes, has not tabulated its write-in votes, so we are assuming Biden eventually takes the lead there (again, the results are still somewhat in flux).
In any case, Map 3 considers Biden’s showing compared to the combined strength of his opposition.
Map 3: Biden vs not-Biden vote
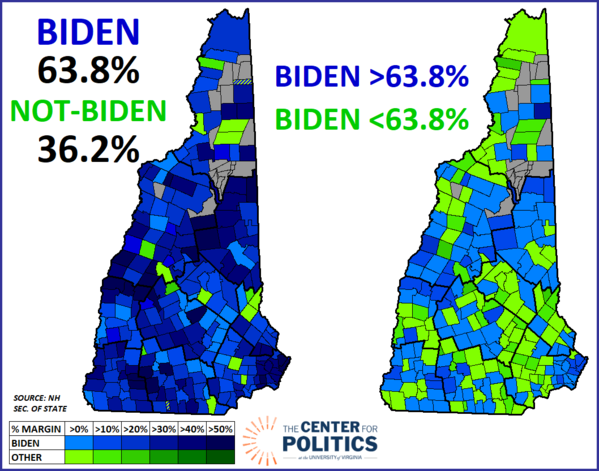
As the first image on Map 3 shows, Biden took more votes than his combined opposition in all but 18 towns. Scattered across the state, most of the not-Biden towns also gave Trump two-thirds or more in the Republican primary, so protest voting against Biden could have been a factor. Overall, a familiar pattern seems to emerge: some of the darkest blue (most pro-Biden areas) tended to pop up near the Seacoast, on the western border in Dartmouth College’s orbit, and in northern Carroll County on the cusp of the White Mountains.
On the second image in Map 3, the blue towns gave Biden a share better than what he got statewide, 63.8%, while his margins in the green towns were less than that. We’d note that both Manchester and Nashua are green on this map—the former gave him only 54%, though in the latter, he fell only barely short of his statewide share.
As a bit of an aside, there was a campaign on the Democratic side to write “Ceasefire” in on the ballot, to protest Biden’s policies vis-à-vis the ongoing Middle East conflict. In total, Ceasefire earned a little more than 1,500 votes. Ironically, Biden tended to run especially well in the most pro-Ceasefire towns. The 10 towns that gave Ceasefire the highest share of the vote also gave Biden 69%, a few points better than his statewide share.
4. New Hampshire turnout and sifting for November signals
Over the course of the primary season, we suspect that we and others will be taking a look at primary turnout to try to divine some clues about enthusiasm for the November campaign. This may or may not be a useful exercise—although maybe it’ll be a good way of filling time during what is shaking up to be a fairly uncompetitive primary season on both sides.
So far on turnout, those looking to the first two contests for clues on the Republican side could only find mixed signals.
In Iowa, GOP turnout was very low, just about 110,000, way down from the roughly 187,000 who voted in the 2016 Republican caucus. As we and others noted at the time, it’s possible that severe weather in Iowa dampened turnout. But in New Hampshire, turnout was historically high on the Republican side, at least in terms of raw votes cast. But as we’ll explore further below, the GOP primary electorate was hardly just restricted to hardcore Republican partisans.
About 325,000 people voted in the Republican primary, the first time a presidential primary in New Hampshire surpassed the 300,000 mark on either side. Table 1 shows the number of Democratic and Republican votes cast in New Hampshire primaries going back to 1972, which is generally regarded as the start of the modern national presidential nominating system (the New Hampshire presidential primary itself dates all the way back to 1916).
Table 1: Presidential primary voting in New Hampshire, 1972-2024
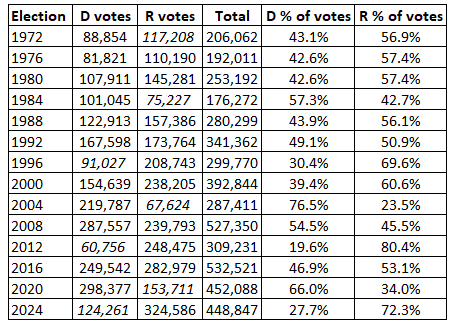
Notes: Italics indicates an incumbent president who only faced minor opposition.
Source: New York Times for 2024 New Hampshire results; New Hampshire Public Radio for 1972-2020 results.
Prior to this year’s GOP primary, the 2020 Democratic primary stood out for the highest raw vote total turnout in the history of the New Hampshire primary, while then-President Donald Trump attracted good Republican turnout compared to other years where an incumbent was running without significant opposition. President Joe Biden was a write-in candidate this year, winning about 64% of the total votes cast on the Democratic side; about 125,000 people participated in the Democratic primary, which we’d also classify as a contest featuring an incumbent president who was not strongly opposed (unlike, for instance, Jimmy Carter in 1980 or George H.W. Bush in 1992). Overall, the total combined votes cast in the Democratic and Republican primaries in 2024 was around 450,000, very similar to 2020. Total votes eclipsed 500,000 in only 2008 and 2016, when both sides had active, competitive primaries with no incumbent on the ballot.
Republican primary voters made up 72% of the total vote, while Democratic voters made up 28% of the total vote. This is roughly comparable to years like 1996, 2004 and 2012, when Bill Clinton, George W. Bush, and Barack Obama were renominated without notable opposition while the other party had a competitive primary. We wouldn’t read anything into this for the fall.
It seems fairly clear that a decent number of typically Democratic voters who are registered as undeclared opted to vote in the Republican primary. According to the Associated Press/Fox News voter analysis conducted by NORC at the University of Chicago—an alternative to the exit poll conducted by Edison Research for a variety of news outlets—only 76% of the Republican primary electorate said they considered themselves a Republican or leaned toward the Republicans, while 13% thought of themselves as independent and 10% considered themselves a Democrat or leaned toward the Democrats. This helps explain the finding from the same poll that 34% of Republican primary respondents said they wouldn’t vote for Trump if he was the Republican nominee.
In the Democratic primary portion of the poll, a much larger percentage of respondents—95%—said they considered themselves Democrats or leaned toward the Democrats. Of the Democratic primary respondents, 12% said they wouldn’t ultimately vote for Biden if he was the Democratic nominee, a figure about 20 points lower than the share of Republican voters who said they wouldn’t vote for Trump.
But the share of self-identified Democrats was also 20 points higher in the Democratic primary than the share of self-identified Republicans in the Republican primary. So it makes sense that the level of loyalty to Biden in the Democratic primary would be higher than the level of loyalty to Trump in the Republican primary, and once one accounts for the different composition of the electorates, the poll may not actually indicate that Trump is in greater danger of partisan defections than Biden is.
One other thing: This same dynamic should caution us from citing the New Hampshire primary turnout as being indicative of a highly-engaged Republican electorate, because a decent chunk of the participants should not be considered part of the likely Republican electorate for the fall.
5. For Democrats, the New Hampshire question lingers
The standoff between New Hampshire and the Democratic National Committee, in which the DNC attempted to move New Hampshire from its “first in the nation” primary status, is the reason why Biden did not appear on the ballot there and instead won as a write-in. This conflict remains unresolved for future Democratic contests—specifically, the 2028 presidential nomination contest that likely will be hotly contested as Biden, win or lose in November, seems certain to be competing in his final election.
Despite the New Hampshire dispute, Biden and the Democratic National Committee did at least partially solve the demographic problem in the party’s primary calendar that the 2020 nomination season laid bare: Black voters are such an important part of the Democratic Party coalition but did not really get to weigh in on the party’s presidential nominee until the fourth contest.
Back in 2020, Iowa and New Hampshire—both of which have overly white electorates—voted at the start of the calendar, followed by Nevada, which is more diverse than those states but does not have a huge Black electorate (the 2020 entrance poll for the caucus there suggested that just about 10% of participants were Black). South Carolina, where the primary electorate is more than half Black, was the fourth contest, and it eventually set Biden on the path to the nomination after his painfully slow start. The DNC’s preferred plan was to have South Carolina vote first with New Hampshire and Nevada voting together a few days later.
While the DNC was unable to sideline New Hampshire, the party did succeed in sidelining Iowa, which still technically held caucuses on Jan. 15 but is conducting its presidential preference vote through a mail-in process, the results of which will be released on Super Tuesday. Iowa Democrats are hoping for a return to prominence but we suspect their demotion in the calendar is going to stick.
Looking ahead, it may be that a solution to the Democrats’ calendar problem is staring them right in the face: codifying what happened in 2024 as their 2028 plan.
While New Hampshire is not the ideal kickoff state for the more racially diverse Democratic Party, it’s less of a problem if it’s just New Hampshire kicking off the nomination season, as opposed to Iowa and New Hampshire. The Democrats could accede to New Hampshire’s granite resolve to stay at the front of the calendar, but then place South Carolina and Nevada next in line after New Hampshire to hear from electorates that are more racially diverse and less dominated by white liberals. Combined, the three states provide a decent cross-section of the Democratic electorate.
Meanwhile, leading off with Iowa and New Hampshire is less of an issue for Republicans, as their party’s primary electorate is not nearly as racially diverse as the Democrats’ electorate is (according to 2016 primary exit polls, even racially diverse states like Florida and Texas still had Republican primary electorates that were around 80% white).
The party does have diversity in other ways, though—for instance, Iowa is more religious and more ideologically conservative than New Hampshire, which itself is less religious and less conservative than many other Republican electorates that follow it on the calendar. From that standpoint, Republican candidates who can appeal to both Iowa and New Hampshire GOP electorates can demonstrate broad appeal within the party—something that Donald Trump just did through winning a little more than half the vote in each state.
J. Miles Coleman is an elections analyst for Decision Desk HQ and a political cartographer. Follow him on Twitter @jmilescoleman.
Kyle Kondik is a Political Analyst at the Center for Politics at the University of Virginia and the Managing Editor of Sabato's Crystal Ball.
See Other Political Commentary by J. Miles Coleman.
See Other Political Commentary by Kyle Kondik.
See Other Political Commentary.
Views expressed in this column are those of the author, not those of Rasmussen Reports. Comments about this content should be directed to the author or syndicate.
Related Articles

Rasmussen Reports is a media company specializing in the collection, publication and distribution of public opinion information.
We conduct public opinion polls on a variety of topics to inform our audience on events in the news and other topics of interest. To ensure editorial control and independence, we pay for the polls ourselves and generate revenue through the sale of subscriptions, sponsorships, and advertising. Nightly polling on politics, business and lifestyle topics provides the content to update the Rasmussen Reports web site many times each day. If it's in the news, it's in our polls. Additionally, the data drives a daily update newsletter and various media outlets across the country.
Some information, including the Rasmussen Reports daily Presidential Tracking Poll and commentaries are available for free to the general public. Subscriptions are available for $4.95 a month or 34.95 a year that provide subscribers with exclusive access to more than 20 stories per week on upcoming elections, consumer confidence, and issues that affect us all. For those who are really into the numbers, Platinum Members can review demographic crosstabs and a full history of our data.
To learn more about our methodology, click here.