Just How Many Obama 2012-Trump 2016 Voters Were There?
A Commentary By Geoffrey Skelley
Using different surveys to try to answer an oft-asked question
In the immediate aftermath of the 2016 presidential election, many observers understandably focused on the numerous places that swung from Barack Obama to Donald Trump. Because many of these areas congregated in swing states within the Rust Belt and Midwest, they played a pivotal role in Trump’s victory, as shown by the movement toward the GOP in Map 1 below. But how many total voters really switched from Obama to Trump in 2016? Different data sources tell a different story, but the answer is certainly in the millions.
Map 1: Change in Republican margin by county or county-equivalent, 2016 versus 2012
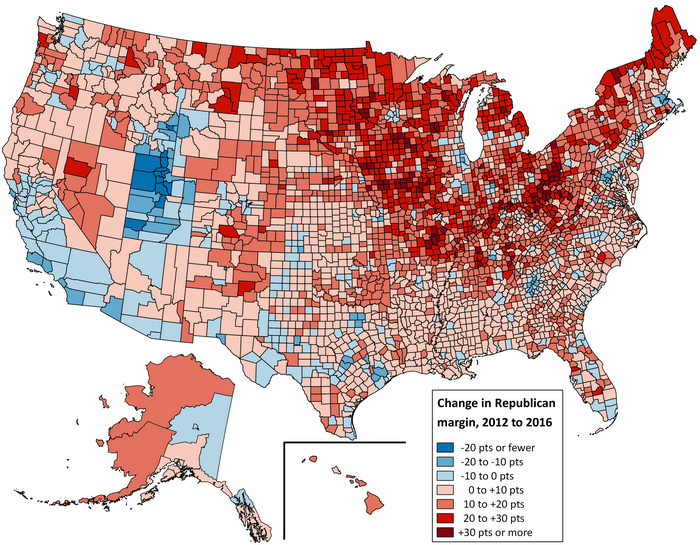
Note: Alaska’s results are displayed by state senate districts. Click to enlarge.
Sources: Election data from Dave Leip’s Atlas of U.S. Presidential Elections and Daily Kos Elections for Alaska’s state senate districts; map shape files from the U.S. Census Bureau.
We looked at three sources to try to gauge the raw number of voters who backed Obama in 2012 but then voted for Trump in 2016. Unfortunately, the 2016 exit poll did not ask respondents about their 2012 vote, having last done so in 2008. While exit polls are imperfect, it at least would have served as another data point.
At present, two regular national election studies have released 2016 data: the American National Election Study and the Cooperative Congressional Election Study. Both asked respondents about their 2016 vote but also inquired whether or not they voted in 2012 and for whom they voted. In addition to these studies, the University of Virginia Center for Politics recently partnered with Public Opinion Strategies to survey the attitudes of Trump voters, and as a part of that poll, respondents were asked about their prior voting history. Together, these three surveys allow us to roughly estimate the number of Obama 2012-Trump 2016 voters.
However, there’s an important caveat: self-reported past voting behavior has limited value. Voters do not always accurately recall the past. Academic research has found that a number of different factors can explain these discrepancies. Bias toward current political preferences can affect responses, as can simple forgetfulness — as much as it may surprise hardcore politicos, many Americans don’t necessarily remember their voter information with precision. While four years doesn’t seem like a very long time, one Dutch study found that the probability of someone consistently recalling their vote fell by about six percentage points over 3.5 years. Moreover, voters may remember a previous winner better than a loser, and thus some people who voted for the prior loser may not remember if they voted, while others will misremember voting for the winner.
Another consideration is sample error — always a challenge. Any estimate of a population has some margin of error. And some of the study data remain preliminary. For example, the CCES will release updated data after validating the votes for respondents in an effort to gain greater accuracy.
These considerations mean that the estimates below should be treated with caution. They are our best data-informed guesses.
American National Election Study
Overall, 59% of respondents in the 2016 ANES reported voting in both 2012 and 2016, with 68% claiming to have voted in 2012 while 74% voted in 2016. Of the 2012 and 2016 voters, 6% of all voters supported Trump while reportedly backing Obama in 2012. Conversely, just 2% reported voting for Mitt Romney in 2012 while casting ballots for Hillary Clinton in 2016.
We then examined each candidate’s base of support by respondents’ reported 2012 vote. The ANES data show that just over 13% of Trump’s voters backed Obama in 2012, while about 4% of Clinton’s support came from voters who voted for Romney in 2012. Going across the rows in Table 1, we get the breakdown by 2012 vote for those who backed each 2016 vote choice.
Table 1: Makeup of Clinton and Trump voters by 2012 presidential vote, based on the 2016 ANES
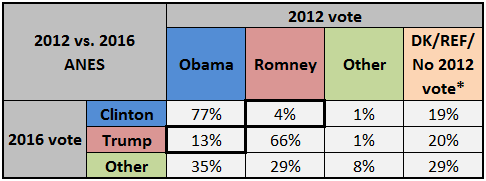
Notes: *“DK/REF/No 2012 vote” includes those who did not recall their 2012 vote, refused to answer about their 2012 vote, or said they did not vote in 2012. Rows may not add up to 100% due to rounding.
Source: American National Election Studies’ 2016 Time Series Study
Overall, if we estimate the raw totals using these percentages while working off of Trump’s nearly 63 million votes and Clinton’s almost 66 million votes, the ANES data suggest that about 8.4 million 2012 Obama voters backed Trump in 2016 and 2.5 million Romney voters supported Clinton.[1]
However, as we pointed out above, there are reasons to be skeptical of reported past vote. Overall, 58% of respondents to the 2016 ANES who said they voted in 2012 (including those who didn’t vote in 2016) claimed to have voted for Obama, seven points more than the 51% Obama actually won in 2012. Meanwhile, Romney only won 40% of the vote of those who said they cast a ballot in 2012, seven points fewer than the 47% Romney really won in 2012. Although there may have been a sizable number of voters who cast ballots in 2012 but didn’t vote in 2016 and vice versa, it would not be surprising if Obama’s percentage were somewhat inflated and Romney’s a bit diminished. This would be due to some of the complications associated with voter recall of past votes. If so, this would mean the 8.4 million Obama 2012-Trump 2016 figure is exaggerated, while the 2.5 million Romney 2012-Clinton 2016 figure is probably too small. Still, the weighted ANES data slightly undershot Trump’s 46% of the popular vote and overshot Clinton’s 48%, so that could mean the data aren’t especially exaggerated.
Cooperative Congressional Election Study
The CCES found similar shares of Obama-Trump and Romney-Clinton voters compared to the ANES, at least as a percentage of all 2016 voters. In the case of the former, the CCES found 5% of all 2016 voters backed Obama in 2012 but Trump in 2016, and — like the ANES — 2% voted for Romney in 2012 and Clinton in 2016.
Breaking down each candidate’s base of support by 2012 vote, the CCES data found that about 11% of Trump’s voters backed Obama in 2012, while only 4% of Clinton’s support came from voters who voted for Romney in 2012. The percentage data for 2012 and 2016 voting are laid out below in Table 2.
Table 2: Makeup of Clinton and Trump voters by 2012 presidential vote, based on the 2016 CCES
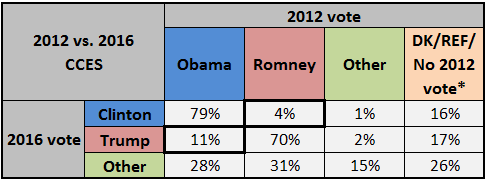
Notes: *“DK/REF/No 2012 vote” includes those who did not recall their 2012 vote, refused to answer about their 2012 vote, or said they did not vote in 2012. Rows may not add up to 100% due to rounding.
Source: Cooperative Congressional Election Study’s 2016 Common Content
But the CCES found a larger share of consistent partisans on both sides between the 2012 and 2016 cycles, particularly among the Republicans, and a smaller share of new voters than the ANES. With these differences, the estimated raw vote total worked out to about 6.7 million Obama-Trump voters and 2.7 million Romney-Clinton voters.[2] While the ANES found 58% of respondents who said they voted in 2012 backed Obama, the CCES’s figure was 54%, closer to the actual percentage. Thus, it’s possible that the estimates based on the CCES data are closer to reality.
University of Virginia Center for Politics poll
Overall, 20% of Trump voters in the Center’s April 2017 survey reported voting for Obama in one of 2008 and 2012, or in both cycles. For our purposes, the figure of interest is the percentage who claimed to have backed Obama in 2012. About 15% of respondents said they either voted for Obama twice (11%) or just in 2012 (4%).
Table 3: Trump voters and voting for Obama in 2008 and/or 2012, April 2017 poll by the UVA Center for Politics
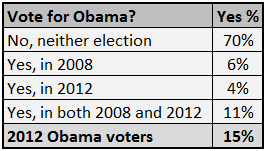
Source: UVA Center for Politics, Public Opinion Strategies (p. 529)
Based on Trump’s overall popular vote, the poll’s finding suggests that roughly 9.2 million Trump voters cast a ballot for Obama in 2012, a higher estimate than those based off the two election studies.[3]
Conclusion
Different sources offer varying estimates of Obama 2012-Trump 2016 voters. The ANES found that about 13% of all Trump voters cast a ballot for Obama in 2012. Meanwhile, the CCES found a slightly smaller figure of around 11%. Lastly, the UVA Center for Politics poll found that about 15% of Trump voters claimed to have backed Obama four years earlier. Using these percentages (not rounded) and Trump’s overall 2016 vote total, estimates of the raw number of such Obama-Trump voters range from about 6.7 million to 9.2 million. That’s a wide range, and considering the caveats regarding voter recall of past votes, it is important to be clear about the relative uncertainty of these figures.
Nonetheless, these surveys offer additional evidence about a critical part of the 2016 equation: the millions of voters who switched from Obama in 2012 to Trump in 2016. Given the extremely close margins in some states, particularly the Rust Belt trio of Michigan, Pennsylvania, and Wisconsin, these voters played a crucial role in handing over the White House to the GOP.
Footnotes
1. We do not use decimal places in the article to avoid exaggerating precision. But the raw vote estimates were produced from unrounded percentages. The ANES found that 13.4% of Trump backers reported supporting Obama in 2012 and 3.8% of Clinton backers reported supporting Romney.
2. The raw vote estimates were produced from unrounded percentages. The CCES found that 10.6% of Trump backers reported supporting Obama in 2012 and 4.1% of Clinton backers reported supporting Romney.
3. The raw vote estimate was produced from an unrounded percentage. The UVA Center for Politics/Public Opinion Strategies poll found that 14.6% of Trump backers reported supporting Obama in 2012.
Geoffrey Skelley is the Associate Editor at the Center for Politics at the University of Virginia.
See Other Political Commentary by Geoffrey Skelley
See Other Political Commentary
Related Articles


Rasmussen Reports is a media company specializing in the collection, publication and distribution of public opinion information.
We conduct public opinion polls on a variety of topics to inform our audience on events in the news and other topics of interest. To ensure editorial control and independence, we pay for the polls ourselves and generate revenue through the sale of subscriptions, sponsorships, and advertising. Nightly polling on politics, business and lifestyle topics provides the content to update the Rasmussen Reports web site many times each day. If it's in the news, it's in our polls. Additionally, the data drives a daily update newsletter and various media outlets across the country.
Some information, including the Rasmussen Reports daily Presidential Tracking Poll and commentaries are available for free to the general public. Subscriptions are available for $4.95 a month or 34.95 a year that provide subscribers with exclusive access to more than 20 stories per week on upcoming elections, consumer confidence, and issues that affect us all. For those who are really into the numbers, Platinum Members can review demographic crosstabs and a full history of our data.
To learn more about our methodology, click here.