The “Big Sort” Continues, with Trump as a Driving Force
A Commentary By Rhodes Cook
Number of blowout counties spiked in 2016, endured in 2020.
KEY POINTS FROM THIS ARTICLE
— More than 20% of the nation’s counties gave 80% or more of its 2-party presidential votes to either Donald Trump or Joe Biden.
— Trump won the vast majority of these counties, but because Biden’s blowout counties are much more populous, he got many more votes out of his “super landslide” counties than Trump got out of his.
— Trump’s blowouts were concentrated in white, rural counties in the Greater South, Interior West, and Great Plains, while Biden’s were in a smattering of big cities, college towns, and smaller counties with large percentages of heavily Democratic nonwhite voters.
The growing number of blowout presidential counties
Nearly 15 years ago, journalist Bill Bishop wrote a provocative book entitled The Big Sort. Its thesis was that Americans were increasingly clustering into communities of like-minded folk — by religion, lifestyle, and politics. That clustering, at least at the political level, has only increased since then.
In Bishop’s book, presidential elections were the topic of focus, and counties were his unit of study: He used 60% of the major-party vote (Democratic and Republican) to measure landslide victories in increasingly homogeneous terrain.
This author bumps up the percentage to “super landslide” proportions, using 80% of the 2-party vote to reflect modern-day “sorting.” A level of 70% or 75% of the vote could have been employed, but 80% was ultimately chosen because it is clearly a one-sided vote — closer to unanimity than 50-50. In this piece, “super landslides,” “blowouts,” “sorted,” and “80% counties” all refer to the same thing: Counties that were won with at least 80% of the major-party (combined Democratic and Republican) vote.
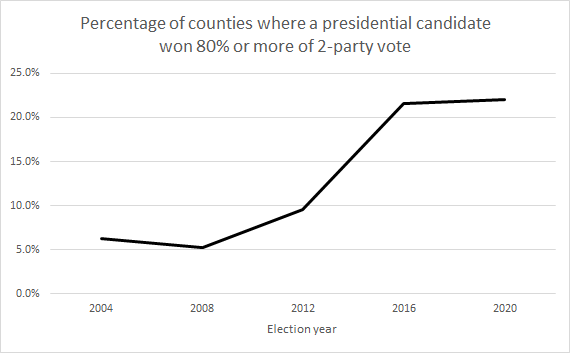
In the presidential election of 2004, when incumbent George W. Bush won the popular and electoral vote (the only Republican to do so in the last third of a century), less than 200 of the nation’s 3,100 or so counties (and independent cities) were decided by 80% of the major-party vote. By 2012, when Mitt Romney lost the popular vote to Barack Obama by 4 percentage points — roughly the same margin that Donald J. Trump lost nationwide to Biden in 2020 — the number of “super landslide” counties had crept up to nearly 300. But in 2016, the total of these counties exploded to more than 670, and by 2020 was approaching 700. That translates into 22% of all the nation’s counties.
To be sure, the blowout counties in 2020 cast just 8% of the national two-party vote (11.9 million of 155.5 million). But the trend line has been clear for decades now, with more and more of the country, both territorially and population-wise, living in “sorted” counties.”
The main catalyst for the recent increase in “blowout” counties has arguably been Trump. He was the major constant in the presidential elections of 2016 and 2020. Yet the former president also has been one of the most polarizing forces in American political history, and there are 2 basic aspects in the rise of super landslide counties that he has affected. One favors Trump and the Republicans; the other, Joe Biden and the Democrats.
Table 1 and Figure 1: The dramatic growth in “super landslide” counties
As the American political landscape has grown more polarized, so have the number of counties in recent presidential elections decided by “super landslides.” The term is defined here as 80% or more of the 2-party vote (the combined total of Democratic and Republican votes without third party or write-in votes). In 2004, when George W. Bush was the most recent Republican presidential candidate to win with a majority of the popular vote, less than 200 of the nation’s 3,100 or so counties were carried by one party or the other with at least 80% of the 2-party vote. By 2020, the number of such super landslides had risen to nearly 700 counties. The bulk of them, fully 95% of the total, were carried by Republican Donald J. Trump, although Trump’s number was largely confined to rural counties, while the tally for Democrat Joe Biden included a number of vote-rich urban counties. |
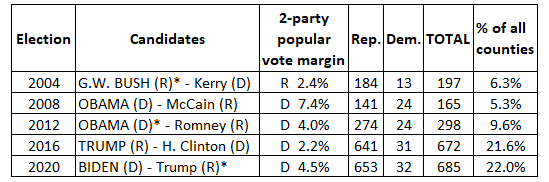
Note: The names of presidential election winners are indicated in capital letters. An asterisk (*) designates an incumbent. Popular vote margins are based on the Democratic and Republican shares of the 2-party presidential vote. The total number of counties used for each election is 3,112, the tally in 2020 (which includes similar jurisdictions such as independent cities). The state of Alaska, though, is not included in the national tally of counties because the vote there is counted by state legislative districts, not counties.
Sources: America Votes 26, 28, 30, 32, and 34 (CQ Press, an imprint of SAGE).
“Super landslides” — Trump wins more counties, Biden wins more votes
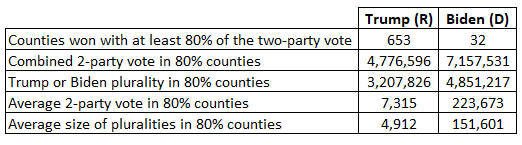
The Republican advantage has been in the rise of “super landslide” counties, fully 95% of which were won in 2016 and 2020 by Trump. In the latter election, the tally of such counties favored the Republican, 653 to Biden’s 32. Yet Trump’s super landslides were almost exclusively in predominantly white rural counties, while the small Biden cadre featured an array of sizeable urban counties with multiracial populations.
The result: Trump won his hundreds of 80% counties by an aggregate plurality of 3.2 million votes, while Biden swept his corporal’s guard of 32 super landslide counties by a combined margin of 4.85 million votes. Put another way: Trump’s average plurality in his 80% counties was less than 5,000 votes per county, while Biden’s average victory margin in his 80% counties exceeded 150,000 votes per county, fully 30 times larger than Trump’s average.
Trump’s biggest cluster of sorted counties was through the middle of the country, from Texas north to the Dakotas, then spilling west and east respectively into the Mountain West and the South. In 2020, Trump swept a majority of all of the counties in Kansas, Nebraska, Oklahoma, and Wyoming by “super landslides,” plus more than 40% of the counties in Missouri, Tennessee, Texas, and Utah.
In some states, the “big sort” was well underway before Trump appeared on the scene. In 2012, Romney carried 83 counties in Texas with at least 80% of the two-party vote. With Trump leading the ticket in 2016, that number swelled a bit to 112. In Kansas, the number of Republican super landslide counties rose from 39 in 2012 to 58 in 2016.
Yet there were other states where the explosion of super landslide counties did not come until Trump first ran in 2016. In West Virginia, the number grew from 1 in 2012 to 14 in 2016; in Tennessee, from 0 to 35; and in Missouri, from 0 to 44.
Table 2: Trump carries far more counties in 2020 by super landslides, but Biden tallies a lot more votes
Republican Donald J. Trump won by super landslides fully 20 times more counties in 2020 than Democrat Joe Biden (which are defined here as at least 80% of the 2-party vote). But Trump’s 80% counties were almost exclusively rural, while many of Biden’s corporal’s guard were urban and possessed far more votes. The result: Biden was able to roll up a much larger plurality in his 32 super landslide counties than Trump did in his 653. On average, Biden’s plurality in each of his 80% counties exceeded 150,000 votes, while Trump’s average plurality was less than 5,000 votes in the 80% counties that he carried. |
Sources: America Votes 26, 28, 30, 32, and 34 (CQ Press, an imprint of SAGE).
Then there is Virginia. In 2012, there was just one jurisdiction in the state won by blowout proportions, the heavily Black city of Petersburg, which Barack Obama carried with 90% of the major-party vote. With Trump on the ballot in 2016, there were 14 jurisdictions in the Old Dominion that were won with at least 80% of the vote, a number split between the 2 parties. In 2016, the breakdown of sorted jurisdictions in Virginia was 8 for Trump and 6 for Hillary Clinton. In 2020, it was 10 for Trump and 6 for Biden.
Still, all of Trump’s super landslide counties in 2020 were clustered in Virginia’s lightly populated, mountainous western panhandle, heavily Republican now but once so fiercely competitive that the congressional district was dubbed “the Fighting Ninth.” Meanwhile, Biden’s half-dozen blowout jurisdictions were sprinkled around the state, 3 in suburban Northern Virginia (the city of Alexandria, Arlington Co., and the city of Falls Church), 2 in the Richmond area (the cities of Richmond and Petersburg), plus the city of Charlottesville (home of the University of Virginia).
These half-dozen jurisdictions produced a plurality for Biden of nearly 250,000 votes, while the margin in Trump’s 10 super landslide counties was barely 70,000. In short, the 80% counties helped to build Biden’s advantage in Virginia considerably (450,000 votes statewide).
Most of the counties on Trump’s nationwide blowout list in 2020 were small in population and not readily recognizable by name. Yet the number did include Russell County, Kansas, where Bob Dole was born and raised; Harlan County, Kentucky, known as “Bloody Harlan” for the violent labor unrest that took place there when the coal industry was vibrant; and Rhea County (Dayton), Tennessee, where the legendary Scopes Trial was held in 1925 featuring William Jennings Bryan and Clarence Darrow doing battle over the teaching of evolution in the schools.
Compared to Trump’s strength in rural white America, Biden’s small array of super landslide counties in 2020 was rather eclectic. There were small, heavily Black counties in the Deep South, such as Macon County, Alabama (Tuskegee); predominantly Native American counties in the Upper Midwest; and academic-oriented communities such as Charlottesville, Virginia.
But what provided clout to Biden’s small number of super landslide counties was the large volume of votes in many of them. Just 2 of the 653 Trump “blowout” counties in 2020 had a combined Democratic and Republican vote in excess of 50,000. On the Biden side, the combined two-party vote exceeded 100,000 in 21 of his 80% counties, including 4 where the combined Democratic and Republican vote surpassed 500,000 votes. They were Alameda County (Oakland and Berkeley), California; suburban Montgomery County, Maryland, outside Washington, D.C.; New York County (Manhattan), New York.; and Philadelphia, Pennsylvania.
Table 3: Distribution of Trump and Biden “super landslide” counties in 2020
More than 20% of the nation’s 3,112 counties and independent cities were carried in the 2020 presidential election by Republican Donald J. Trump with at least 80% of the 2-party vote. That defines a “super landslide” in this study and includes Democratic and Republican votes but not write-in or third party votes. Virtually all of the Trump 80% counties were rural ones with a comparatively low number of votes. More than 500 of Trump’s 653 super landslide counties contained less than 10,000 votes, and many of those produced fewer than 1,000 votes. The highest 2-party vote total in a Trump 80% county was barely 75,000 in Parker County, Texas, just west of Fort Worth. Meanwhile, 21 of Democrat Joe Biden’s 80% counties featured a combined Democratic and Republican vote of more than 100,000, with the 2-party total surpassing 500,000 in 4 counties: Alameda (Oakland), Calif.; Montgomery, MD.; New York (Manhattan), NY; and Philadelphia, PA. |
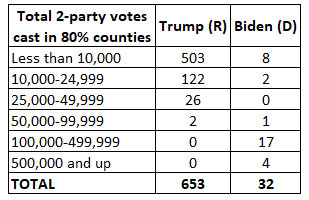
Source: America Votes 34 (CQ Press, an imprint of SAGE).
Basically, the rise in super landslide counties has made red states such as those in the American heartland redder and blue states such as California, New York, and others on the 2 coasts bluer.
On the other hand, of the 5 battleground states that switched from Trump in 2016 to Biden in 2020, 2 — Arizona and Michigan — did not have a single 80% county. Wisconsin had one: Menominee, a small, predominantly Native American county northwest of Green Bay.
However, in Pennsylvania and Georgia, the 80% counties were a larger factor, and in both states, these counties produced margins that were critical in pushing Biden to victory. In Pennsylvania, there were 5 “blowout” counties in 2020: 4 rural ones carried by Trump by a combined margin of barely 37,000 votes, and vote-rich Philadelphia, which Biden took by more than 470,000 votes. The Democrat’s margin of victory in the Keystone State was a little over 80,000 votes.
Meanwhile, Georgia had 27 “blowout” counties in 2020, 25 that were won by Trump and gave him an aggregate plurality of nearly 200,000 votes. Yet they were trumped by the Biden margins in 2 predominantly Black “super landslide” counties in the Atlanta area, Clayton and DeKalb. Combined, they gave Biden a plurality of nearly 330,000 votes, more than enough to enable him to win Georgia by the now famous margin of 11,779 votes.
Table 4 and Map 1: “Super landslide” counties in 2020 by state
The greatest clustering of super landslide counties in the 2020 presidential election occurred in the nation’s rural heartland. It is a large swath of sparsely populated territory that extends north from Texas to the Dakotas, and reaches out into the South and Mountain West. Virtually all of these 80% counties went for Republican Donald J. Trump in 2020, and includes the 4 states with a majority of super landslide counties — Wyoming, Nebraska, Oklahoma, and Kansas. The comparative handful of Democratic 80% counties were primarily dispersed in urban areas across the country from Manhattan to San Francisco, with a small group of heavily minority rural counties in between. Most of the 13 states that had no 80% counties at all were in the nation’s northern tier from Maine to Washington. |
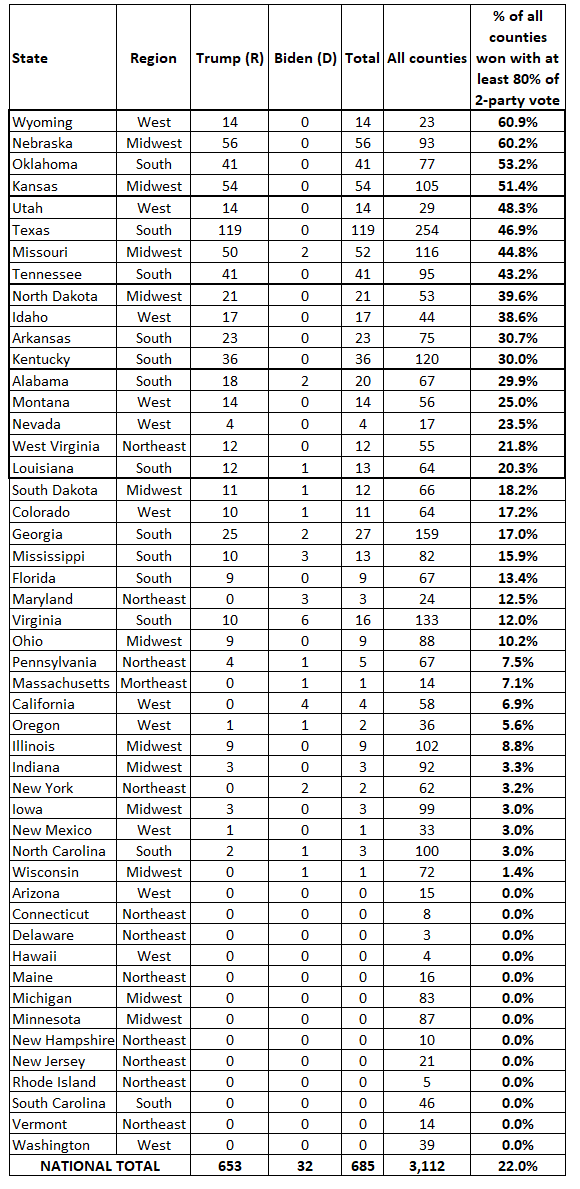
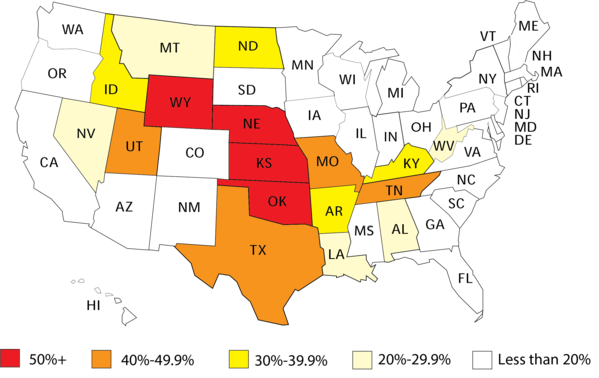
Note: The total number of states listed here is 49. Alaska is not included. It reports its vote by state legislative districts, not counties. In Hawaii, there are 5 counties, but votes are reported only in 4. In Missouri, the vote from Kansas City is listed as a separate entity like the independent city of St. Louis. That makes 116 jurisdictions in the state, not the 115 that is often cited.
Source: America Votes 34 (CQ Press, an imprint of SAGE).
What’s next?
The subtitle of Bishop’s The Big Sort, was “Why the Clustering of Like-Minded America Is Tearing Us Apart.” There are many Americans who agree with that negative assessment.
For the first few decades after World War II, there were no culture wars of note. Democrats and Republicans could live side-by-side as neighbors, participating amicably in the same activities. But, Bishop notes, that began to change in the mid-1960s, with a string of violent events that rocked the nation and started the movement of voters into hostile camps. There was the unsettling national trauma produced by the assassination of President John F. Kennedy in November 1963, the escalation of the Vietnam War (magnified by the national draft and a casualty count that grew into the tens of thousands), and racial unrest that affected cities across the country.
The nation began to divide culturally and politically. Basically, on one side were pro-war, working-class “hard hats,” who wore their patriotism on their sleeves. On the other side were white-collar voters who were more questioning of the war and more sympathetic to the increasingly active civil rights movement. Once a backbone of the Democratic Party, many blue-collar voters began an inexorable movement toward the GOP, while a number of more affluent voters, once a linchpin of the Republican Party, began to find themselves more comfortable with the Democrats. As the years unfolded, other social issues such as abortion were added to the mix, and the “big sort” gained traction.
Will that trend continue to grow in 2024, especially if Trump is not on the November ballot? He arguably was the prime catalyst for the dramatic increase in 80% counties in the last two presidential elections, both among Republicans and Democrats. The Republican tally of super landslide counties jumped from 274 in 2012 to 653 in 2020, while the Democratic number of largely vote-rich jurisdictions increased from 24 to 32 over that same 8-year span.
With Trump in the race in 2024, there is apt to be a continuation of our modern-day “era of bad feelings.” But without Trump, the 2024 campaign may be the first since 2012 not conducted on a razor’s edge, engulfed in enmity and vitriol, with voters tethered to one side or the other. Maybe, just maybe, the “big sort” 2 years hence may no longer be growing.
Tables 5 and 6: Leading Trump, Biden counties in 2020 by percentage of 2-party vote
In terms of percentage of the vote, the leading 30 counties in 2020 for Donald J. Trump were quite different than those for Joe Biden. Trump won all of his top counties with at least 90% of the 2-party vote in largely rural terrain that by and large was overwhelmingly white. Nearly half of Trump’s leading counties were in Texas. Meanwhile, Biden carried only a couple of counties with 90% of the 2-party vote; his other top counties (and independent cities) were in the 80% range. All and all, Biden’s top counties were a racially diverse group, including some rural counties with a Black or Native American majority (such as Jefferson County, MS, and Oglala Lakota County, SD, respectively), or were larger urban centers with a multiracial population. The bulk of the leading Republican and Democratic counties in 2020 were not much different than 2016, generally up or down a percentage point or two at most. Case in point: Charlottesville, where Biden posted his second-highest percentage of the 2-party vote in Virginia in 2020. His 87% share of the major-party vote was 1.2 percentage points higher than Hillary Clinton won there in 2016. |
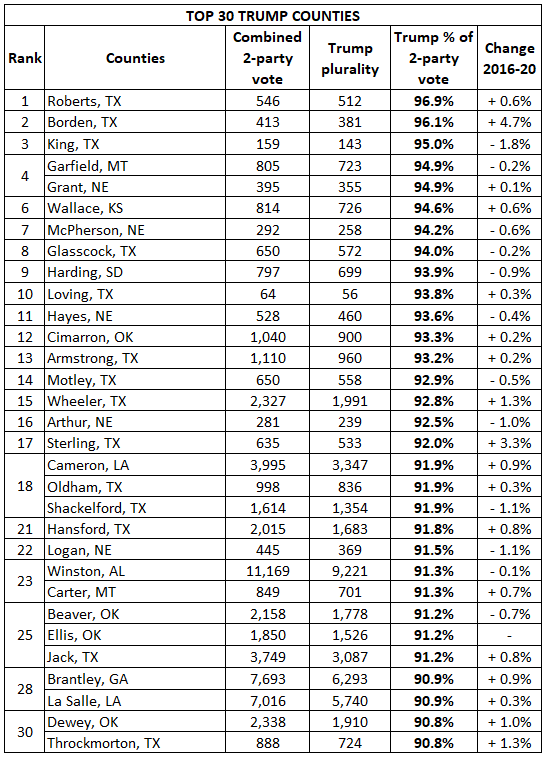
Note: There are actually 31 counties that appear in this list of leading Trump counties in 2020, since there was a 2-way tie for 30th place. A dash (-) indicates that the Republican percentage of the two-party presidential vote in 2020 was the same as it was in 2016.
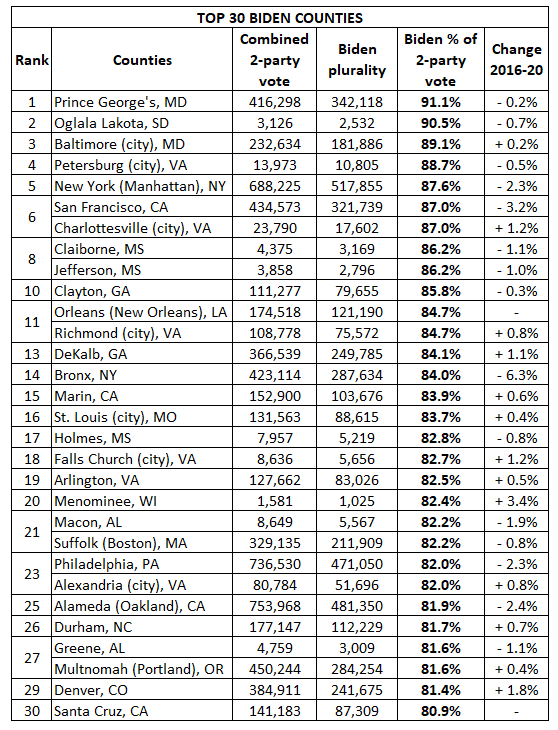
Note: A dash (-) indicates that the Democratic percentage of the 2-party presidential vote in 2020 was the same as it was in 2016.
Sources: America Votes 32 and 34 (CQ Press, an imprint of SAGE), which includes the official county-by-county presidential vote in 2016 and 2020, respectively.
Rhodes Cook was a political reporter for Congressional Quarterly for more than 2 decades and is a senior columnist at Sabato’s Crystal Ball. He also publishes The Rhodes Cook Letter, a newsletter that focuses on electoral politics. |
See Other Political Commentary by Rhodes Cook.
See Other Political Commentary.
This article is reprinted from Sabato's Crystal Ball.
Views expressed in this column are those of the author, not those of Rasmussen Reports. Comments about this content should be directed to the author or syndicate.
Related Articles


Rasmussen Reports is a media company specializing in the collection, publication and distribution of public opinion information.
We conduct public opinion polls on a variety of topics to inform our audience on events in the news and other topics of interest. To ensure editorial control and independence, we pay for the polls ourselves and generate revenue through the sale of subscriptions, sponsorships, and advertising. Nightly polling on politics, business and lifestyle topics provides the content to update the Rasmussen Reports web site many times each day. If it's in the news, it's in our polls. Additionally, the data drives a daily update newsletter and various media outlets across the country.
Some information, including the Rasmussen Reports daily Presidential Tracking Poll and commentaries are available for free to the general public. Subscriptions are available for $4.95 a month or 34.95 a year that provide subscribers with exclusive access to more than 20 stories per week on upcoming elections, consumer confidence, and issues that affect us all. For those who are really into the numbers, Platinum Members can review demographic crosstabs and a full history of our data.
To learn more about our methodology, click here.