Super Tuesday
A Commentary by Rhodes Cook
Ready or not, here it comes... Super-Duper Tuesday, Tsunami Tuesday, Monster Tuesday, or whatever name one chooses to call it. The huge, historic nationwide vote Feb. 5 is at last at hand. Two dozen states from Massachusetts to California will vote next Tuesday, electing more than 40 percent of all Democratic and Republican delegates in 2008.
The only other single-day event that has ever come close to this size during the presidential nominating process came on March 8, 1988, when the first full-blown Super Tuesday featured 16 primaries, actually one more than is scheduled next Tuesday. But that one-day votefest 20 years ago was a Southern-oriented event, rounded out by a handful of primaries in the Northeast and a smattering of low-visibility caucuses in the West.
This year's Super Tuesday, by contrast, is truly a nationwide event, the largest in scope ever held outside the November general election. It is vast and varied in virtually every way. Each region of the country is well represented. Red and blue states abound. Racial diversity is accented. Voter enthusiasm has rarely been higher, and turnout should be huge.
The half of the country that will vote Feb. 5 includes nearly 80 million registered voters. Most will have the opportunity to participate in primary elections, where turnout records have already been broken this year in a number of states. Lower-turnout caucuses will be held in a few small to medium-sized states west of the Mississippi River.
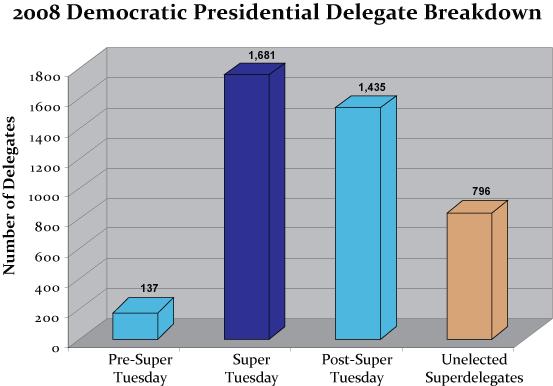
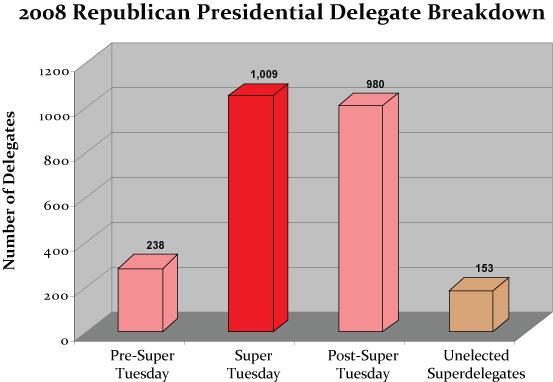
Figure 1. Super Tuesday: One Huge Delegate Harvest
More than 40 percent of all Democratic and Republican delegates will be elected to reflect the results of primaries and caucuses held on Super Tuesday (Feb. 5)--more to be selected in one day than the total elected in either the weeks before or the months afterward. Altogether, Democrats require 2,025 delegates to nominate; the Republicans, 1,191.
|
Delegates at Stake |
% of Total Delegates |
|||||
|
Dems. |
Reps. |
Dems. |
Reps. |
|||
|
ELECTED DELEGATES |
||||||
|
Pre-Super Tuesday |
137 |
238 |
3% |
10% |
||
|
Super Tuesday (Feb. 5) |
1,681 |
1,009 |
42% |
42% |
||
|
Post-Super Tuesday |
1,435 |
980 |
35% |
41% |
||
|
UNELECTED DELEGATES |
||||||
|
Superdelegates |
796 |
153 |
20% |
6% |
||
|
TOTAL DELEGATES |
4,049 |
2,380 |
||||
Source: Democratic National Committee's Office of Party Affairs and Delegate Selection (Jan. 5, 2008); Call for the 2008 Republican National Convention (Nov. 9, 2007).
Unlike 1988, no one part of the country will dominate next week's vote. Each region will have a say, with the West (with one-third of the Democratic and Republican delegates) and the Northeast (with roughly one-quarter) leading the way. Altogether, Super Tuesday will include at least five states from each region, anchored by the nation's first, third and fifth most populous states--California, New York, and Illinois, respectively.
The monster vote will require candidates to dip into both Red and Blue America in their hunt for delegates. The quintet of Southern primary states all voted decisively for President Bush in 2004. The five primary states in the Northeast were clear-cut in their support for John Kerry.
In the heartland, candidates will be tested in a collection of battleground states which nowadays are being described as purple, rather than red or blue. It is a group that on Super Tuesday will include Minnesota and Missouri in the Midwest and Arizona, Colorado and New Mexico in the Mountain West.
In the process, candidates will come face to face with the rich mosaic of racial and ethnic diversity that comprises the American electorate. Seven states voting Feb. 5 have populations at least 15 percent African American--four in the South, three in the industrial Frost Belt (including Hillary Clinton's home base of New York and Barack Obama's Illinois). Five states next Tuesday have populations 15 percent or more Hispanic--New York plus four Western states (California, Arizona, Colorado and New Mexico).
The sprawling nature of the Feb. 5 event will test the candidates' ability to draw votes under an array of different systems of voter participation, ranging from closed contests limited to party members only, to wide open primaries and caucuses where any registered voter of any political persuasion can participate. There are conspicuous examples of each that should show in stark form whether Obama and John McCain truly need the support of independents to successfully challenge Clinton and Mitt Romney, respectively, for their party's nominations.
In the South and Midwest, virtually all the primaries and caucuses on Super Tuesday will feature open voting. On the two coasts, though, there will be a greater emphasis on closed contests, which will be the case in New York, Connecticut, Arizona and for the Republicans, California. Conspicuously, California Democrats will allow independents (roughly 3 million) to participate in their primary, as will both parties in Massachusetts and New Jersey.
In short, Super Tuesday will test the candidates' organizational ability, campaign skills, and most importantly, their vote-getting appeal, in far-flung settings unique in their scope and variety.
Figure 2. Super Tuesday: The Voters and How They Participate
A broad swath of America will be voting Feb. 5--red and blue states, overwhelmingly white and racially diverse states, large and small states, primary and caucus states, and at least five states from each region of the country. This chart summarizes an array of electoral and demographic data that pertains to the Super Tuesday states.
|
% Registered as: |
Racial Composition |
|||||||||||||||||||||||||||||||||||||||||||||||||||||||||||||||||||||||||||||||||||||||||||||||||||||||||||||||||||||||||||||||||||||||||||||||||||||||||||||||||||||||||||||||||||||||||||||||||||||||||||||||||||||||||||||||||||||||||||||||||||||||||||||||||||||||||||||||||||||||||||||||||||||||||||||||||||||||||||||||||||||||||||||||||||||||||||||||||||||||||||||||||||||||||||||||||||||||||||||||||||||||||||||||||||||||||||||||||||||||||||||||||||||||||||||||||||||||||||||||||||||||||||||||||||||||||||||||||||||||||||||||||||||||||||||||||||||||||||||||||||||||||||||||||||||||||||||||||||||||||||||||||||||||||||||||||||
|
Poll Closing Time (EST) |
Voter Particip. |
Registered Voters (as of fall '07) |
Dems. |
Reps. |
Others |
White |
Black |
Hisp. |
Asian |
Native Amer. |
Cong. Dists. |
'04 Pres. Vote |
||||||||||||||||||||||||||||||||||||||||||||||||||||||||||||||||||||||||||||||||||||||||||||||||||||||||||||||||||||||||||||||||||||||||||||||||||||||||||||||||||||||||||||||||||||||||||||||||||||||||||||||||||||||||||||||||||||||||||||||||||||||||||||||||||||||||||||||||||||||||||||||||||||||||||||||||||||||||||||||||||||||||||||||||||||||||||||||||||||||||||||||||||||||||||||||||||||||||||||||||||||||||||||||||||||||||||||||||||||||||||||||||||||||||||||||||||||||||||||||||||||||||||||||||||||||||||||||||||||||||||||||||||||||||||||||||||||||||||||||||||||||||||||||||||||||||||||||||||||||||||||||||||||||||
|
NORTHEAST |
||||||||||||||||||||||||||||||||||||||||||||||||||||||||||||||||||||||||||||||||||||||||||||||||||||||||||||||||||||||||||||||||||||||||||||||||||||||||||||||||||||||||||||||||||||||||||||||||||||||||||||||||||||||||||||||||||||||||||||||||||||||||||||||||||||||||||||||||||||||||||||||||||||||||||||||||||||||||||||||||||||||||||||||||||||||||||||||||||||||||||||||||||||||||||||||||||||||||||||||||||||||||||||||||||||||||||||||||||||||||||||||||||||||||||||||||||||||||||||||||||||||||||||||||||||||||||||||||||||||||||||||||||||||||||||||||||||||||||||||||||||||||||||||||||||||||||||||||||||||||||||||||||||||||||||||||||||
|
Connecticut Primary |
8:00 PM |
Closed |
1,922,370 |
35% |
21% |
44% |
77% |
9% |
9% |
2% |
- |
5 |
Kerry by 10% |
|||||||||||||||||||||||||||||||||||||||||||||||||||||||||||||||||||||||||||||||||||||||||||||||||||||||||||||||||||||||||||||||||||||||||||||||||||||||||||||||||||||||||||||||||||||||||||||||||||||||||||||||||||||||||||||||||||||||||||||||||||||||||||||||||||||||||||||||||||||||||||||||||||||||||||||||||||||||||||||||||||||||||||||||||||||||||||||||||||||||||||||||||||||||||||||||||||||||||||||||||||||||||||||||||||||||||||||||||||||||||||||||||||||||||||||||||||||||||||||||||||||||||||||||||||||||||||||||||||||||||||||||||||||||||||||||||||||||||||||||||||||||||||||||||||||||||||||||||||||||||||||||||||||||
|
Delaware Primary |
8:00 PM |
Closed |
562,920 |
44% |
32% |
24% |
72% |
19% |
5% |
2% |
- |
1 |
Kerry by 8% |
|||||||||||||||||||||||||||||||||||||||||||||||||||||||||||||||||||||||||||||||||||||||||||||||||||||||||||||||||||||||||||||||||||||||||||||||||||||||||||||||||||||||||||||||||||||||||||||||||||||||||||||||||||||||||||||||||||||||||||||||||||||||||||||||||||||||||||||||||||||||||||||||||||||||||||||||||||||||||||||||||||||||||||||||||||||||||||||||||||||||||||||||||||||||||||||||||||||||||||||||||||||||||||||||||||||||||||||||||||||||||||||||||||||||||||||||||||||||||||||||||||||||||||||||||||||||||||||||||||||||||||||||||||||||||||||||||||||||||||||||||||||||||||||||||||||||||||||||||||||||||||||||||||||||
|
Massachusetts Primary |
8:00 PM |
Semi-open |
3,990,505 |
37% |
13% |
51% |
82% |
5% |
7% |
4% |
- |
10 |
Kerry by 25% |
|||||||||||||||||||||||||||||||||||||||||||||||||||||||||||||||||||||||||||||||||||||||||||||||||||||||||||||||||||||||||||||||||||||||||||||||||||||||||||||||||||||||||||||||||||||||||||||||||||||||||||||||||||||||||||||||||||||||||||||||||||||||||||||||||||||||||||||||||||||||||||||||||||||||||||||||||||||||||||||||||||||||||||||||||||||||||||||||||||||||||||||||||||||||||||||||||||||||||||||||||||||||||||||||||||||||||||||||||||||||||||||||||||||||||||||||||||||||||||||||||||||||||||||||||||||||||||||||||||||||||||||||||||||||||||||||||||||||||||||||||||||||||||||||||||||||||||||||||||||||||||||||||||||||
|
New Jersey Primary |
8:00 PM |
Semi-open |
4,810,437 |
24% |
18% |
58% |
66% |
13% |
13% |
6% |
- |
13 |
Kerry by 7% |
|||||||||||||||||||||||||||||||||||||||||||||||||||||||||||||||||||||||||||||||||||||||||||||||||||||||||||||||||||||||||||||||||||||||||||||||||||||||||||||||||||||||||||||||||||||||||||||||||||||||||||||||||||||||||||||||||||||||||||||||||||||||||||||||||||||||||||||||||||||||||||||||||||||||||||||||||||||||||||||||||||||||||||||||||||||||||||||||||||||||||||||||||||||||||||||||||||||||||||||||||||||||||||||||||||||||||||||||||||||||||||||||||||||||||||||||||||||||||||||||||||||||||||||||||||||||||||||||||||||||||||||||||||||||||||||||||||||||||||||||||||||||||||||||||||||||||||||||||||||||||||||||||||||||
|
New York Primary |
9:00 PM |
Closed |
11,222,042 |
47% |
27% |
26% |
62% |
15% |
15% |
5% |
- |
29 |
Kerry by 18% |
|||||||||||||||||||||||||||||||||||||||||||||||||||||||||||||||||||||||||||||||||||||||||||||||||||||||||||||||||||||||||||||||||||||||||||||||||||||||||||||||||||||||||||||||||||||||||||||||||||||||||||||||||||||||||||||||||||||||||||||||||||||||||||||||||||||||||||||||||||||||||||||||||||||||||||||||||||||||||||||||||||||||||||||||||||||||||||||||||||||||||||||||||||||||||||||||||||||||||||||||||||||||||||||||||||||||||||||||||||||||||||||||||||||||||||||||||||||||||||||||||||||||||||||||||||||||||||||||||||||||||||||||||||||||||||||||||||||||||||||||||||||||||||||||||||||||||||||||||||||||||||||||||||||||
|
West Virginia Convention (R) |
- |
Closed |
1,137,371 |
57% |
30% |
13% |
95% |
3% |
1% |
1% |
- |
3 |
Bush by 13% |
|||||||||||||||||||||||||||||||||||||||||||||||||||||||||||||||||||||||||||||||||||||||||||||||||||||||||||||||||||||||||||||||||||||||||||||||||||||||||||||||||||||||||||||||||||||||||||||||||||||||||||||||||||||||||||||||||||||||||||||||||||||||||||||||||||||||||||||||||||||||||||||||||||||||||||||||||||||||||||||||||||||||||||||||||||||||||||||||||||||||||||||||||||||||||||||||||||||||||||||||||||||||||||||||||||||||||||||||||||||||||||||||||||||||||||||||||||||||||||||||||||||||||||||||||||||||||||||||||||||||||||||||||||||||||||||||||||||||||||||||||||||||||||||||||||||||||||||||||||||||||||||||||||||||
|
SOUTH |
||||||||||||||||||||||||||||||||||||||||||||||||||||||||||||||||||||||||||||||||||||||||||||||||||||||||||||||||||||||||||||||||||||||||||||||||||||||||||||||||||||||||||||||||||||||||||||||||||||||||||||||||||||||||||||||||||||||||||||||||||||||||||||||||||||||||||||||||||||||||||||||||||||||||||||||||||||||||||||||||||||||||||||||||||||||||||||||||||||||||||||||||||||||||||||||||||||||||||||||||||||||||||||||||||||||||||||||||||||||||||||||||||||||||||||||||||||||||||||||||||||||||||||||||||||||||||||||||||||||||||||||||||||||||||||||||||||||||||||||||||||||||||||||||||||||||||||||||||||||||||||||||||||||||||||||||||||
|
Alabama Primary |
8:00 PM |
Open |
2,469,807 |
- |
- |
- |
70% |
26% |
2% |
1% |
- |
7 |
Bush by 26% |
|||||||||||||||||||||||||||||||||||||||||||||||||||||||||||||||||||||||||||||||||||||||||||||||||||||||||||||||||||||||||||||||||||||||||||||||||||||||||||||||||||||||||||||||||||||||||||||||||||||||||||||||||||||||||||||||||||||||||||||||||||||||||||||||||||||||||||||||||||||||||||||||||||||||||||||||||||||||||||||||||||||||||||||||||||||||||||||||||||||||||||||||||||||||||||||||||||||||||||||||||||||||||||||||||||||||||||||||||||||||||||||||||||||||||||||||||||||||||||||||||||||||||||||||||||||||||||||||||||||||||||||||||||||||||||||||||||||||||||||||||||||||||||||||||||||||||||||||||||||||||||||||||||||||
|
Arkansas Primary |
8:30 PM |
Open |
1,610,940 |
- |
- |
- |
79% |
16% |
3% |
1% |
1% |
4 |
Bush by 10% |
|||||||||||||||||||||||||||||||||||||||||||||||||||||||||||||||||||||||||||||||||||||||||||||||||||||||||||||||||||||||||||||||||||||||||||||||||||||||||||||||||||||||||||||||||||||||||||||||||||||||||||||||||||||||||||||||||||||||||||||||||||||||||||||||||||||||||||||||||||||||||||||||||||||||||||||||||||||||||||||||||||||||||||||||||||||||||||||||||||||||||||||||||||||||||||||||||||||||||||||||||||||||||||||||||||||||||||||||||||||||||||||||||||||||||||||||||||||||||||||||||||||||||||||||||||||||||||||||||||||||||||||||||||||||||||||||||||||||||||||||||||||||||||||||||||||||||||||||||||||||||||||||||||||||
|
Georgia Primary |
7:00 PM |
Open |
4,306,371 |
- |
- |
- |
63% |
28% |
5% |
2% |
- |
13 |
Bush by 17% |
|||||||||||||||||||||||||||||||||||||||||||||||||||||||||||||||||||||||||||||||||||||||||||||||||||||||||||||||||||||||||||||||||||||||||||||||||||||||||||||||||||||||||||||||||||||||||||||||||||||||||||||||||||||||||||||||||||||||||||||||||||||||||||||||||||||||||||||||||||||||||||||||||||||||||||||||||||||||||||||||||||||||||||||||||||||||||||||||||||||||||||||||||||||||||||||||||||||||||||||||||||||||||||||||||||||||||||||||||||||||||||||||||||||||||||||||||||||||||||||||||||||||||||||||||||||||||||||||||||||||||||||||||||||||||||||||||||||||||||||||||||||||||||||||||||||||||||||||||||||||||||||||||||||||
|
Oklahoma Primary |
8:00 PM |
Closed |
2,075,561 |
50% |
39% |
11% |
74% |
7% |
5% |
1% |
8% |
5 |
Bush by 31% |
|||||||||||||||||||||||||||||||||||||||||||||||||||||||||||||||||||||||||||||||||||||||||||||||||||||||||||||||||||||||||||||||||||||||||||||||||||||||||||||||||||||||||||||||||||||||||||||||||||||||||||||||||||||||||||||||||||||||||||||||||||||||||||||||||||||||||||||||||||||||||||||||||||||||||||||||||||||||||||||||||||||||||||||||||||||||||||||||||||||||||||||||||||||||||||||||||||||||||||||||||||||||||||||||||||||||||||||||||||||||||||||||||||||||||||||||||||||||||||||||||||||||||||||||||||||||||||||||||||||||||||||||||||||||||||||||||||||||||||||||||||||||||||||||||||||||||||||||||||||||||||||||||||||||
|
Tennessee Primary |
8:00 PM |
Open |
3,305,881 |
- |
- |
- |
79% |
16% |
2% |
1% |
- |
9 |
Bush by 14% |
|||||||||||||||||||||||||||||||||||||||||||||||||||||||||||||||||||||||||||||||||||||||||||||||||||||||||||||||||||||||||||||||||||||||||||||||||||||||||||||||||||||||||||||||||||||||||||||||||||||||||||||||||||||||||||||||||||||||||||||||||||||||||||||||||||||||||||||||||||||||||||||||||||||||||||||||||||||||||||||||||||||||||||||||||||||||||||||||||||||||||||||||||||||||||||||||||||||||||||||||||||||||||||||||||||||||||||||||||||||||||||||||||||||||||||||||||||||||||||||||||||||||||||||||||||||||||||||||||||||||||||||||||||||||||||||||||||||||||||||||||||||||||||||||||||||||||||||||||||||||||||||||||||||||
|
MIDWEST |
||||||||||||||||||||||||||||||||||||||||||||||||||||||||||||||||||||||||||||||||||||||||||||||||||||||||||||||||||||||||||||||||||||||||||||||||||||||||||||||||||||||||||||||||||||||||||||||||||||||||||||||||||||||||||||||||||||||||||||||||||||||||||||||||||||||||||||||||||||||||||||||||||||||||||||||||||||||||||||||||||||||||||||||||||||||||||||||||||||||||||||||||||||||||||||||||||||||||||||||||||||||||||||||||||||||||||||||||||||||||||||||||||||||||||||||||||||||||||||||||||||||||||||||||||||||||||||||||||||||||||||||||||||||||||||||||||||||||||||||||||||||||||||||||||||||||||||||||||||||||||||||||||||||||||||||||||||
|
Illinois Primary |
8:00 PM |
Open |
7,375,688 |
- |
- |
- |
68% |
15% |
12% |
3% |
- |
19 |
Kerry by 10% |
|||||||||||||||||||||||||||||||||||||||||||||||||||||||||||||||||||||||||||||||||||||||||||||||||||||||||||||||||||||||||||||||||||||||||||||||||||||||||||||||||||||||||||||||||||||||||||||||||||||||||||||||||||||||||||||||||||||||||||||||||||||||||||||||||||||||||||||||||||||||||||||||||||||||||||||||||||||||||||||||||||||||||||||||||||||||||||||||||||||||||||||||||||||||||||||||||||||||||||||||||||||||||||||||||||||||||||||||||||||||||||||||||||||||||||||||||||||||||||||||||||||||||||||||||||||||||||||||||||||||||||||||||||||||||||||||||||||||||||||||||||||||||||||||||||||||||||||||||||||||||||||||||||||||
|
Kansas Caucuses (D) |
- |
Closed* |
1,647,434 |
27% |
46% |
28% |
83% |
6% |
7% |
2% |
1% |
4 |
Bush by 25% |
|||||||||||||||||||||||||||||||||||||||||||||||||||||||||||||||||||||||||||||||||||||||||||||||||||||||||||||||||||||||||||||||||||||||||||||||||||||||||||||||||||||||||||||||||||||||||||||||||||||||||||||||||||||||||||||||||||||||||||||||||||||||||||||||||||||||||||||||||||||||||||||||||||||||||||||||||||||||||||||||||||||||||||||||||||||||||||||||||||||||||||||||||||||||||||||||||||||||||||||||||||||||||||||||||||||||||||||||||||||||||||||||||||||||||||||||||||||||||||||||||||||||||||||||||||||||||||||||||||||||||||||||||||||||||||||||||||||||||||||||||||||||||||||||||||||||||||||||||||||||||||||||||||||||
|
Minnesota Caucuses |
- |
Open |
3,118,515 |
- |
- |
- |
88% |
3% |
3% |
3% |
1% |
8 |
Kerry by 3% |
|||||||||||||||||||||||||||||||||||||||||||||||||||||||||||||||||||||||||||||||||||||||||||||||||||||||||||||||||||||||||||||||||||||||||||||||||||||||||||||||||||||||||||||||||||||||||||||||||||||||||||||||||||||||||||||||||||||||||||||||||||||||||||||||||||||||||||||||||||||||||||||||||||||||||||||||||||||||||||||||||||||||||||||||||||||||||||||||||||||||||||||||||||||||||||||||||||||||||||||||||||||||||||||||||||||||||||||||||||||||||||||||||||||||||||||||||||||||||||||||||||||||||||||||||||||||||||||||||||||||||||||||||||||||||||||||||||||||||||||||||||||||||||||||||||||||||||||||||||||||||||||||||||||||
|
Missouri Primary |
8:00 PM |
Open |
4,007,174 |
- |
- |
- |
84% |
11% |
2% |
1% |
- |
9 |
Bush by 7% |
|||||||||||||||||||||||||||||||||||||||||||||||||||||||||||||||||||||||||||||||||||||||||||||||||||||||||||||||||||||||||||||||||||||||||||||||||||||||||||||||||||||||||||||||||||||||||||||||||||||||||||||||||||||||||||||||||||||||||||||||||||||||||||||||||||||||||||||||||||||||||||||||||||||||||||||||||||||||||||||||||||||||||||||||||||||||||||||||||||||||||||||||||||||||||||||||||||||||||||||||||||||||||||||||||||||||||||||||||||||||||||||||||||||||||||||||||||||||||||||||||||||||||||||||||||||||||||||||||||||||||||||||||||||||||||||||||||||||||||||||||||||||||||||||||||||||||||||||||||||||||||||||||||||||
|
North Dakota Caucuses |
- |
Open |
- |
- |
- |
- |
92% |
1% |
1% |
1% |
5% |
1 |
Bush by 27% |
|||||||||||||||||||||||||||||||||||||||||||||||||||||||||||||||||||||||||||||||||||||||||||||||||||||||||||||||||||||||||||||||||||||||||||||||||||||||||||||||||||||||||||||||||||||||||||||||||||||||||||||||||||||||||||||||||||||||||||||||||||||||||||||||||||||||||||||||||||||||||||||||||||||||||||||||||||||||||||||||||||||||||||||||||||||||||||||||||||||||||||||||||||||||||||||||||||||||||||||||||||||||||||||||||||||||||||||||||||||||||||||||||||||||||||||||||||||||||||||||||||||||||||||||||||||||||||||||||||||||||||||||||||||||||||||||||||||||||||||||||||||||||||||||||||||||||||||||||||||||||||||||||||||||
|
WEST |
||||||||||||||||||||||||||||||||||||||||||||||||||||||||||||||||||||||||||||||||||||||||||||||||||||||||||||||||||||||||||||||||||||||||||||||||||||||||||||||||||||||||||||||||||||||||||||||||||||||||||||||||||||||||||||||||||||||||||||||||||||||||||||||||||||||||||||||||||||||||||||||||||||||||||||||||||||||||||||||||||||||||||||||||||||||||||||||||||||||||||||||||||||||||||||||||||||||||||||||||||||||||||||||||||||||||||||||||||||||||||||||||||||||||||||||||||||||||||||||||||||||||||||||||||||||||||||||||||||||||||||||||||||||||||||||||||||||||||||||||||||||||||||||||||||||||||||||||||||||||||||||||||||||||||||||||||||
|
Alaska Caucuses |
- |
Closed* |
474,167 |
14% |
25% |
61% |
68% |
3% |
4% |
4% |
15% |
1 |
Bush by 26% |
|||||||||||||||||||||||||||||||||||||||||||||||||||||||||||||||||||||||||||||||||||||||||||||||||||||||||||||||||||||||||||||||||||||||||||||||||||||||||||||||||||||||||||||||||||||||||||||||||||||||||||||||||||||||||||||||||||||||||||||||||||||||||||||||||||||||||||||||||||||||||||||||||||||||||||||||||||||||||||||||||||||||||||||||||||||||||||||||||||||||||||||||||||||||||||||||||||||||||||||||||||||||||||||||||||||||||||||||||||||||||||||||||||||||||||||||||||||||||||||||||||||||||||||||||||||||||||||||||||||||||||||||||||||||||||||||||||||||||||||||||||||||||||||||||||||||||||||||||||||||||||||||||||||||
|
Arizona Primary |
9:00 PM |
Closed |
2,649,367 |
33% |
39% |
28% |
64% |
3% |
25% |
2% |
5% |
8 |
Bush by 10% |
|||||||||||||||||||||||||||||||||||||||||||||||||||||||||||||||||||||||||||||||||||||||||||||||||||||||||||||||||||||||||||||||||||||||||||||||||||||||||||||||||||||||||||||||||||||||||||||||||||||||||||||||||||||||||||||||||||||||||||||||||||||||||||||||||||||||||||||||||||||||||||||||||||||||||||||||||||||||||||||||||||||||||||||||||||||||||||||||||||||||||||||||||||||||||||||||||||||||||||||||||||||||||||||||||||||||||||||||||||||||||||||||||||||||||||||||||||||||||||||||||||||||||||||||||||||||||||||||||||||||||||||||||||||||||||||||||||||||||||||||||||||||||||||||||||||||||||||||||||||||||||||||||||||||
|
California Primary |
11:00 PM |
Semi-open (D)/Closed (R) |
15,682,358 |
43% |
34% |
23% |
47% |
6% |
32% |
11% |
1% |
53 |
Kerry by 10% |
|||||||||||||||||||||||||||||||||||||||||||||||||||||||||||||||||||||||||||||||||||||||||||||||||||||||||||||||||||||||||||||||||||||||||||||||||||||||||||||||||||||||||||||||||||||||||||||||||||||||||||||||||||||||||||||||||||||||||||||||||||||||||||||||||||||||||||||||||||||||||||||||||||||||||||||||||||||||||||||||||||||||||||||||||||||||||||||||||||||||||||||||||||||||||||||||||||||||||||||||||||||||||||||||||||||||||||||||||||||||||||||||||||||||||||||||||||||||||||||||||||||||||||||||||||||||||||||||||||||||||||||||||||||||||||||||||||||||||||||||||||||||||||||||||||||||||||||||||||||||||||||||||||||||
|
Colorado Caucuses |
- |
Closed |
2,839,139 |
30% |
35% |
35% |
74% |
4% |
17% |
2% |
1% |
7 |
Bush by 5% |
|||||||||||||||||||||||||||||||||||||||||||||||||||||||||||||||||||||||||||||||||||||||||||||||||||||||||||||||||||||||||||||||||||||||||||||||||||||||||||||||||||||||||||||||||||||||||||||||||||||||||||||||||||||||||||||||||||||||||||||||||||||||||||||||||||||||||||||||||||||||||||||||||||||||||||||||||||||||||||||||||||||||||||||||||||||||||||||||||||||||||||||||||||||||||||||||||||||||||||||||||||||||||||||||||||||||||||||||||||||||||||||||||||||||||||||||||||||||||||||||||||||||||||||||||||||||||||||||||||||||||||||||||||||||||||||||||||||||||||||||||||||||||||||||||||||||||||||||||||||||||||||||||||||||
|
Idaho Caucuses (D) |
- |
Open |
693,965 |
- |
- |
- |
88% |
- |
8% |
1% |
1% |
2 |
Bush by 38% |
|||||||||||||||||||||||||||||||||||||||||||||||||||||||||||||||||||||||||||||||||||||||||||||||||||||||||||||||||||||||||||||||||||||||||||||||||||||||||||||||||||||||||||||||||||||||||||||||||||||||||||||||||||||||||||||||||||||||||||||||||||||||||||||||||||||||||||||||||||||||||||||||||||||||||||||||||||||||||||||||||||||||||||||||||||||||||||||||||||||||||||||||||||||||||||||||||||||||||||||||||||||||||||||||||||||||||||||||||||||||||||||||||||||||||||||||||||||||||||||||||||||||||||||||||||||||||||||||||||||||||||||||||||||||||||||||||||||||||||||||||||||||||||||||||||||||||||||||||||||||||||||||||||||||
|
Montana Caucuses (R) |
- |
Closed |
649,436 |
- |
- |
- |
90% |
- |
2% |
1% |
6% |
1 |
Bush by 21% |
|||||||||||||||||||||||||||||||||||||||||||||||||||||||||||||||||||||||||||||||||||||||||||||||||||||||||||||||||||||||||||||||||||||||||||||||||||||||||||||||||||||||||||||||||||||||||||||||||||||||||||||||||||||||||||||||||||||||||||||||||||||||||||||||||||||||||||||||||||||||||||||||||||||||||||||||||||||||||||||||||||||||||||||||||||||||||||||||||||||||||||||||||||||||||||||||||||||||||||||||||||||||||||||||||||||||||||||||||||||||||||||||||||||||||||||||||||||||||||||||||||||||||||||||||||||||||||||||||||||||||||||||||||||||||||||||||||||||||||||||||||||||||||||||||||||||||||||||||||||||||||||||||||||||
|
New Mexico Caucuses (D) |
- |
Closed |
1,077,275 |
49% |
33% |
18% |
45% |
2% |
42% |
1% |
9% |
3 |
Bush by 0.8% |
|||||||||||||||||||||||||||||||||||||||||||||||||||||||||||||||||||||||||||||||||||||||||||||||||||||||||||||||||||||||||||||||||||||||||||||||||||||||||||||||||||||||||||||||||||||||||||||||||||||||||||||||||||||||||||||||||||||||||||||||||||||||||||||||||||||||||||||||||||||||||||||||||||||||||||||||||||||||||||||||||||||||||||||||||||||||||||||||||||||||||||||||||||||||||||||||||||||||||||||||||||||||||||||||||||||||||||||||||||||||||||||||||||||||||||||||||||||||||||||||||||||||||||||||||||||||||||||||||||||||||||||||||||||||||||||||||||||||||||||||||||||||||||||||||||||||||||||||||||||||||||||||||||||||
|
Utah Primary |
10:00 PM |
Open (D)/Closed* (R) |
1,474,483 |
8% |
36% |
56% |
85% |
1% |
9% |
2% |
1% |
3 |
Bush by 46% |
|||||||||||||||||||||||||||||||||||||||||||||||||||||||||||||||||||||||||||||||||||||||||||||||||||||||||||||||||||||||||||||||||||||||||||||||||||||||||||||||||||||||||||||||||||||||||||||||||||||||||||||||||||||||||||||||||||||||||||||||||||||||||||||||||||||||||||||||||||||||||||||||||||||||||||||||||||||||||||||||||||||||||||||||||||||||||||||||||||||||||||||||||||||||||||||||||||||||||||||||||||||||||||||||||||||||||||||||||||||||||||||||||||||||||||||||||||||||||||||||||||||||||||||||||||||||||||||||||||||||||||||||||||||||||||||||||||||||||||||||||||||||||||||||||||||||||||||||||||||||||||||||||||||||
|
AMERICAN TERRITORIES |
||||||||||||||||||||||||||||||||||||||||||||||||||||||||||||||||||||||||||||||||||||||||||||||||||||||||||||||||||||||||||||||||||||||||||||||||||||||||||||||||||||||||||||||||||||||||||||||||||||||||||||||||||||||||||||||||||||||||||||||||||||||||||||||||||||||||||||||||||||||||||||||||||||||||||||||||||||||||||||||||||||||||||||||||||||||||||||||||||||||||||||||||||||||||||||||||||||||||||||||||||||||||||||||||||||||||||||||||||||||||||||||||||||||||||||||||||||||||||||||||||||||||||||||||||||||||||||||||||||||||||||||||||||||||||||||||||||||||||||||||||||||||||||||||||||||||||||||||||||||||||||||||||||||||||||||||||||
|
American Samoa Caucus (D) |
- |
- |
- |
- |
- |
- |
- |
- |
- |
- |
- |
- |
- |
|||||||||||||||||||||||||||||||||||||||||||||||||||||||||||||||||||||||||||||||||||||||||||||||||||||||||||||||||||||||||||||||||||||||||||||||||||||||||||||||||||||||||||||||||||||||||||||||||||||||||||||||||||||||||||||||||||||||||||||||||||||||||||||||||||||||||||||||||||||||||||||||||||||||||||||||||||||||||||||||||||||||||||||||||||||||||||||||||||||||||||||||||||||||||||||||||||||||||||||||||||||||||||||||||||||||||||||||||||||||||||||||||||||||||||||||||||||||||||||||||||||||||||||||||||||||||||||||||||||||||||||||||||||||||||||||||||||||||||||||||||||||||||||||||||||||||||||||||||||||||||||||||||||||
|
Source: Race for the Presidency: Winning the 2008 Nomination (CQ Press), for poll closing times, voter participation rules and registered voters; The Almanac of American Politics 2008 (National Journal), for racial data; America Votes 26 (CQ Press), for the 2004 presidential vote and the number of congressional districts by state. .
Note: Note: "Closed" contests are restricted to the party's registered voters. Independents are allowed to participate in "Semi-open" contests. Any registered voter may participate in "Open" contests. A "Closed*" event basically means that it is limited to the party's registered voters plus others willing to affiliate with the party at the time of the primary or caucus. In the registration columns, a dash (-) indicates the state does not have party registration. North Dakota does not have voter registration. In the racial composition columns, a dash indicates that the total rounds down to 0 percent. The racial percentages are based on results of the 2000 Census and do not always add to 100 percent because not all racial categories are listed. Some of the party registration totals do not add up to 100 percent because of rounding. Source: Race for the Presidency: Winning the 2008 Nomination (CQ Press), for poll closing times, voter participation rules and registered voters; The Almanac of American Politics 2008 (National Journal), for racial data; America Votes 26 (CQ Press), for the 2004 presidential vote and the number of congressional districts by state. |
||||||||||||||||||||||||||||||||||||||||||||||||||||||||||||||||||||||||||||||||||||||||||||||||||||||||||||||||||||||||||||||||||||||||||||||||||||||||||||||||||||||||||||||||||||||||||||||||||||||||||||||||||||||||||||||||||||||||||||||||||||||||||||||||||||||||||||||||||||||||||||||||||||||||||||||||||||||||||||||||||||||||||||||||||||||||||||||||||||||||||||||||||||||||||||||||||||||||||||||||||||||||||||||||||||||||||||||||||||||||||||||||||||||||||||||||||||||||||||||||||||||||||||||||||||||||||||||||||||||||||||||||||||||||||||||||||||||||||||||||||||||||||||||||||||||||||||||||||||||||||||||||||||||||||||||||||||
The one area where the Democrats and Republicans operate on quite different playing fields is in the realm of awarding delegates. Democrats require that delegates be elected to proportionally reflect the primary or caucus vote, with 15 percent statewide or in a congressional district needed to qualify for a share. Republicans allow for a variety of delegate allocation methods, from proportional representation to winner-take-all. And next Tuesday, most states on the Republican side will be using some variation of winner-take-all.
Yet ultimately, the big question is whether either party will have a decisive outcome on Feb. 5 as the Republicans did on Super Tuesday 1988? Then, Vice President George H.W. Bush swept every primary and all but one caucus state, essentially wrapping up the GOP nomination right there.
Or might one or both parties next Tuesday have a fragmented outcome like the Democrats did in early March two decades ago? Michael Dukakis, Jesse Jackson and Al Gore each won five primary states that day and divided the delegates--an inconclusive result that sent the Democratic contest hurdling on for weeks to come.
Results will trickle in next Tuesday night much like they will do in November. Polls in Georgia are scheduled to close at 7 p.m. An hour later every primary state east of the Mississippi River except New York will begin reporting their results. Polls in the Empire State will close at 9 p.m. Arizona will begin reporting its results the same hour. Utah will follow at 10 p.m. Eastern time, California at 11.
Yet it will be not be in a primary or caucus where the first delegates of the day are chosen. It will be at a convention of West Virginia Republicans in Charleston, where roughly 1,500 delegates from around the state will convene at 9 a.m. in a setting resembling a national convention. Much like their counterparts at the national level, delegates will sit under their county signs, with a roll call vote of the state's 55 counties taking place in alphabetical order. It could take one, two or three ballots for one of the presidential candidates to win the majority of the vote that is necessary to capture the 18 national convention delegates at stake. State GOP officials hope to have a result to announce by early afternoon.
At the least, the West Virginia Republican convention will be the "Dixville Notch" of Super Tuesday, reporting its tally of delegates several hours before the rest of the country. But just maybe, the event could be something more--the precursor of the first multi-ballot national convention in more than a half century. Does the chance still exist for the Republicans to have such a protracted convention this summer, or even the Democrats? The full results from this largest of all primary and caucus days Feb. 5 could tell the tale.
Related Articles


Rasmussen Reports is a media company specializing in the collection, publication and distribution of public opinion information.
We conduct public opinion polls on a variety of topics to inform our audience on events in the news and other topics of interest. To ensure editorial control and independence, we pay for the polls ourselves and generate revenue through the sale of subscriptions, sponsorships, and advertising. Nightly polling on politics, business and lifestyle topics provides the content to update the Rasmussen Reports web site many times each day. If it's in the news, it's in our polls. Additionally, the data drives a daily update newsletter and various media outlets across the country.
Some information, including the Rasmussen Reports daily Presidential Tracking Poll and commentaries are available for free to the general public. Subscriptions are available for $4.95 a month or 34.95 a year that provide subscribers with exclusive access to more than 20 stories per week on upcoming elections, consumer confidence, and issues that affect us all. For those who are really into the numbers, Platinum Members can review demographic crosstabs and a full history of our data.
To learn more about our methodology, click here.