States of Play: Pennsylvania
A Commentary By Rhodes Cook
KEY POINTS FROM THIS ARTICLE
— In 2016, Donald Trump inspired higher Republican turnout in Pennsylvania, while Hillary Clinton couldn’t offset her losses in the non-metro parts of the state.
— Voter registration trends in Pennsylvania are mirroring the 2016 picture — all of the counties in Philadelphia’s suburban collar are Democratic by registration while Republicans have flipped some working class counties.
— With the third party vote projected to be down from 2020, former Gov. Bill Weld’s (R-MA) relative strength as a Republican protest presidential candidate in this month’s Pennsylvania Republican primary may be a warning sign for Trump.
— Joe Biden, who frequently talks up his working class Scranton background, gives Democrats a good chance to move the state back into the blue column, but it’ll hardly be an automatic shift.
States of Play: Pennsylvania
The drive from Hagerstown, Md., north to State College, Pa., is about 110 miles. Two-lane roads connect the two, running through bucolic farmland, over forested mountains, and in and out of a succession of small towns, with names such as Burnt Cabins, Shade Gap, Shirleysburg, and Orbisonia. There are occasional signs of prosperity, but many of these communities are economically strapped. It is “God and guns” country. And in 2016, it was also Donald Trump country.
Early that October, this author made the drive, counting yard signs along the way. And upon reaching State College, the tally stood at two signs for Hillary Rodham Clinton and 68 for Trump. To be sure, the drive was basically through a Republican swath of Pennsylvania. Yet the number of Trump signs was unusually high for a presidential election, and were up more than a month before the November balloting. They did not appear to be the work of one person, or even a small team of Trump campaign workers, but of individuals of like mind expressing a similar sentiment.
Counting yard signs is not scientific. It is not a poll. But the result of this personal count that day spoke to an intensity of support for Trump’s anti-establishment, outsider candidacy in this slice of rural, small-town America. The numerous signs gave the sense that something big was happening, but what that might be was unclear until Election Day, Nov. 8, 2016.
From 1992 through 2012, Democrats had made Pennsylvania a critical part of their Rust Belt “firewall,” winning it in six straight presidential elections. They had done so by executing a simple formula: Build a large lead in Philadelphia (with its sizable minority population), add to the margin in its adjacent suburbs and across the state in Allegheny County (Pittsburgh). Then, fend off a Republican counter-surge in the more conservative remainder of Pennsylvania with its smaller cities, old industrial centers, and rural terrain.
As Election Night 2016 began to unfold, it looked as though the Democratic formula would work once again. Clinton rolled out of Philadelphia with a huge lead of 475,000 votes, added another 188,000 votes to her margin in its suburbs, and then an additional 108,000 votes in Allegheny County. Taken together, these large Democratic metro centers had more than done their part, giving Clinton a whopping lead of 771,767 votes. It far surpassed Barack Obama’s 706,314-vote advantage in these same places in 2012, en route to an Obama statewide victory of more than 300,000 votes.
However, as Election Night progressed, the unexpected happened. Clinton’s lead dwindled and dwindled and dwindled, until Trump finally pulled ahead and won Pennsylvania by the thin margin of 44,292 votes out of more than 6.1 million cast. The “hinterland” had outperformed the populous “cosmopolitan” centers at the ballot box.
But it took a two-way flow of votes to ensure Trump’s victory. The statewide Republican presidential vote was up dramatically from 2012, to a Pennsylvania GOP record of 2.97 million, while the Democratic presidential vote dropped to 2.93 million, the party’s lowest presidential tally in the Keystone State since 2000. And this two-way flow — the Republican vote up, the Democratic vote down — was on steroids in Pennsylvania’s vast interior.
Altogether, Trump’s vote tally was nearly 300,000 more than Republican standard-bearer Mitt Romney’s total in 2012, with all of the gains coming in Pennsylvania’s heartland. Meanwhile, in that same territory, Clinton’s total was down by more than 125,000 votes from Obama’s total four years earlier. Taken together, the Republican margin outside the Philadelphia and Pittsburgh areas more than doubled from 2012, exploding to more than 800,000 votes. It was just enough to overturn Clinton’s huge lead in the large metro centers.
Trump’s new coalition
When Republican presidential candidates were carrying Pennsylvania in the 1980s behind Ronald Reagan and George H.W. Bush, they tied together the Philadelphia suburbs, smaller urban counties such as Lancaster, Lebanon, and York, along with small towns and rural areas of the state’s interior. In 2016, with the suburbs trending Democratic, Trump had to splice together a different coalition that accented a combination of the historically WASPish Republican towns of central Pennsylvania with heavily ethnic, formerly Democratic industrial strongholds in northeast, northwest, and western Pennsylvania.
Of the state’s 67 counties, 61 are in this part of the state, of which Trump carried 56. To be sure, the Republican trend in the industrial areas had been under way for years. But Trump increased the volume of the GOP presidential vote in every one of the 61 counties from 2012. Often, it was by a large amount. In Luzerne County (Wilkes-Barre), in the coal country of northeast Pennsylvania, the number of Republican presidential ballots shot up by 35%, from less than 60,000 in 2012 to nearly 80,000 for Trump. The surge enabled him to be the first GOP presidential candidate to carry Luzerne since 1988. He also flipped Erie County, in Pennsylvania’s northwestern corner, from Democratic in 2012 to Republican in 2016, as well as Northampton (Bethlehem) in the Lehigh Valley north of Philadelphia.
Altogether, Trump drove up the number of Republican presidential votes by at least 10 percentage points from four years earlier in all but a half dozen of the 61 “interior” counties, and by at least 25 points in more than a dozen of them.
The new Trump coalition, a combination of life-long Republicans, disgruntled Democrats and independents, and non-voters, has been called angry, aggrieved, and overlooked. Trump assiduously courted them with his brash sense of confidence, promising to renegotiate what he saw as “job killing” international trade deals that would ultimately bring old and new industries alike to Pennsylvania. But he also connected with voters in the state’s heartland by expressing his affinity with their culture of church, country, and guns, and he pledged to be their voice in Washington.
The Trump campaign’s courtship of these voters in 2016 was hard to miss, from the ubiquitous campaign signs to high-decibel rallies in arenas “off the beaten path.” The effort was so successful that by Election Day that year the large Trump vote was solid and hidden in plain sight.
But even this may not have been enough to carry Pennsylvania if Democrats had not conspired in their own defeat. If Clinton had just been able to match the 2012 Obama vote — 2.99 million — she would have been able to beat back Trump in Pennsylvania. Instead, the Democrats were well along in the process of trading the votes of socially conservative blue-collar workers for more socially liberal white-collar voters in the affluent suburbs. Through six straight Democratic victories, it had been a worthwhile trade as the party held enough of the non-metro blue-collar vote each election to make it work.
Yet in 2016, Clinton was in poor position to compete with Trump for these voters. Her platform — pro-gun control, supportive of federal action on climate change, and anti-coal — was fashioned for the nation’s large cities and suburbs. And a couple of maladroit remarks in 2016 made her situation even more untenable. In a state with a strong coal mining heritage in its northeastern and western parts, Clinton inexplicably said in March 2016 that “we’re going to put a lot of coal miners and coal companies out of business.” That September, she added to the damage by declaring at a New York City fundraiser that half of Trump’s backers belonged in a “basket of deplorables.” The remark was not explicitly aimed at Pennsylvania voters outside the state’s large cities and suburbs, but it might as well have been.
All this followed by eight years a provocative comment by Obama at a San Francisco fundraiser about voters in small-town Pennsylvania who “cling to guns or religion or antipathy toward people who aren’t like them… as a way to explain their frustrations.” Given the starkness of the remark, Obama was fortunate to run as well as he did in 2008 and 2012 outside the Philadelphia and Pittsburgh areas. Yet his comment and those of Clinton underscored a sense of growing estrangement between Democrats and their once loyal blue-collar voters that may not be easy to repair in 2020.
Looking ahead to November
In Joe Biden, Democrats are probably fielding the best candidate they could this year to reach Pennsylvania’s “Trump country” voters. Throughout his political career, Biden has portrayed himself as an outgoing “average Joe,” comfortable with mingling with blue-collar workers in their ethnic halls and VFWs. For good measure, he was born in Pennsylvania, Scranton to be precise. And while his family moved to Delaware when he was a boy, his home base of Wilmington is just a few miles south of the Pennsylvania border within the Philadelphia media market. Over the years, Biden has come back often to Pennsylvania to campaign for Democratic candidates, and he has established his national campaign headquarters in Philadelphia. He will surely try to run this year as the state’s favorite son.
As of June 26, the RealClearPolitics rolling average of polls showed Biden with a lead of 6.3 percentage points over Trump in Pennsylvania. That, however, must be taken with a grain of salt. Four years ago, RealClearPolitics showed Clinton on Election Day with a lead in Pennsylvania that was down to 1.9 points, before Trump carried the state by seven-tenths (0.7) of a point. Apparently, many of the late deciders in Pennsylvania (as elsewhere) broke for the Republican. It is also quite possible that the size of the Trump vote in 2016 was routinely under polled because either a number of voters did not feel comfortable telling pollsters that they were for the brash Manhattan billionaire or were genuinely undecided until the end and broke toward the challenger. That could happen again in 2020.
During the Trump presidency, Pennsylvania Republicans have chipped away a bit at the Democrats’ wide voter registration advantage. At points during the Obama years, registered Democrats outnumbered registered Republicans by more than 1 million. The Democratic lead had dropped to around 915,000 when Trump was elected in 2016 and this June was barely 800,000. (In addition, more than 1.2 million Pennsylvanians are registered as independents or as members of third parties.)
As a statewide figure, the sizable Democratic registration advantage is rarely matched by a similar degree of Democratic success at the polls. More significant are the registration trends, with each party since Trump’s election picking up additional voters in strongholds that are fairly new to the party — for Republicans, the once Democratic industrial areas; and for Democrats, the once Republican suburbs of Philadelphia.
For the first time ever, the four suburban counties all have Democratic registration leads, with Chester the last of the four to flip to the Democrats this May. In Bucks County, the Democratic registration edge has increased from less than 10,000 in November 2016 to more than 15,000 in June 2020. In Delaware County, what was a Democratic edge of less than 20,000 when Trump was elected has swelled to more than 40,000 this month. And in Montgomery County, once the cornerstone of the Pennsylvania Republican Party, a Democratic registration margin approaching 55,000 in November 2016 has now blown past 85,000.
On the other hand, Republican registrations are surging in pockets of blue-collar strength outstate. In Beaver County, along the Ohio border, a Democratic registration lead approaching 20,000 at the time of Trump’s election is now barely half that. In Cambria County (Johnstown), a Democratic registration advantage exceeding 12,000 in November 2016 is barely 2,000 this spring. And in Westmoreland County outside Pittsburgh, the registration lead has flipped from Democratic to Republican during Trump’s three-plus years in the Oval Office.
Meanwhile, the state’s presidential primary June 2 gave Biden and Trump a chance to test their vote-getting appeal in Pennsylvania. By and large, both passed their test with flying colors in contests that were largely non-competitive. Biden drew 79% of the 1.59-million Democratic primary votes against Sen. Bernie Sanders (18%) and Rep. Tulsi Gabbard (3%), both of whom had already quit the Democratic race and endorsed Biden. Trump won 92% of the 1.14-million Republican primary votes against former Massachusetts Gov. William Weld (6%) and perennial candidate Roque “Rocky” De La Fuente (2%).
The votes for Weld could be a problem for the president come fall as they were cast by GOP voters for a candidate who was viscerally anti-Trump. Weld’s total of nearly 70,000 votes in the Republican primary in Pennsylvania represented his highest total in the entire 2020 primary season and was 25,000 votes more than Trump’s 2016 margin of victory in the state. It would be surprising if there were more than a small handful of Republicans who voted for Weld in the spring and would then turn around and vote for Trump in the fall. More likely, many of Weld’s voters would end up with Biden, if they vote for president at all.
Still, it will be a tall order for the Democrats to defeat the president in Pennsylvania. He has carried the state once already and has cultivated it since then. And he has already signaled that he will not relinquish Pennsylvania and its 20 electoral votes without a tough fight. Case in point: his appearance at a town hall this March in Biden’s home town of Scranton. There, the 74-year-old Trump launched a sharp volley at the 77-year-old Biden, questioning his mental competence to be president.
Meanwhile, since the coronavirus has taken hold in the United States, Biden has made several trips to the Philadelphia area for campaign events that are not far from his Delaware home. Last week, he traveled just west of the Philadelphia suburbs to Lancaster County, the heart of Pennsylvania Dutch country where Republicans have been losing their hegemony as the county’s population grows. There, Biden got in some licks of his own against the president, criticizing Trump’s response to the coronavirus by saying: “He’s like a child who just can’t believe this has happened to him. It’s all whining and self-pity.” In case anyone had not yet noticed, this year’s fight for the battleground state of Pennsylvania is on.
What follows are a series of tables exploring the recent voting in Pennsylvania (Tables 1-8) as well as Map 1, which shows how the state’s presidential voting patterns have changed over the last three elections.
Table 1: States decided by 2% or less in 2016
Donald J. Trump lost the popular vote in the 2016 presidential election to Hillary Rodham Clinton by nearly 3 million. Yet he won the White House by taking several large electoral vote prizes by small margins. Among the states that Trump won by a margin of less than two percentage points were Florida (29 electoral votes), Pennsylvania (20), Michigan (16), and Wisconsin (10). They provided him with 75 electoral votes of the 304 he netted (270 were needed for victory). In the process, he defied the polls. On Election Day 2016, the RealClearPolitics rolling average of battleground state surveys showed Hillary Rodham Clinton with a lead of 1.9 percentage points in Pennsylvania, 3.4 points in Michigan, and 6.5 points in Wisconsin, while Trump led the RealClearPolitics polling in Florida by 0.2. Meanwhile, Clinton won just two states by less than two percentage points, Minnesota (10 electoral votes) and New Hampshire (4). Together, they totaled only 14 electoral votes. |
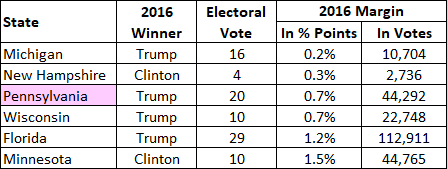
Source: America Votes 32 (CQ Press, an imprint of SAGE).
Table 2: Winning Pennsylvania since 1960
From 1992 through 2012, Pennsylvania was a part of the Democrats’ “blue wall” — an array of Rust Belt industrial states that helped the Democrats win the electoral vote in four of the six presidential elections in that 20-year period and the nationwide popular vote in five of the six. However, Donald Trump breached the firewall in 2016, picking off Pennsylvania, Michigan, and Wisconsin, in the process transforming the three into prime battleground states for 2020. Like other states of the industrial Rust Belt, the three do not offer the number of electoral votes that they once did. Yet while their electoral vote total has been declining by the decade, the trio gave Trump 46 electoral votes in 2016, pushing his total over the 270 needed to be elected president. Of the three, Pennsylvania will offer the most electoral votes this year (20), followed by Michigan (16), and Wisconsin (10). In each election listed below, the name of the candidate that carried Pennsylvania is capitalized and his winning percentage of the total vote listed in bold type. Incumbents are denoted with *. |
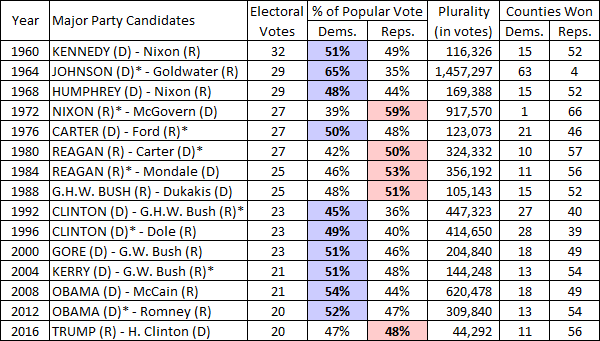
Sources: America at the Polls 1960-2004: John F. Kennedy to George W. Bush (CQ Press). The 2008, 2012, and 2016 editions of America Votes (CQ Press, an imprint of SAGE) for presidential elections since then.
Table 3: PA cities, suburbs, and rest of state since 2000
From 1992 through 2012, Democrats carried Pennsylvania in six straight presidential elections. They did so by executing a straightforward formula: roar out of Philadelphia with a huge lead, build the margin in its suburbs and across the state in Allegheny County (Pittsburgh), then fend off a Republican countersurge in the rest of the state. It looked on Election Night 2016 as though Hillary Rodham Clinton was on her way to posting the Democrats’ seventh consecutive Keystone State victory, as she rolled out of the populous metro areas with a larger lead (771,767 votes) than Barack Obama had amassed in 2012 (706,314 votes). But as the vote from the rest of the state came in, Clinton’s lead melted and melted and melted, until it had totally disappeared. Basically, Trump had constructed his own winning coalition that combined massive votes in traditional Republican small towns and rural areas, with the state’s historic industrial areas in western, northwestern, and northeastern Pennsylvania. Yet in spite of the unexpected outcome, there was no significant redistribution of the overall regional vote in 2016. As in the presidential elections before then, about 45% of the vote was cast in the large Democratic metro areas and 55% in the rest of the state. Table 3 shows the margins of victory by state and by region in terms of actual votes in the last five presidential elections, as well as the share of the vote cast in each election by these various parts of the state. |
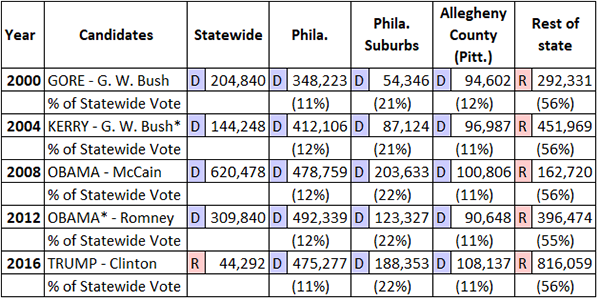
Note: The percentage of the vote that each of these areas of Pennsylvania cast in presidential elections since 2000 do not always add to 100 due to rounding. An asterisk (*) indicates an incumbent. The four suburban counties outside Philadelphia are: Bucks, Chester, Delaware, and Montgomery.
Sources: America at the Polls 1960-2004: John F. Kennedy to George W. Bush (CQ Press). The 2008, 2012, and 2016 editions of America Votes (CQ Press, an imprint of SAGE) for presidential elections since then.
Table 4: PA counties that switched parties in 2012, 2016
Pennsylvania has 67 counties. In 2008, Barack Obama carried just 18 of them yet won Pennsylvania by more than 600,000 votes. In 2012, Obama took only 13 counties but still prevailed by more than 300,000 votes. In 2016, the number of counties taken by Clinton sank to 11 and she lost the Keystone State by nearly 45,000 votes. Over the last two presidential elections, a net of seven counties have switched from the Democrats to the Republicans, all of them outside the Philadelphia and Pittsburgh metro areas and nearly all of them featuring an industrial heritage. Three of these counties — Erie, Luzerne (Wilkes-Barre), and Northampton (Bethlehem) — were pulled by Donald Trump into the Republican presidential column in 2016 for the first time in years. Luzerne and Northampton had last voted for a Republican presidential candidate in 1988, Erie in 1984. Meanwhile, Democrats continued their advance in the Philadelphia suburbs, as Chester County voted for Hillary Rodham Clinton in 2016 after favoring Republican Mitt Romney in 2012. |
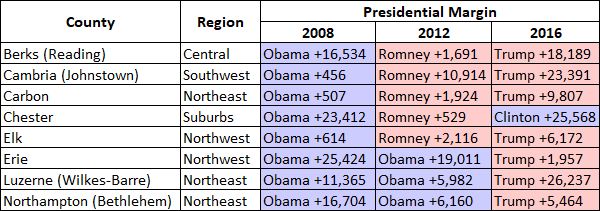
Note: The various regions of Pennsylvania are from the Keystone Poll, now the Franklin and Marshall College Poll.
Sources: America Votes 28, 30, 32 (CQ Press, an imprint of SAGE).
As Map 1 shows, down to the township level, the Obama areas that Trump flipped in 2016 were mostly found in the northeast and southwest, with their history of mining, as well as in Erie County, at the northwestern edge of the state. In the southeast, though, Chester County was the Romney > Clinton capital of the state.
Map 1: Pennsylvania partisan loyalty by town, 2008-2016
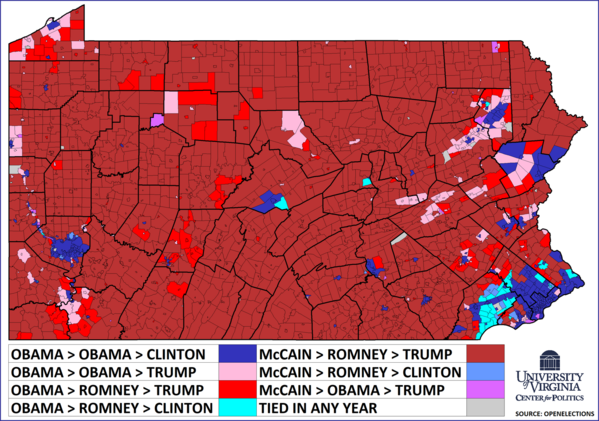
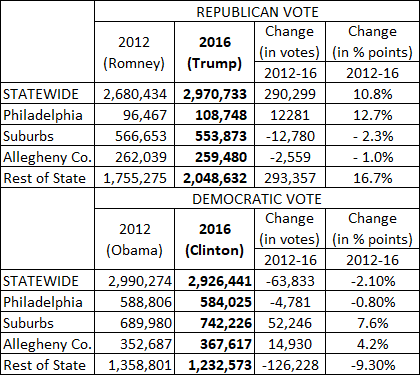
Table 5: PA GOP ballots up in ’16, Democratic vote down
Two big factors were at play in the 2016 presidential voting in Pennsylvania that enabled Donald Trump to score his unexpected victory. First was a significant increase in the number of Republican ballots cast from 2012 — up 290,299. Second was a decrease in the Democratic presidential vote from four years earlier — down 63,833. The result was that Trump won more votes in Pennsylvania than any previous Republican presidential candidate, while Hillary Rodham Clinton garnered fewer votes in the Keystone State than any Democratic presidential nominee since Al Gore in 2000. Clinton ran well enough in the Democratic metro areas: Philadelphia, its suburbs, and Allegheny County (Pittsburgh). In the Philadelphia suburbs alone, she finished more than 50,000 votes ahead of Barack Obama in 2012. Yet in 2016, the outcome ultimately swung on the vote in the vast non-metro areas of the state. There, the number of GOP presidential ballots was up by nearly 300,000, while the Democratic vote declined by more than 125,000. That falloff proved fatal for Clinton. If she had been able to hold the statewide vote that Barack Obama won in Pennsylvania in 2012 — 2,990,274 — she would have carried the state. |
Sources: America Votes 30, 32 (CQ Press, an imprint of SAGE).
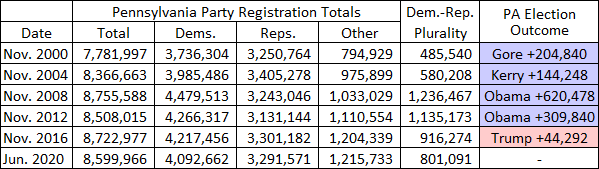
Table 6: Voter registration trends since 2000
Over the brief course of the 21st century, Pennsylvania Democrats have had a large advantage in voter registration over their Republican counterparts. The Democratic registration plurality reached well beyond 1 million voters in the early Obama years. However, the Democrats have not won the state in presidential voting by anywhere near that margin since Lyndon B. Johnson’s more than 1.45-million vote landslide over Republican Barry Goldwater in 1964. In recent years, the Democratic registration advantage has decreased to barely 800,000. From Donald Trump’s election in 2016 to this June, the number of registered Democrats in Pennsylvania has dropped by 125,000, while the number of registered Republicans has fallen by roughly 10,000 voters. As in many other states, the number of independent (and third party) voters in Pennsylvania has been on a steady rise, growing from less than 800,000 in November 2000 to better than 1.2 million this June. A large hunk of the independent vote plus significant inroads among blue-collar Democrats enabled Donald Trump to carry the Keystone State in 2016 by 44,292 votes. He became the first Republican to do so since George H.W. Bush in 1988. |
Note: Voter registration totals are sometimes taken with a grain of salt since it is not always clear how much “deadwood” is on the rolls. However, registration trends are often taken more seriously.
Source: Party registration totals are from the web site of the Pennsylvania secretary of state, with the latest as of June 15, 2020.
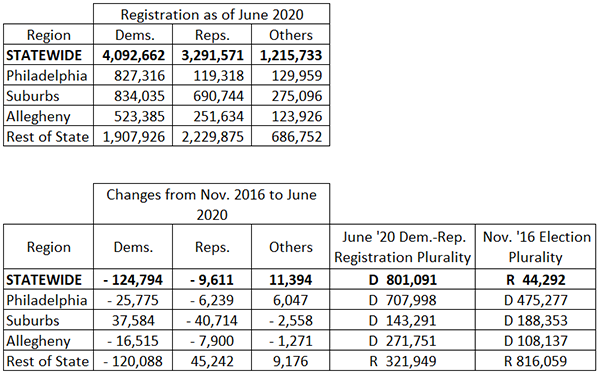
Table 7: Voter registration trends since Nov. 2016
Since Donald Trump’s election in November 2016, the Philadelphia suburbs have grown more Democratic, populous Philadelphia and Allegheny (Pittsburgh) counties have remained overwhelmingly Democratic, while the rest of the state — where Trump fashioned his unexpected Pennsylvania victory four years ago — has grown more Republican. At least, that is the case when comparing party registration totals from November 2016 to June 2020. The Philadelphia suburbs, once a Republican stronghold, now have a Democratic registration advantage in all four counties, with Chester County flipping to the Democrats in May. It is reportedly the first time there have been more Democrats than Republicans in the county since the Civil War. On the other hand, since 2016, Republicans have gained the registration advantage in several counties that Trump carried easily, including Lawrence and Westmoreland in industrial western Pennsylvania and Carbon County in the old mining country of the northeast. |
Source: Party registration totals are from the website of the Pennsylvania secretary of state, and are as of November 2016 and June 15, 2020.
Table 8: The Weld factor
President Donald Trump has dominated this year’s Republican presidential primaries, not only winning all of them with ease but taking an aggregate 94% of the party’s nationwide primary vote. In Pennsylvania, his winning percentage was 92%. Yet Trump’s chief challenger as it was, former Massachusetts Gov. William Weld, drew more votes in the June 2 Pennsylvania Republican presidential primary than any other state in which he was on the ballot, including California. Of added significance, Weld’s Keystone State primary total (nearly 70,000) far exceeded Trump’s statewide margin in November 2016 (44,292). Pennsylvania is the only state in the country where that has happened. With Weld viscerally anti-Trump, his voters could be critical in the fall to whom wins Pennsylvania. It is doubtful that more than a small handful of Weld’s Republican primary voters would go to Trump in November. More likely, the bulk would cross-over to support Democrat Joe Biden, skip the presidential part of the ballot, or sit out the election altogether. |
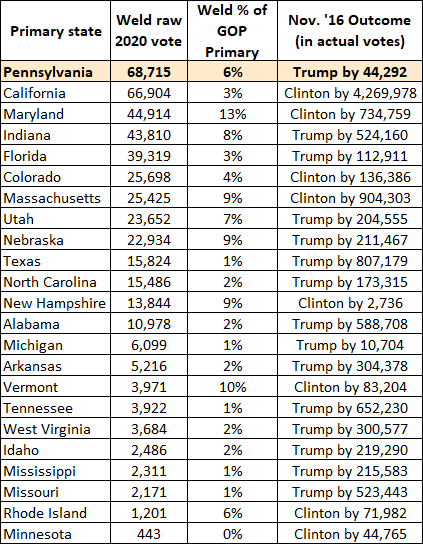
Note: William Weld’s Republican primary vote is based on official returns from all states except Indiana, Maryland, Pennsylvania, Rhode Island, and West Virginia, where the results are nearly complete but unofficial as of June 19, 2020. There were 34 Republican presidential primaries held through then, and Weld drew votes in 23 of them.
Sources: Republican primary vote totals are from the websites of election authorities in states that held Republican presidential primaries in 2020 and William Weld received votes. The statewide victory margins from 2016 are from America Votes 32 (CQ Press, an imprint of SAGE).
Rhodes Cook was a political reporter for Congressional Quarterly for more than two decades and is a senior columnist at Sabato’s Crystal Ball.
See Other Political Commentary by Rhodes Cook.
See Other Political Commentary.
This article is reprinted from Sabato's Crystal Ball.
Views expressed in this column are those of the author, not those of Rasmussen Reports. Comments about this content should be directed to the author or syndicate.
Related Articles

Rasmussen Reports is a media company specializing in the collection, publication and distribution of public opinion information.
We conduct public opinion polls on a variety of topics to inform our audience on events in the news and other topics of interest. To ensure editorial control and independence, we pay for the polls ourselves and generate revenue through the sale of subscriptions, sponsorships, and advertising. Nightly polling on politics, business and lifestyle topics provides the content to update the Rasmussen Reports web site many times each day. If it's in the news, it's in our polls. Additionally, the data drives a daily update newsletter and various media outlets across the country.
Some information, including the Rasmussen Reports daily Presidential Tracking Poll and commentaries are available for free to the general public. Subscriptions are available for $4.95 a month or 34.95 a year that provide subscribers with exclusive access to more than 20 stories per week on upcoming elections, consumer confidence, and issues that affect us all. For those who are really into the numbers, Platinum Members can review demographic crosstabs and a full history of our data.
To learn more about our methodology, click here.